

Forecast for future market trends, strategies and opportunity currencies (Aug 30–)
Hello, this is Onepiece Trade@onepipst)
I would like to forecast the market for 8/30 onwards, establish a strategy, and look for entry points
I draw horizontal lines and trendlines based on the daily chart
I also tweet about profits and other useful information,so pleasefollow Twitter.
Table of contents
- USD/JPY
- EUR/USD
- EUR/JPY
- GBP/USD
- GBP/JPY
- Afterword
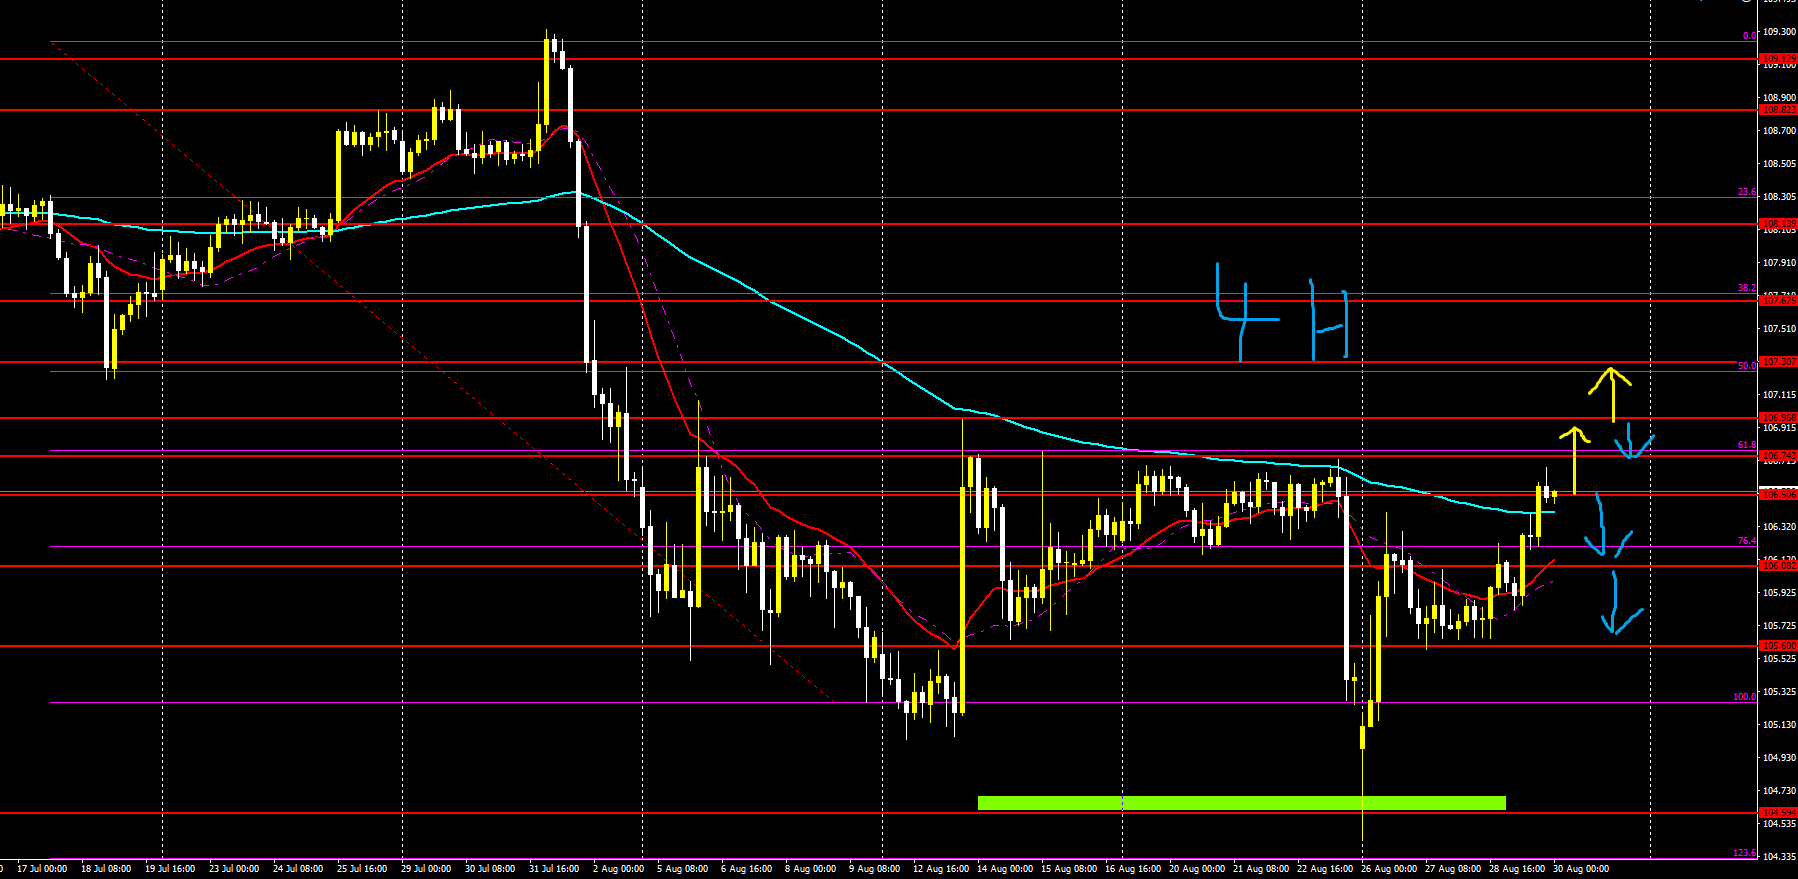
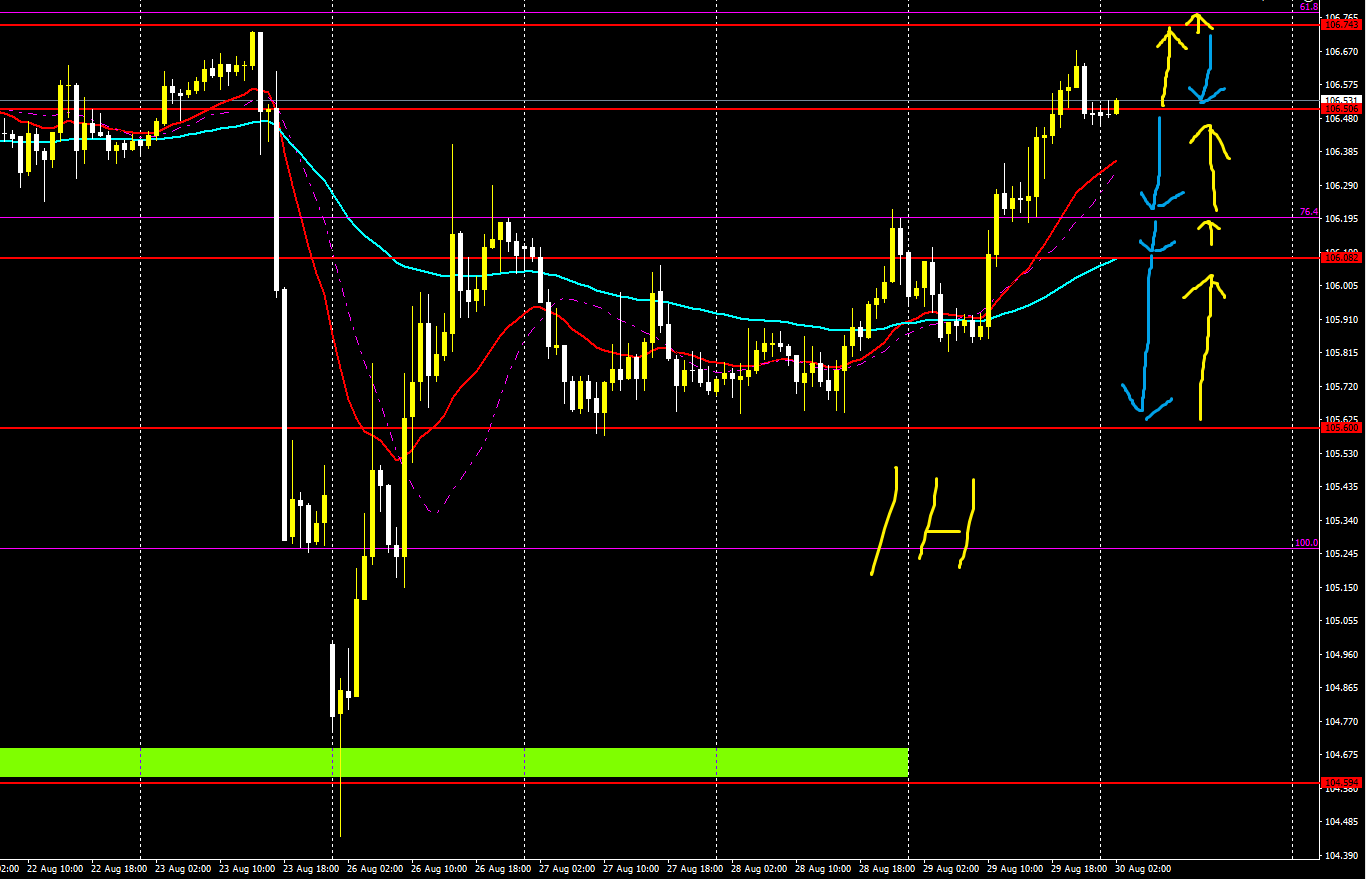
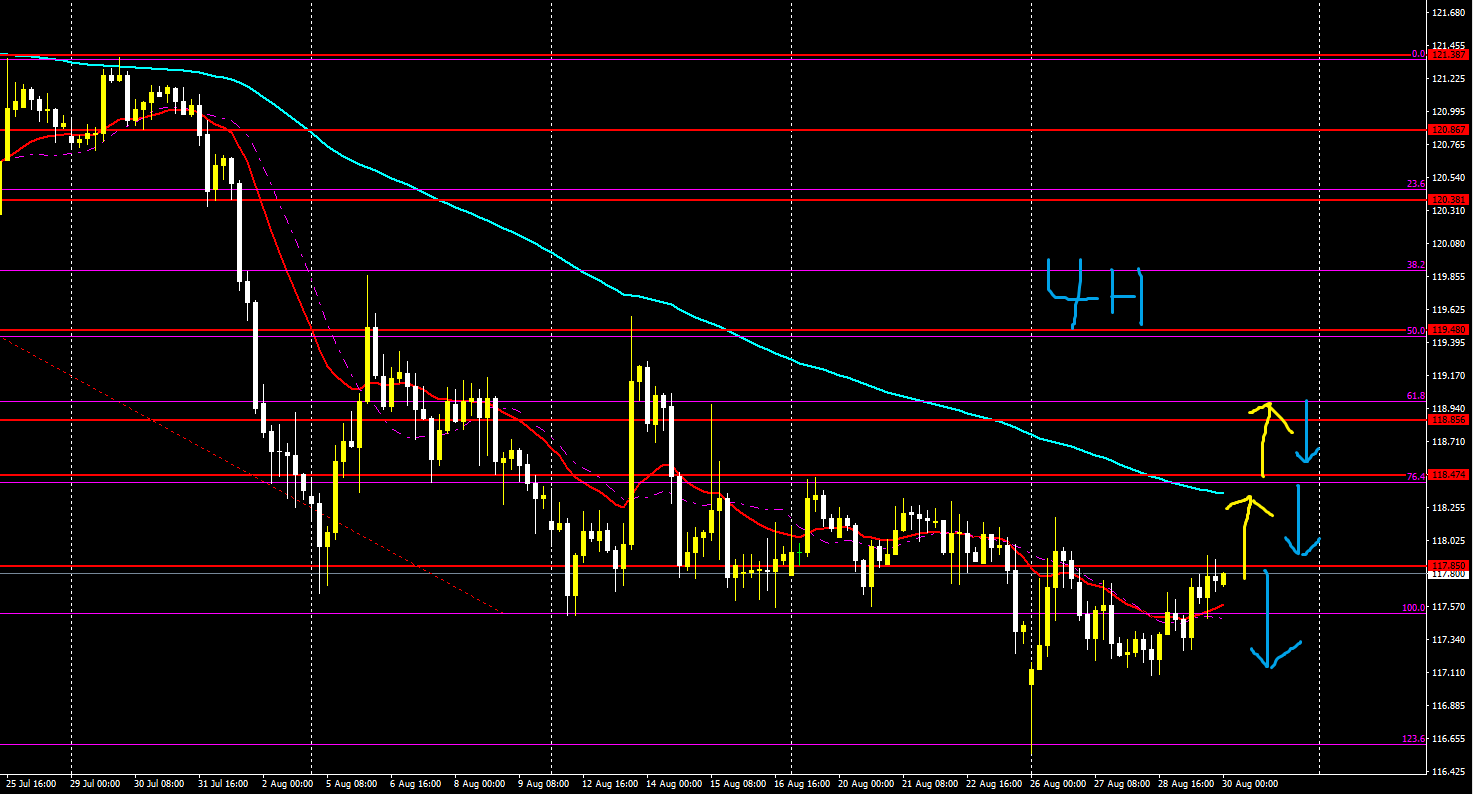
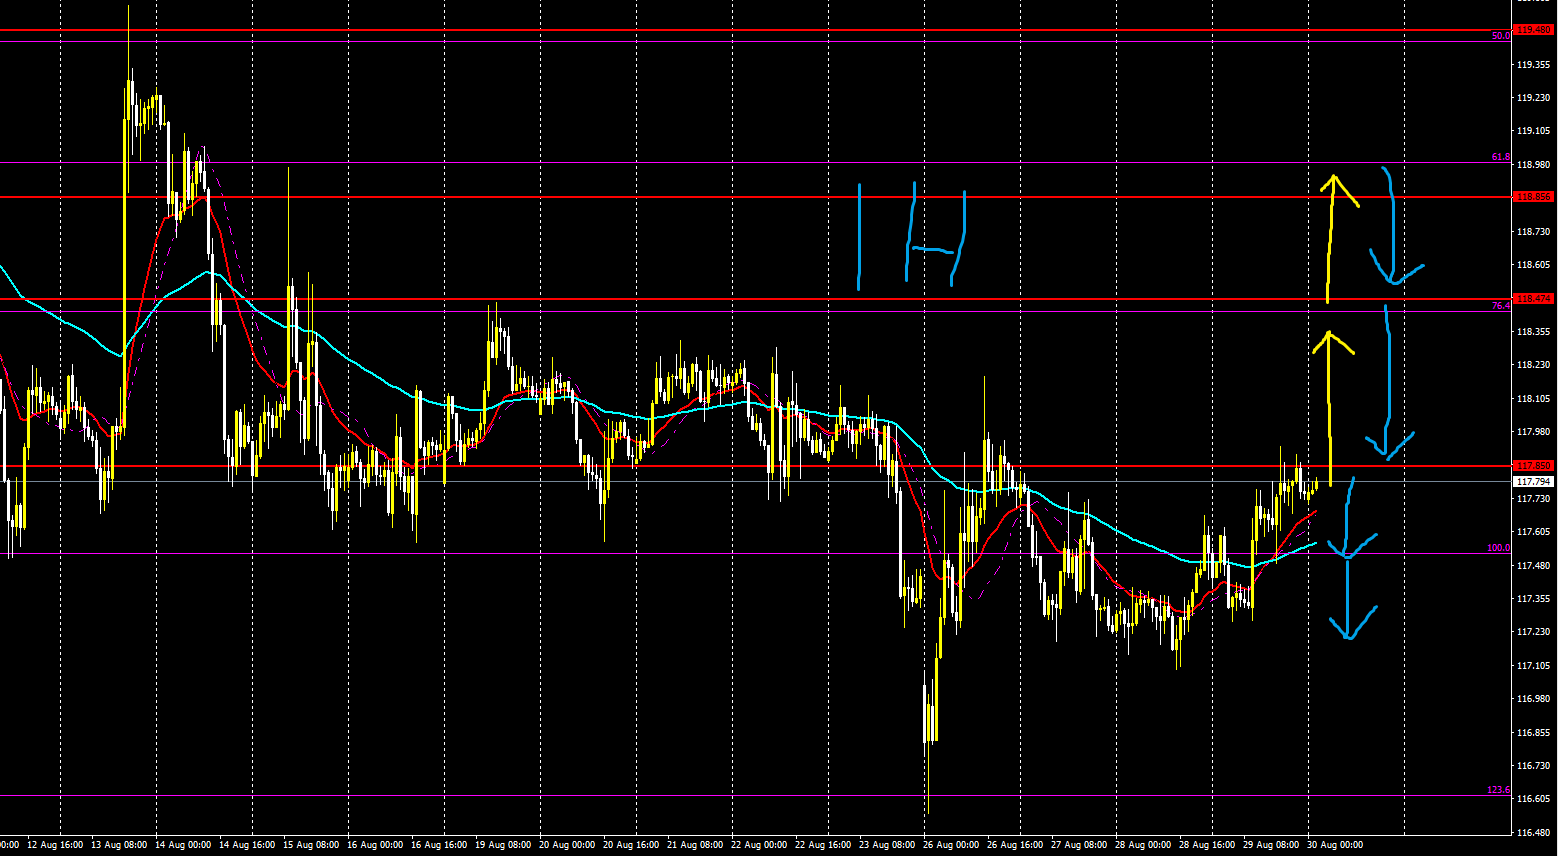
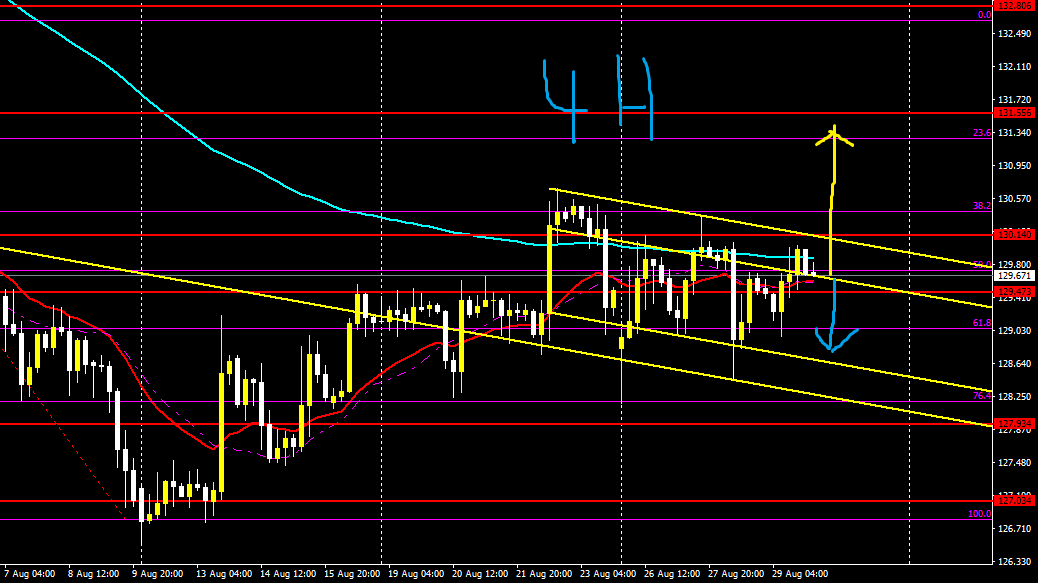
【USD/JPY】
Trading difficulty B–
Long-term perspective down, short-term slightly up
Since the rate has reached the recent resistance, selling pressure may come in
So it might be okay to go short
Conversely, if it breaks, buying could come in up to 50% or 38% of the Fibonacci levels
If buying, target up to Fibonacci 50
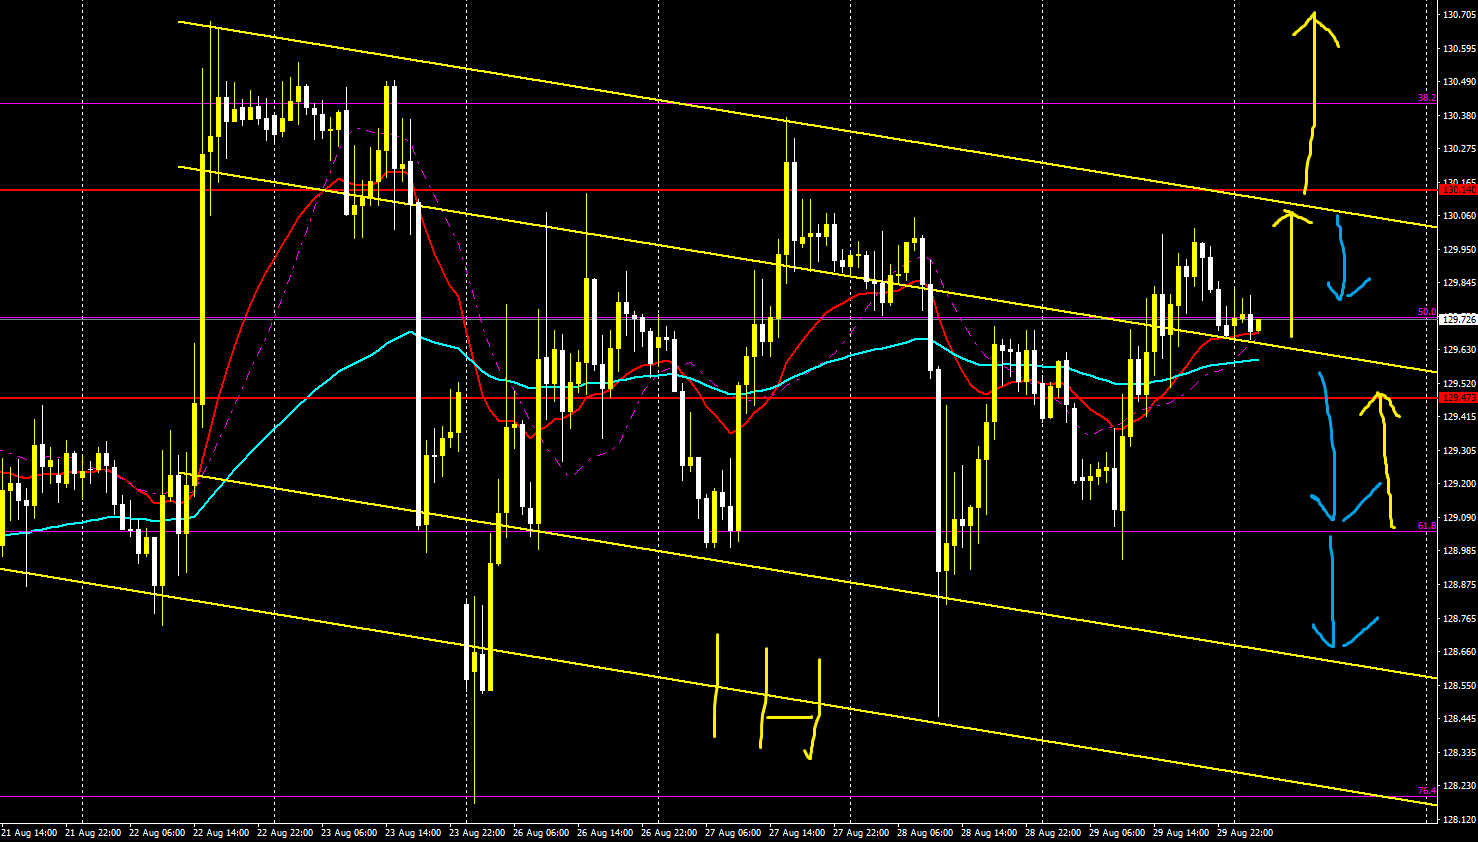
4 hours
1 hour
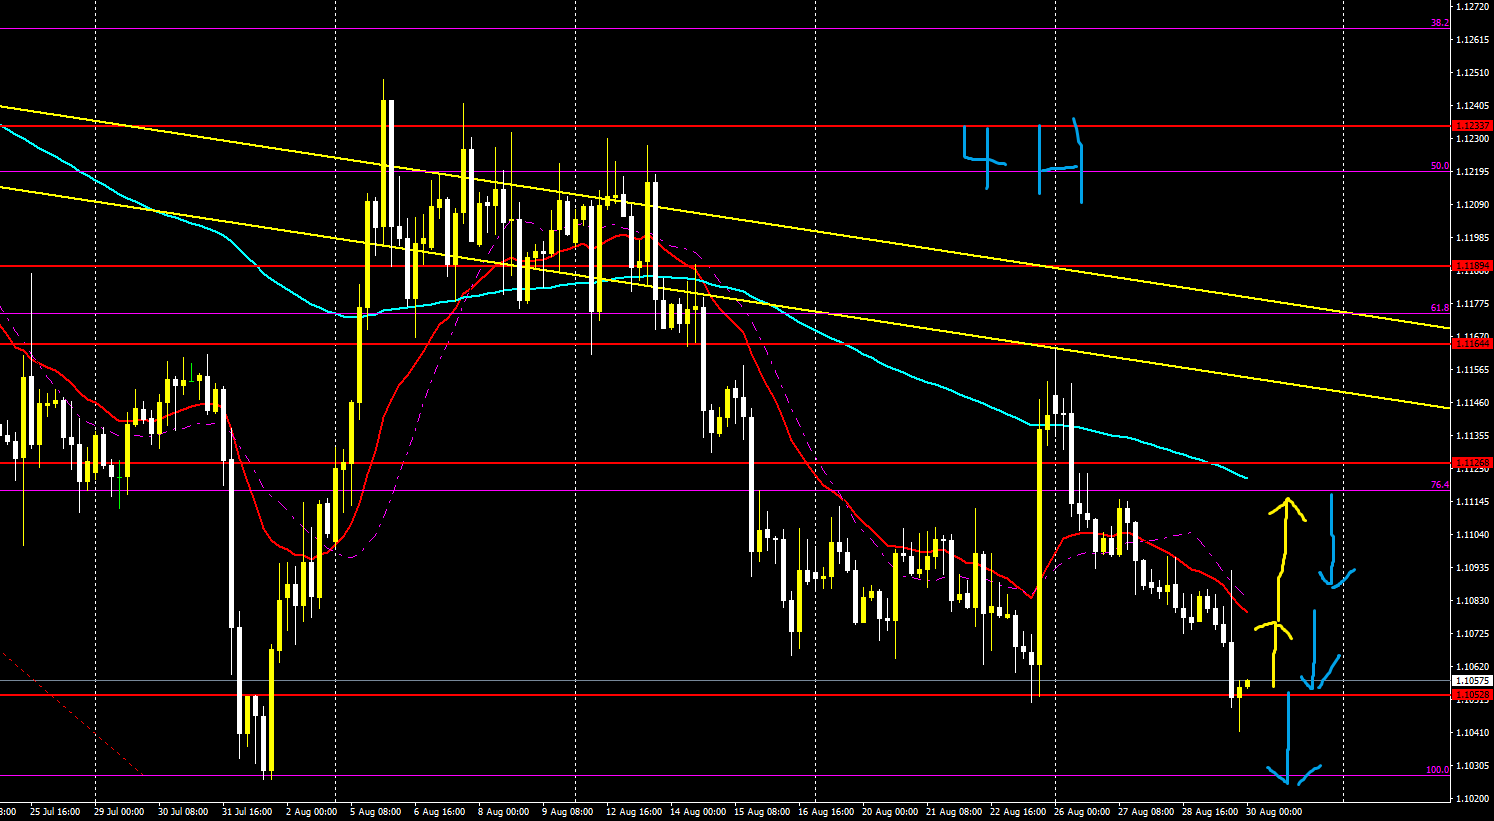
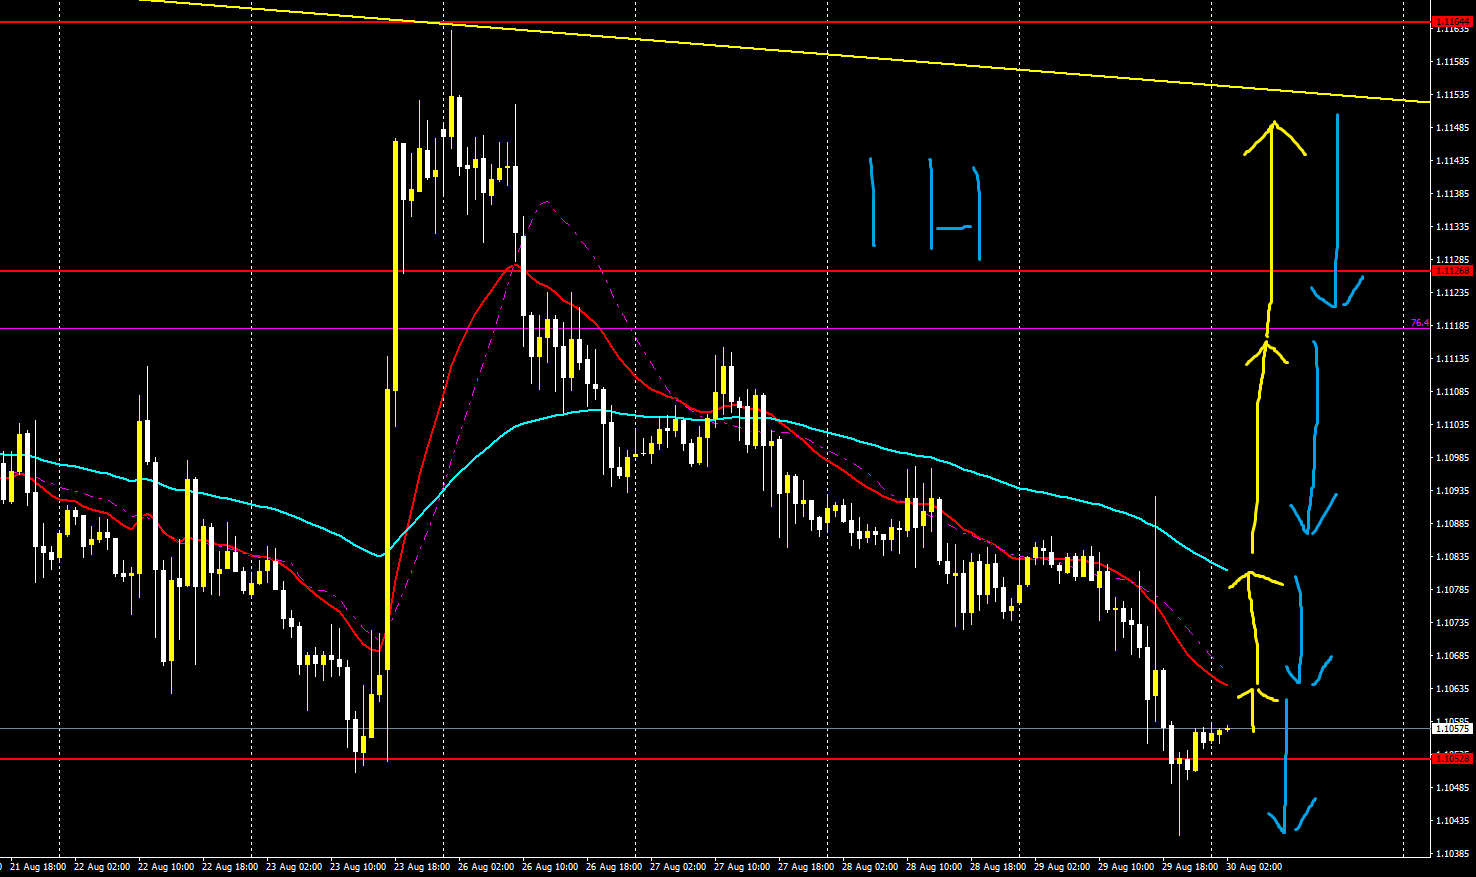
【EUR/USD】
Trading difficulty B–
Long-term down, short-term also down
There may be buying to push the retracement back up
If the 4-hour MA retraces, selling could come in
If buying momentum is strong, buying up to 76% Fibonacci or above could occur
4 hours
1 hour
EUR/JPY】
Trading difficulty B–
Long-term down, short-term also down
It could retrace to sell at any time
Be cautious of selling
Buy up to around Fibonacci 76
Construct buys or sells focusing on the short-term timeframe
4 hours
1 hour
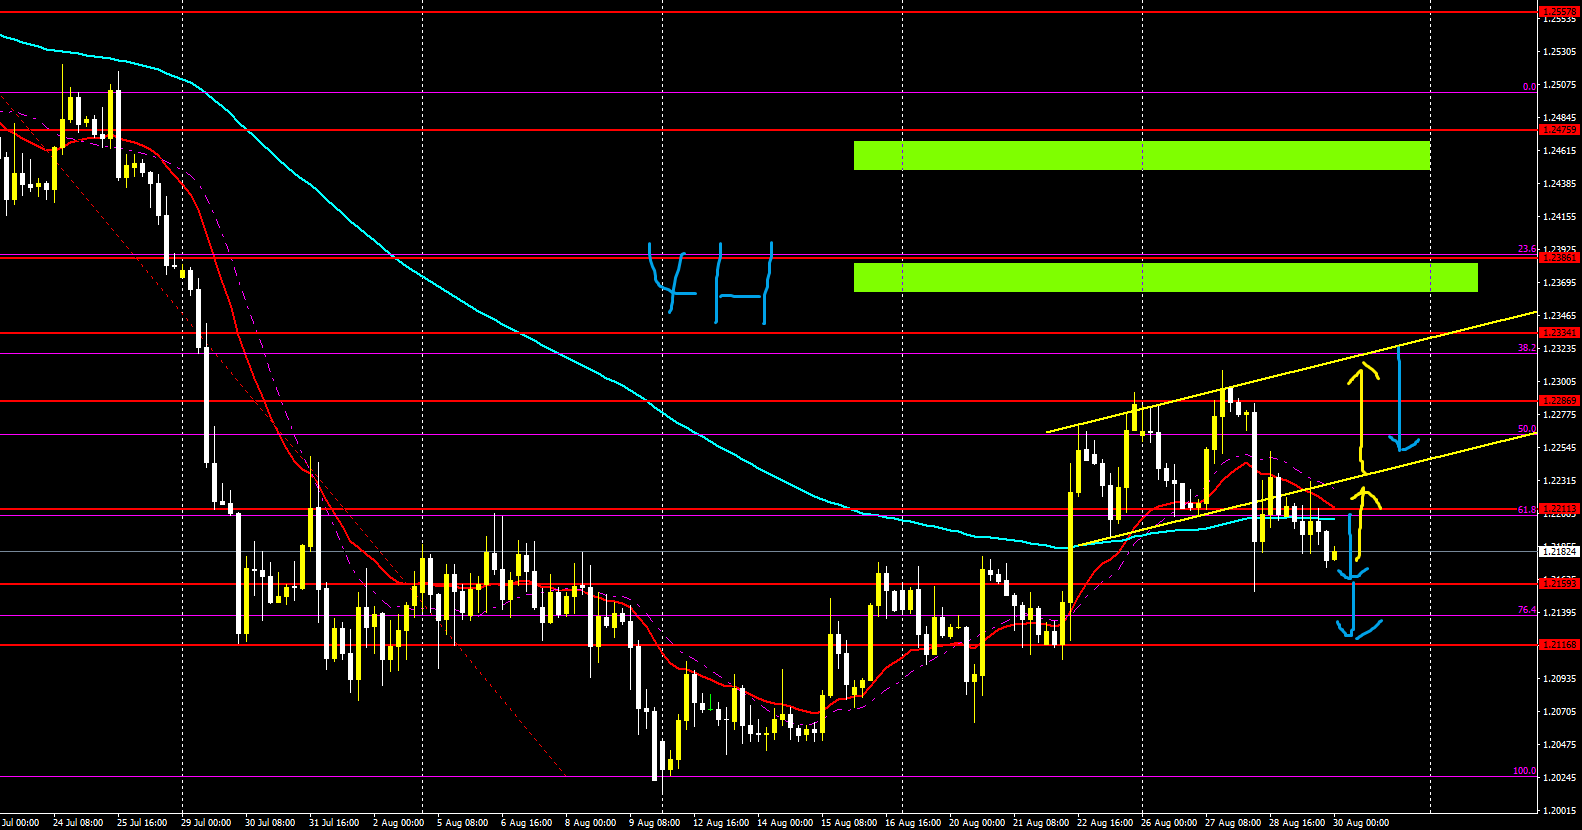
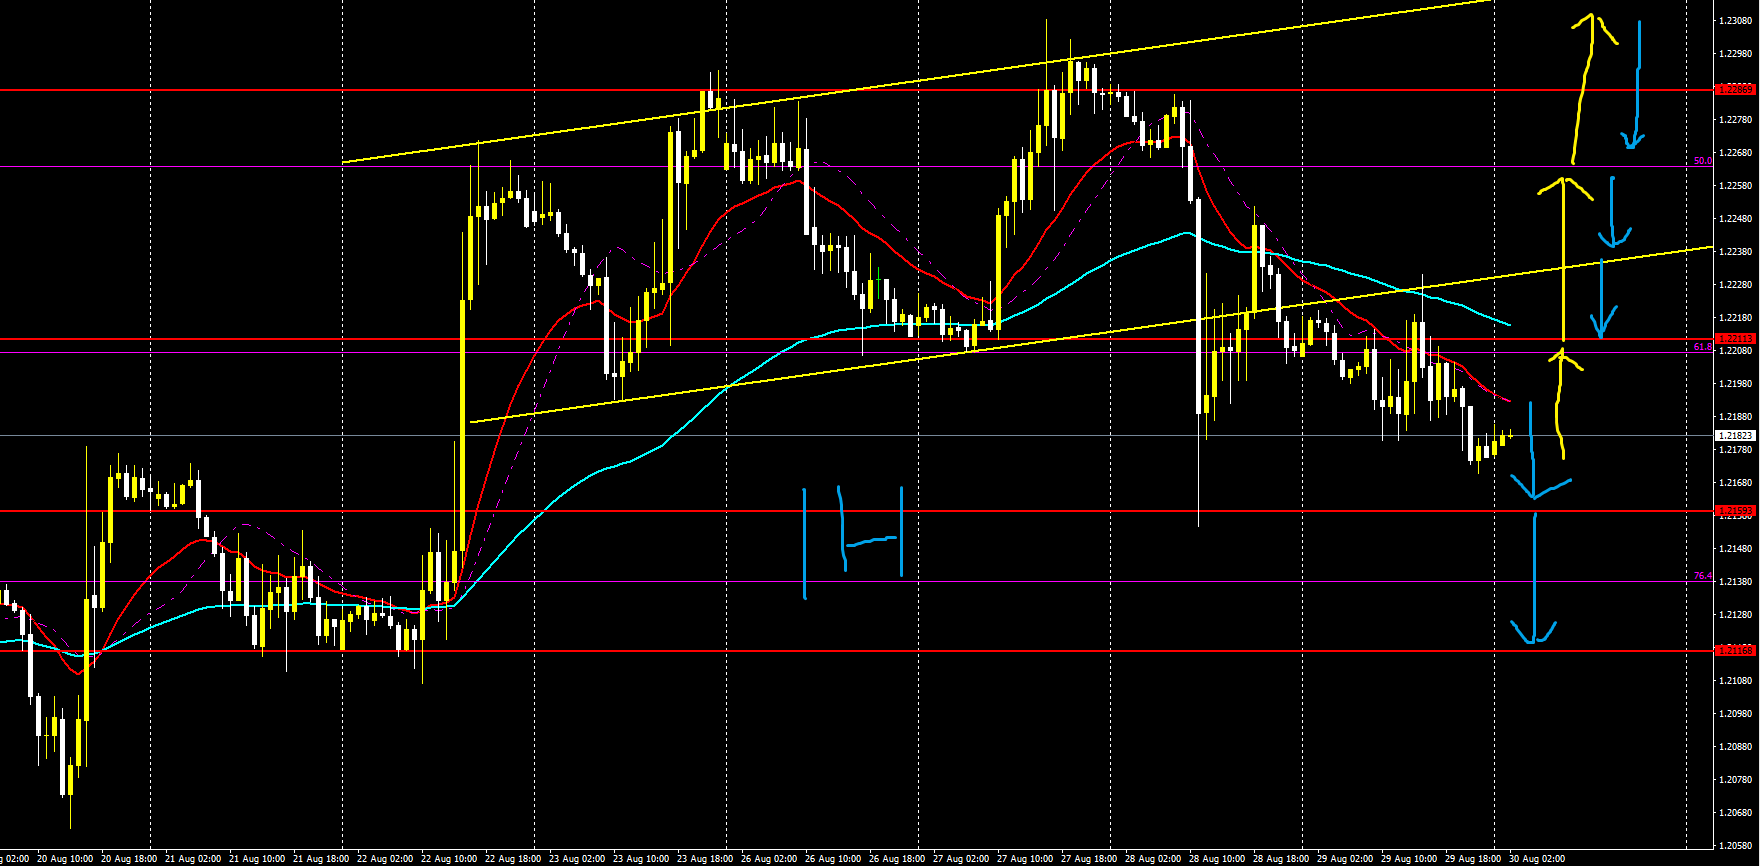
【GBP/USD】
Trading difficulty A–
Long-term down, short-term slightly down
Buying could come from the lower boundary of the channel and then a retracement sell may occur
In that case, attack with a retracement sell
If it stays within the channel, there may be buying up to the channel upper boundary, so look with a short-term timeframe
Look with a short-term timeframe and go long
4 hours
1 hour
【GBP/JPY】
Trading difficulty B–
Long-term down, short-term slightly up
A short-term flag is forming
Sell from the channel upper bound toward the lower bound
If it breaks above the channel, buy up to around Fibonacci 23
4 hours
1 hour
【Afterword】
The arrows in the images point to the favorable direction
Yellow indicates upward
Light blue indicates downward
Trading difficulty
The easier it is towards A
This only means there is an advantage in that direction, not that the price will reliably react or rebound at that level
However, since arrows are drawn near key levels, please use them as a reference for trading
Arrows may become take-profit or stop-loss points
And please treat lines and Fibonacci as references for take-profit, stop-loss, and entry points similarly
Weekly market forecasts and strategies are uploaded on YouTube, and they are generally accurate
What matters is how you apply them to trading and entries
When market strategy was correct or incorrect, methods and approaches to trading differ
And please consider entries as something separate


