

Learning how to create buy/sell plans from a currency broker | Episode 18: Incorporating the Three-wave Theory into USD/JPY market analysis (11) [Toshio Asano]
Toshiro Asano will teach you his trading methods and market-view-building know-how backed by his own experience and knowledge, leaving no stone unturned in this project. As before, he will continue to interpret the recent and future USD/JPY market and, based on that, present the most suitable buy/sell plan.
Note: This article is a reprint and revision of FX攻略.com’s October 2018 issue. Please be aware that the market information written in the text may differ from the current market.
Toshiro Asano Profile

Asano Toshirou. He has work experience at Toukyou Forex Co., Ltd., a foreign exchange trading intermediary of the Tokai Tanshin Group, and at EBS (now ICAP), which boasted over 80% market share in the foreign exchange trading world. He personally experienced historic markets such as the Plaza Accord of 1985, the subsequent era of extreme yen appreciation, the bubble burst, and the euro introduction in 2000, thereby developing his market perspective. He later founded two FX trading companies and also worked as a dealer for a private FX fund. He currently writes for the daily blog of the Investment School Group. He is also a popular advocate of easy-to-understand video works that leverage his strong video editing skills.
Maintain an Upward View While Being Mindful of Range-Bound Consolidation
As usual, let’s examine the market development from the previous issue up to now.
From the low M, the USD/JPY market showed a strong rise and, in the middle, formed a somewhat deeper pullback N–O, continuing to oscillate between its highs and lows until the previous issue. Afterwards, from the high at N, in week 8 the market broke above the consolidation and surged, reaching a high around 113.17 yen in week 9, after which the upside stalled, and it ended with a decline to levels where it had previously broken higher.
In this issue, the adjustment point was that the newly created high, which rose above high N, is now labeled P. The provisional high and low N and O may be eliminated in due course, but for now they remain important as the center of the uptrend since wave M and will stay significant for the time being (Chart 1).
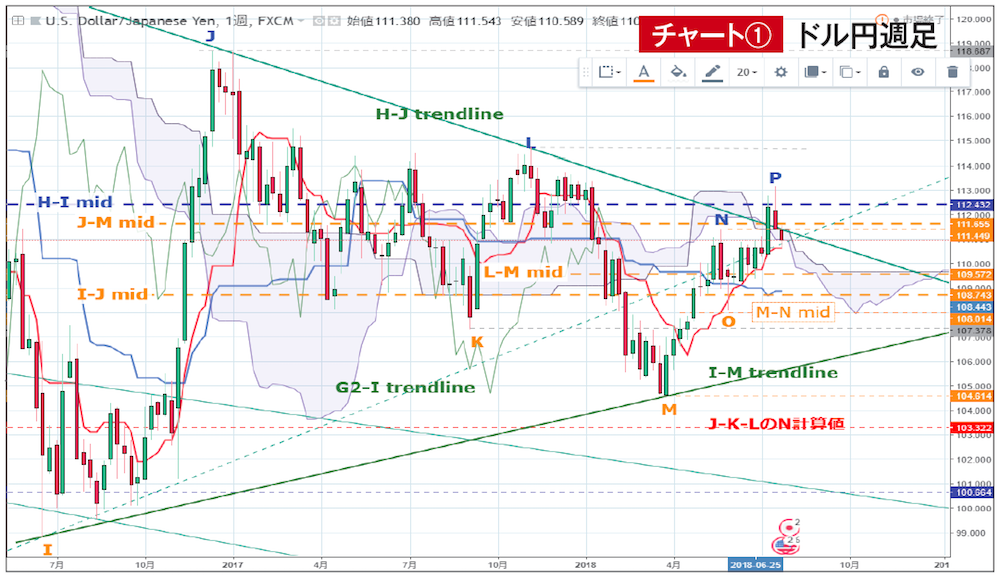
Chart 1 Source:USDJPY Chart by TradingView
As a weekly analysis of the current situation, the fluctuations leading up to the high P were generally as forecast. The level at H-Imid of 112.43 yen is only known once it is reached, but the fact that price could not sustain above that level on a body-line basis left a heavier impression than expected. That suggests that the sharp decline from H to I still has a strong influence. However, as noted in the previous issue, since the decline starting from H to I as the first wave is already unlikely, we should keep a cautious stance with an eye toward some consolidation while maintaining an upward bias.
The basis for this is that the lead span failed to act as support for both the lagging span and the current price, and also with the standard line, as the market significantly rose after a prolonged consolidation during the final week of a large drop, leaving only a small decline. Moreover, unless high P is surpassed again, the price cannot rise passively for another nine weeks. On the other hand, the reasoning for keeping an upward bias includes that the turning line could function as a pullback for the recent price and that the turning line can continue to rise passively.
From the low O, a near-term high could be formed by the ninth week, but it is disappointing that we saw a pullback breaking below the J-Mmid level of 111.65 yen and the high N of 111.43 yen, and ended the week with a bearish candlestick below N.
The next focus will be the turning line and price action next week. Specifically, next week the turning line will rise passively toward around 111.15 yen as the low target moves away from the low O. Since the near-term close is around 110.97 yen, if this continues, the turning line will move into a resistance position next week. Therefore, to maintain the uptrend, we must surpass the turning line again and see if we can sustain the level afterward. If recovery proceeds without issue, we could break above the important H–J trend line again, and since the high P is currently a false move, the latest price action may be interpreted as the false move that contradicts the recent action.


