

Future market outlook, strategy and opportunity currencies (from 8/23~)
Hello, this is OnePi Trade@onepipst)
From 8/23, I will forecast the market, develop strategies, and look for entry points
Horizontal lines and trendlines are drawn based on the daily chart
I also tweet about profits and other useful things, soplease follow Twitter
- USD/JPY (Dollar-Yen)
- EUR/USD (Euro-Dollar)
- EUR/JPY (Euro-Yen)
- GBP/USD (Pound-Dollar)
- GBP/JPY (Pound-Yen)
- Afterword
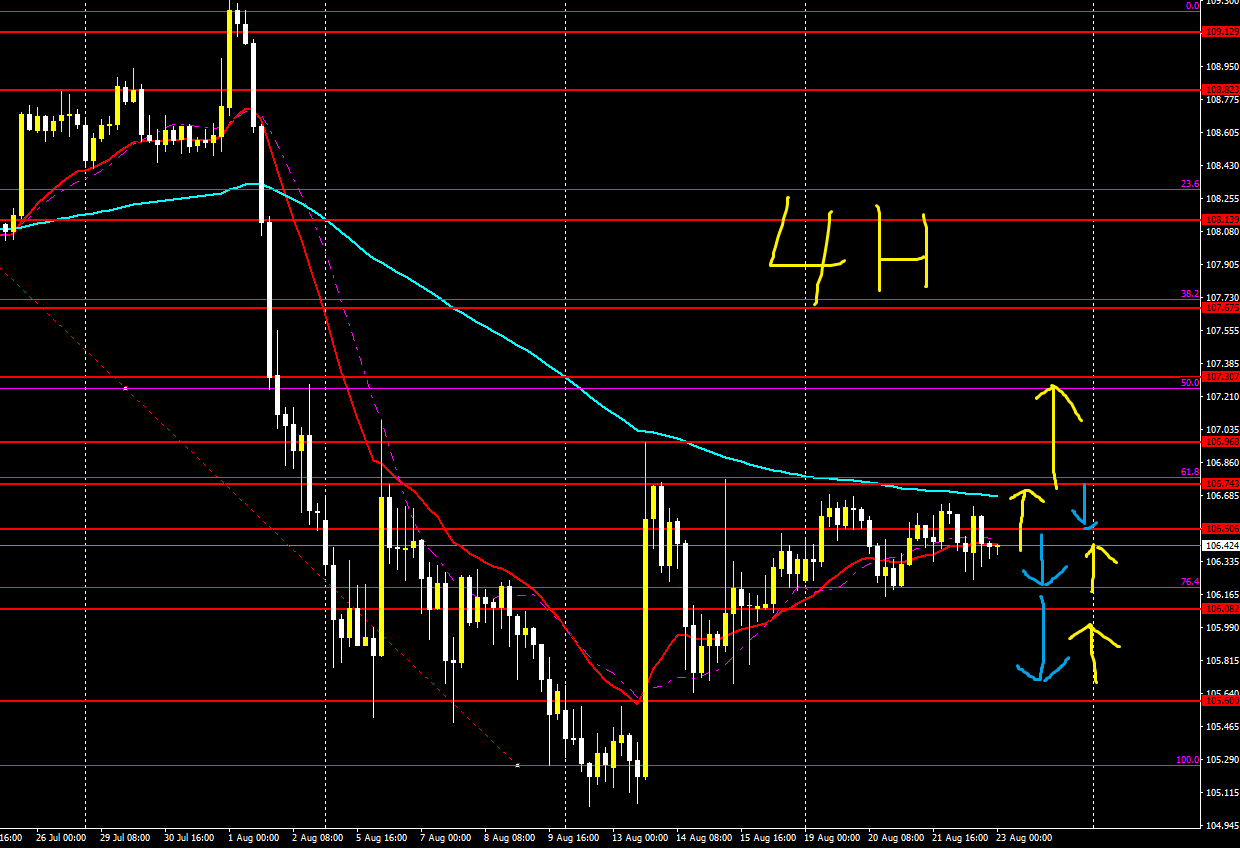
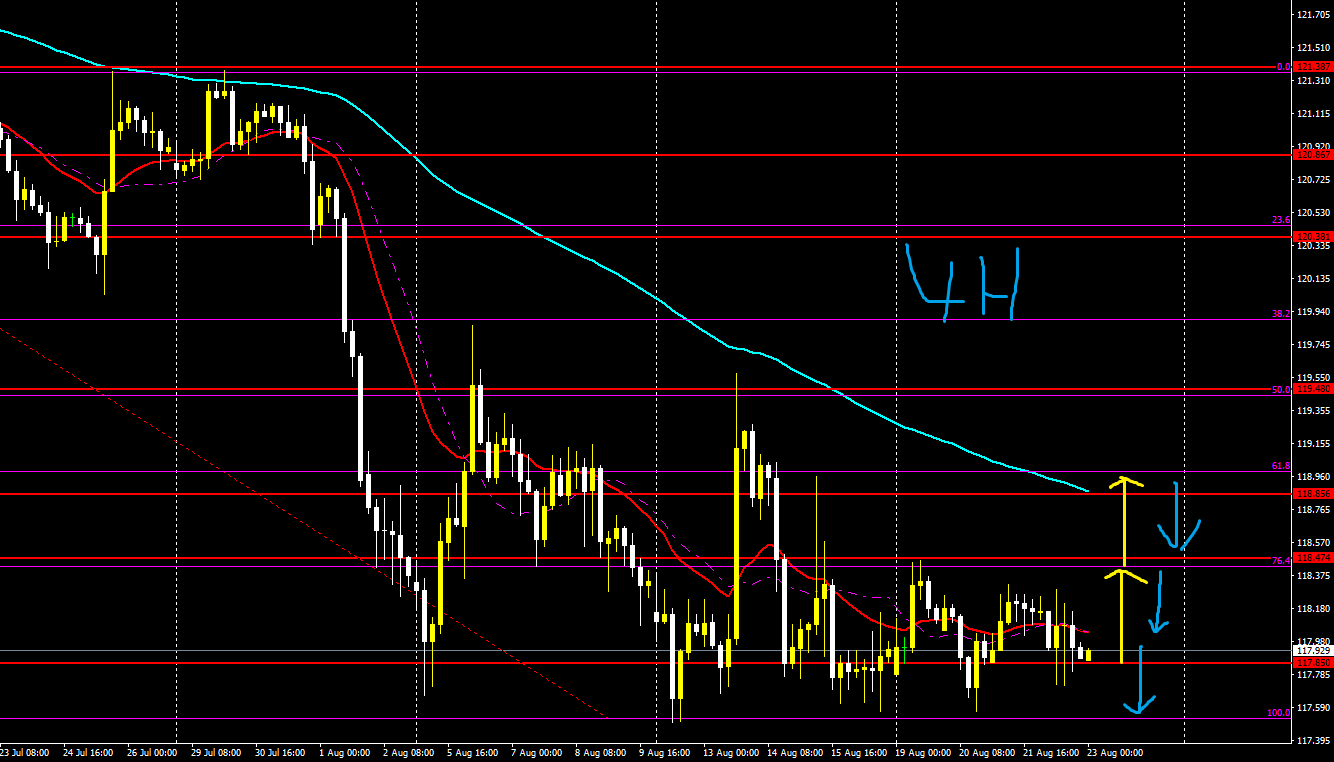
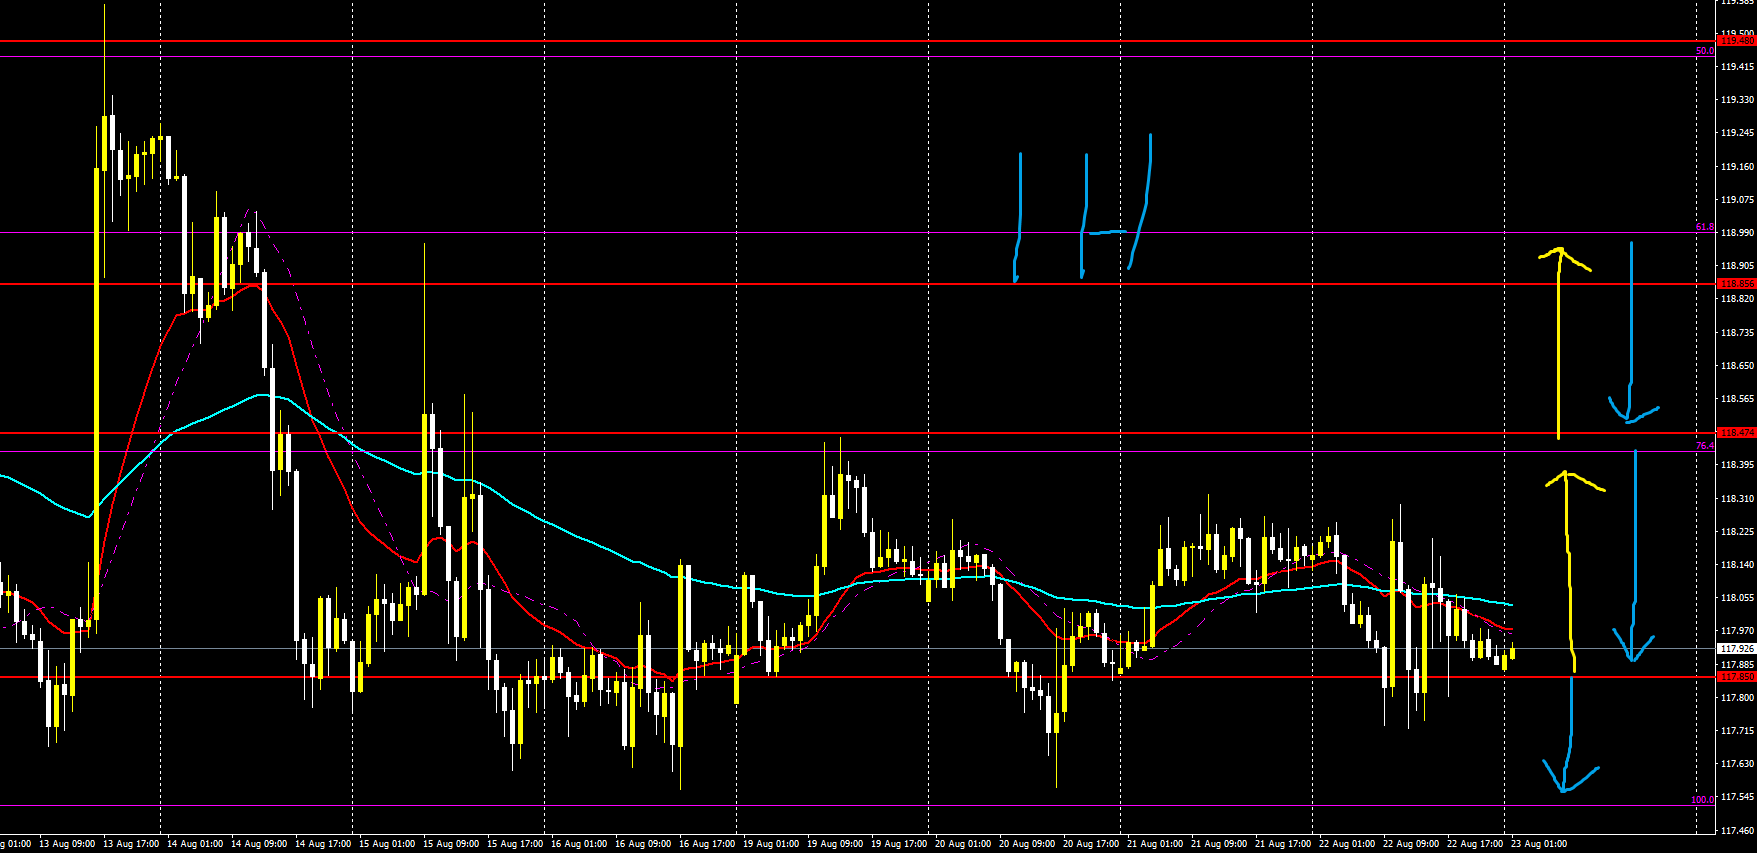
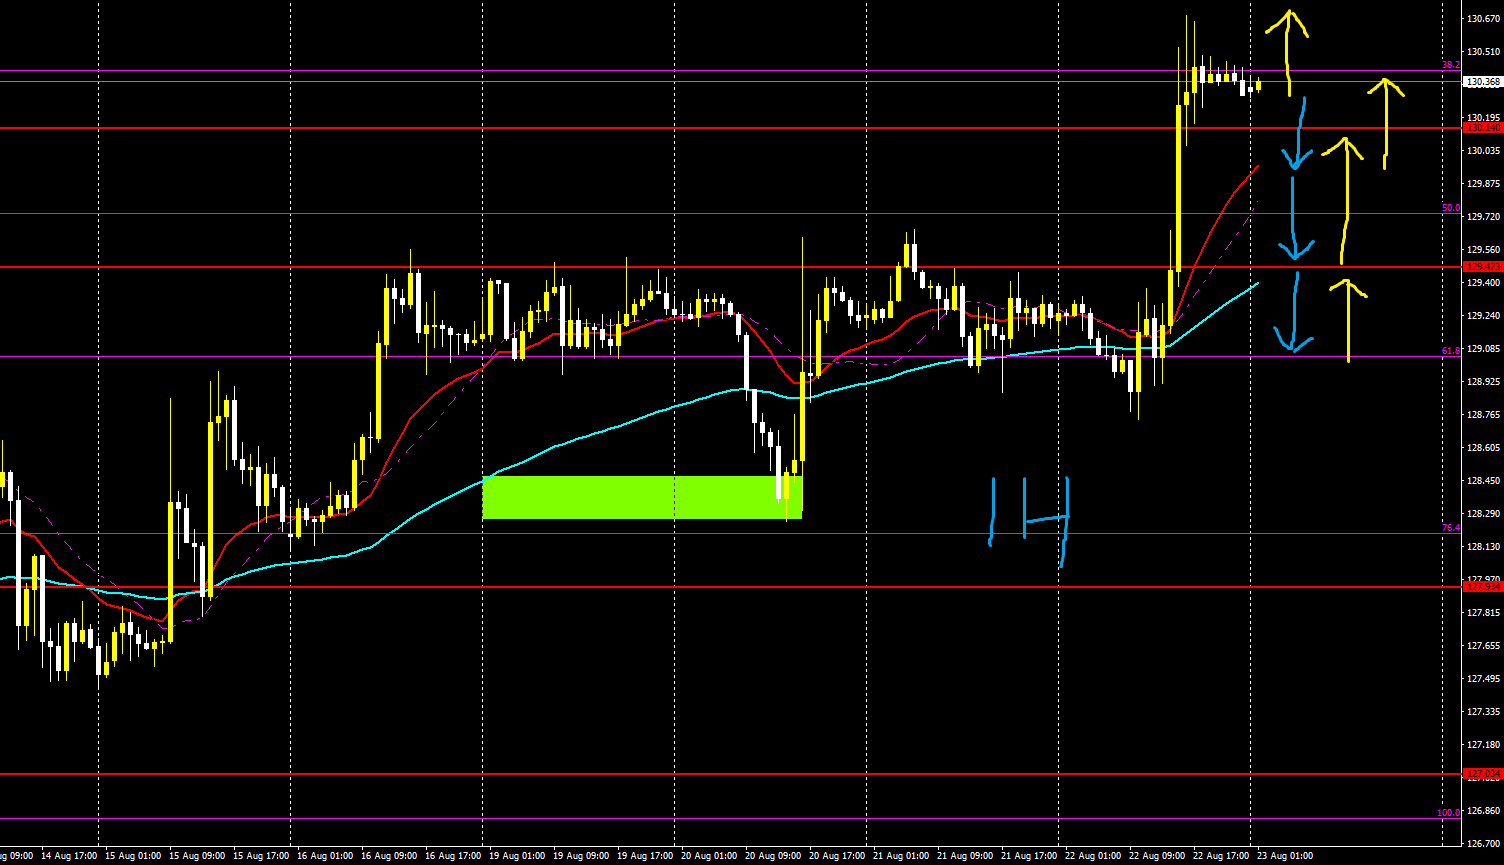
【USD/JPY】
Trading difficulty B−
Long-term outlook is down, short-term slightly up
Recently forming a range
If selling, safe up to Fibonacci 76
And up to near Fibonacci 61 or below
4 hours
1 hour
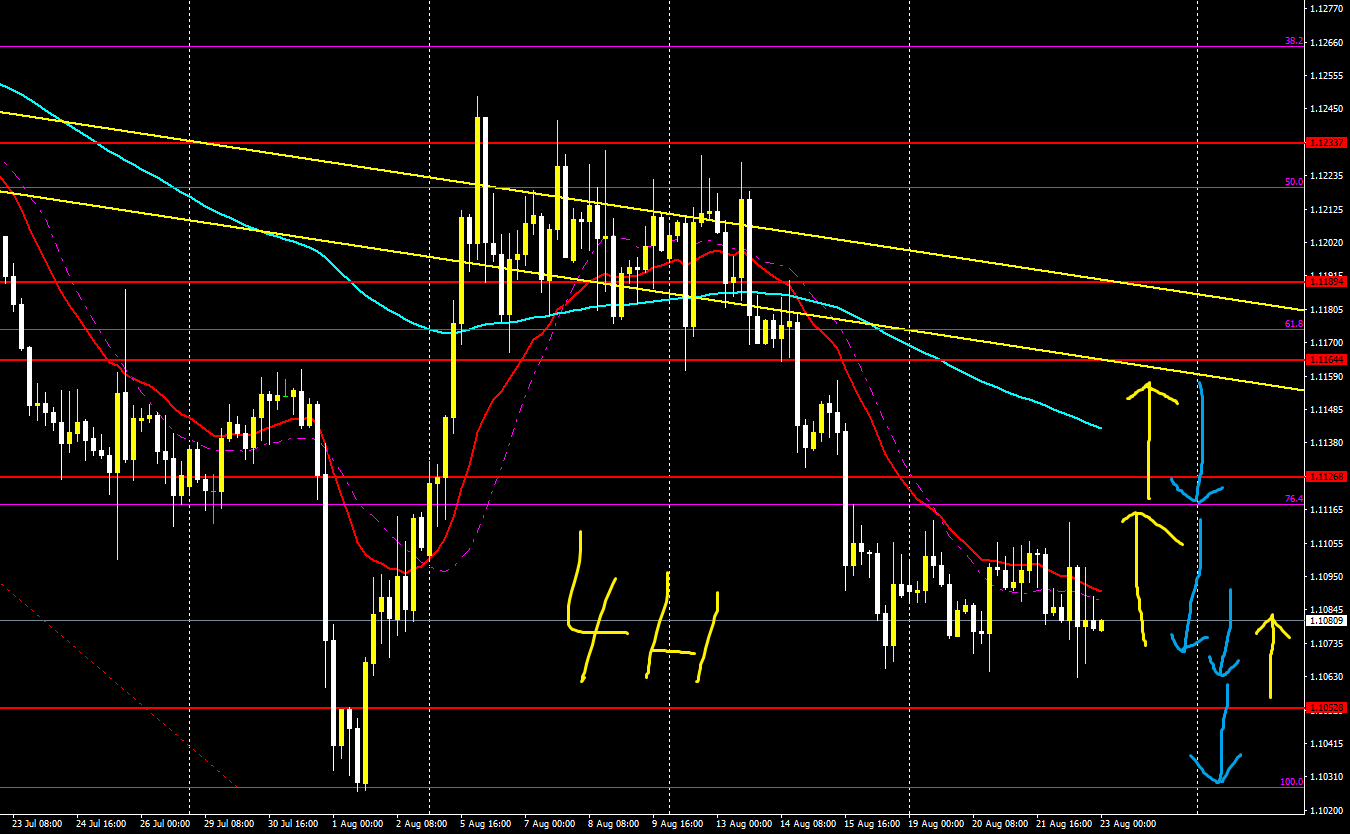
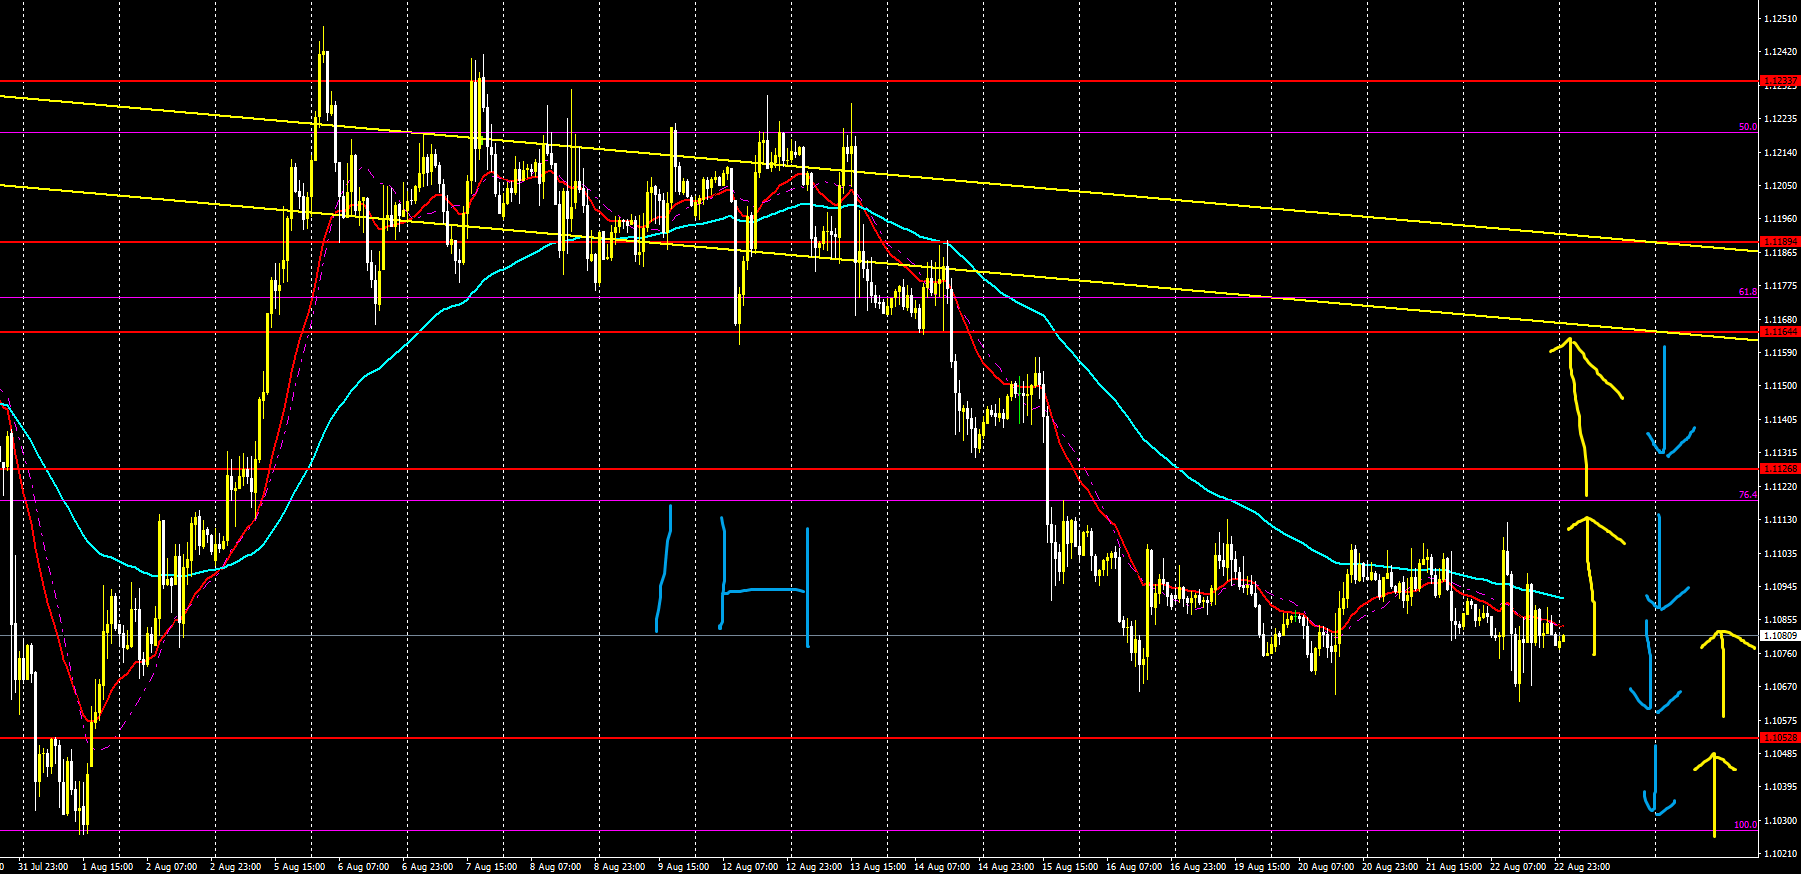
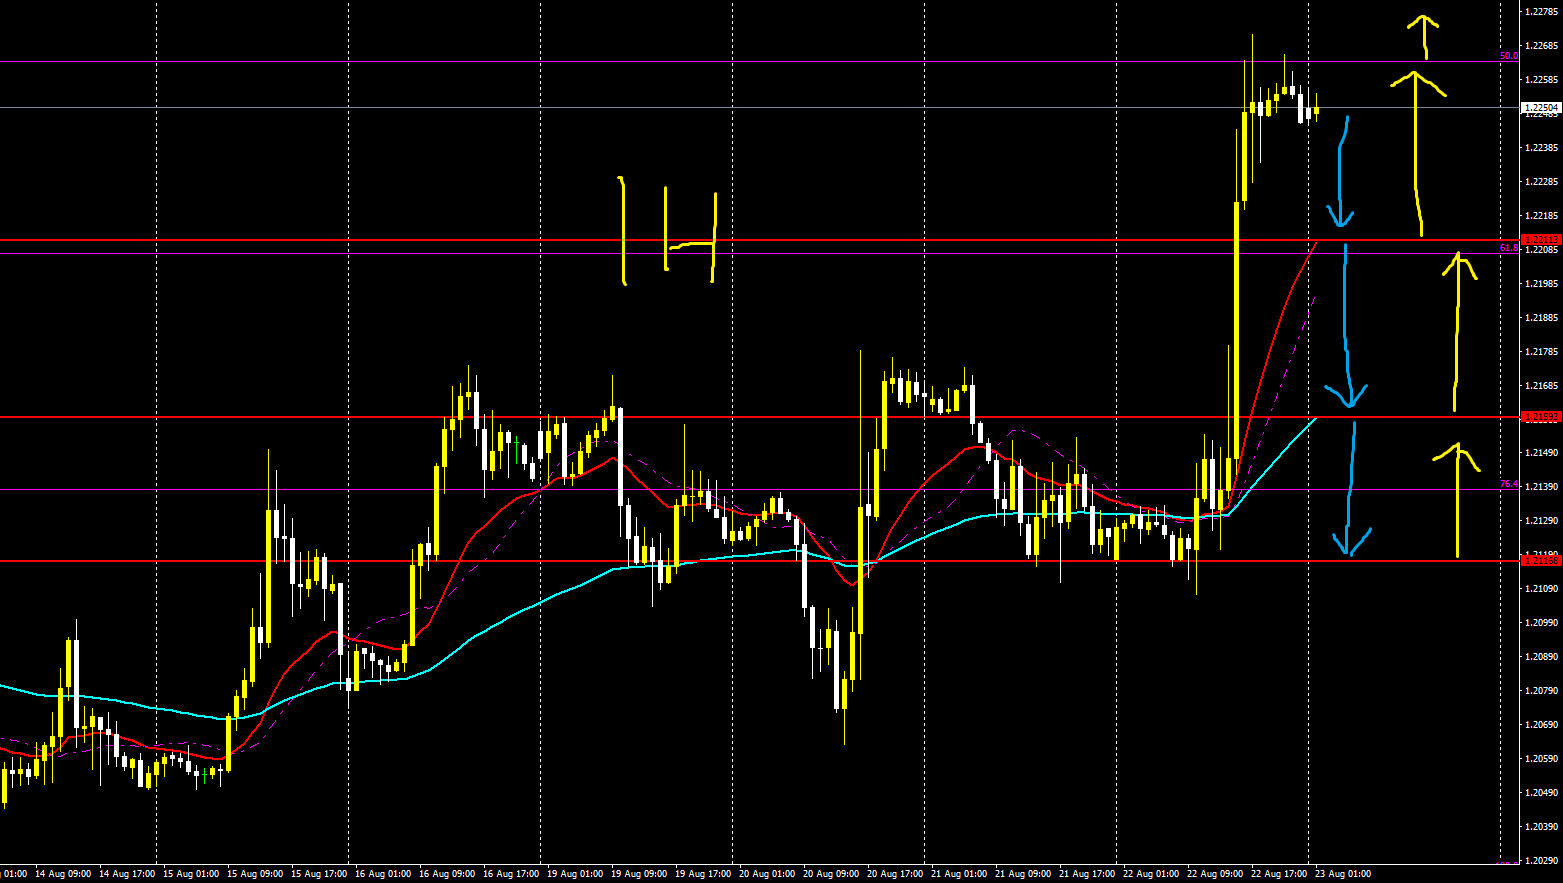
【EUR/USD】
Trading difficulty B−
Long-term outlook is down, short-term also down
Recently forming a range
Consider buying up to around Fibonacci 76 and selling from there
Follow whichever side breaks out of that range
4 hours
1 hour
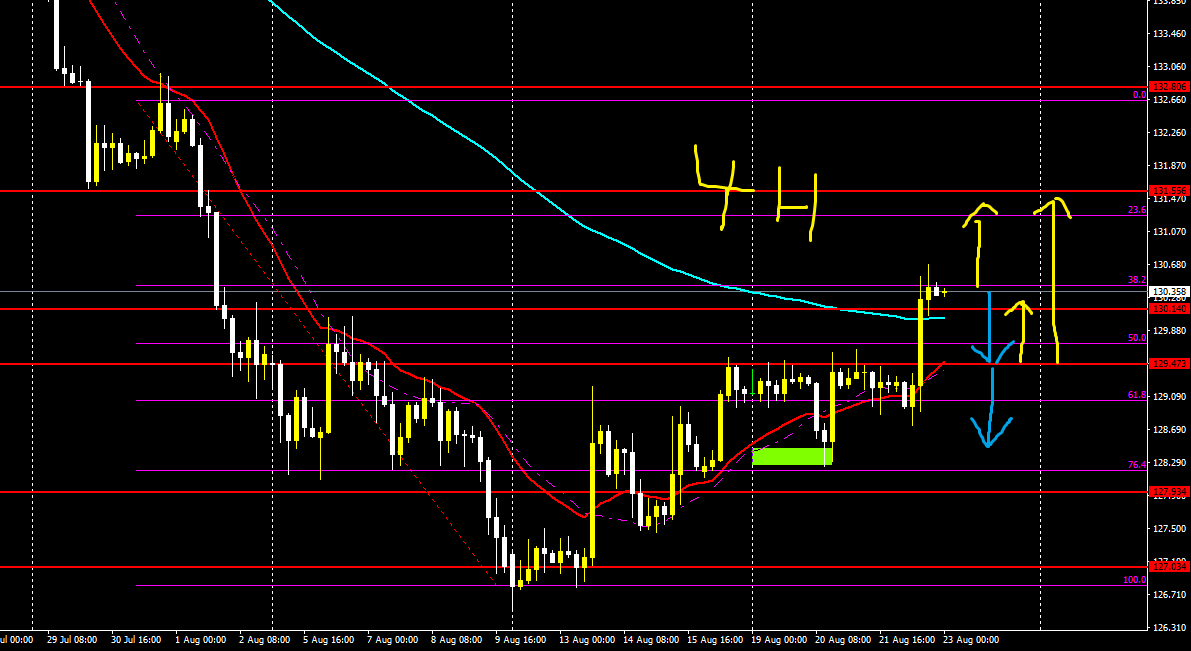
Euro-Yen (EUR/JPY)
Trading difficulty B−
Long-term outlook is down, short-term also down
Trading near a bottom
If produced by buying, likely a retracement to Fibonacci 76 or 61
Conversely, if selling pushes toward a new low, look to sell on the short-term chart
4 hours
1 hour
【GBP/USD】
Trading difficulty A−
Long-term down, short-term up
Even if the daily chart’s short-term moving average signals a possible pullback, there may be a retracement selling opportunity
Since it has reached Fibonacci 50, selling from there is plausible
However, if buying momentum is strong, it could keep rising
Or consider a short-term counter-trend sell in anticipation of a pullback
4 hours

1 hour
【GBP/JPY】
Trading difficulty A−
Long-term down, short-term up
Similar to GBP, there may be a pullback selling opportunity, but there is also room to rise
Briefly consider a short-term counter-trend sell to pull back
If buying momentum is strong, proceed with buying
4 hours
1 hour
【Afterword】
The arrows in the image indicate the favorable directions
Yellow indicates upward direction
Light blue indicates downward direction
Trading difficulty
The closer to A, the easier
But it only indicates relative advantage in that direction; it does not guarantee a reaction or rebound at that rate
However, the arrows point near key levels, so please use them as trading references
Arrows may become profit-taking or stop-loss points
And similarly, lines and Fibonacci levels can be used for profit-taking, stop-loss, or entry points
We release market forecasts and strategies every week on YouTube, and they are generally accurate
What matters is how you apply them to your trades and entries
When market strategies match or don't match, your trading approach and thinking will differ
And please consider entries as a separate matter


