

今後の相場予想、戦略・チャンス通貨(8/20~)
こんにちわワンピトレです(@onepipst)
8/20~の相場予想、戦略を立ててエントリーポントを探していきたいと思います
水平線のラインやトレンドラインは日足をベースに引いています
利益や他有益な事もツイートをしていますので、Twitterをフォローしてください
目次
- ドル円(USD/JPY)
- ユーロドル(EUR/USD)
- ユーロ円(EUR/JPY)
- ポンドドル(GBP/USD)
- ポンド円(GBP/JPY)
- あとがき
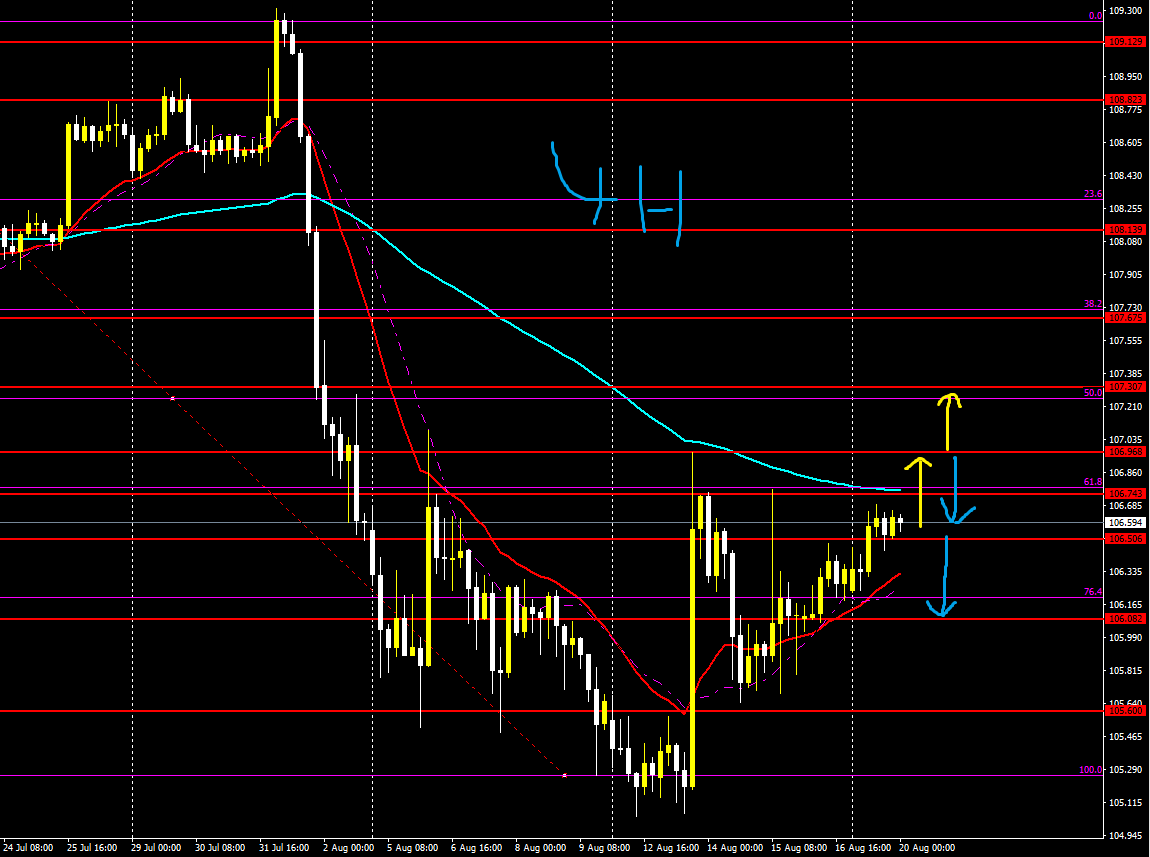
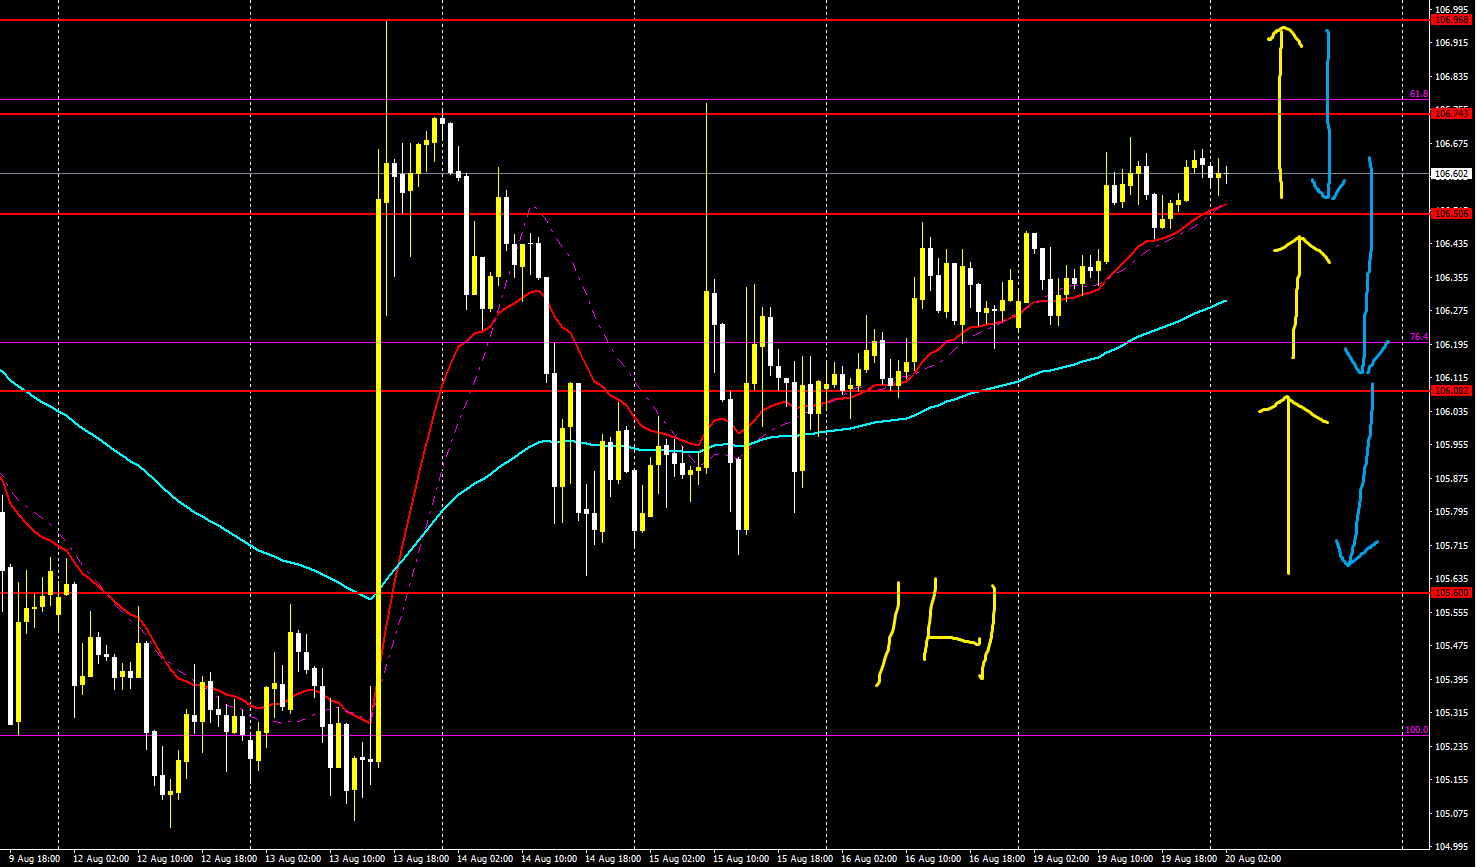
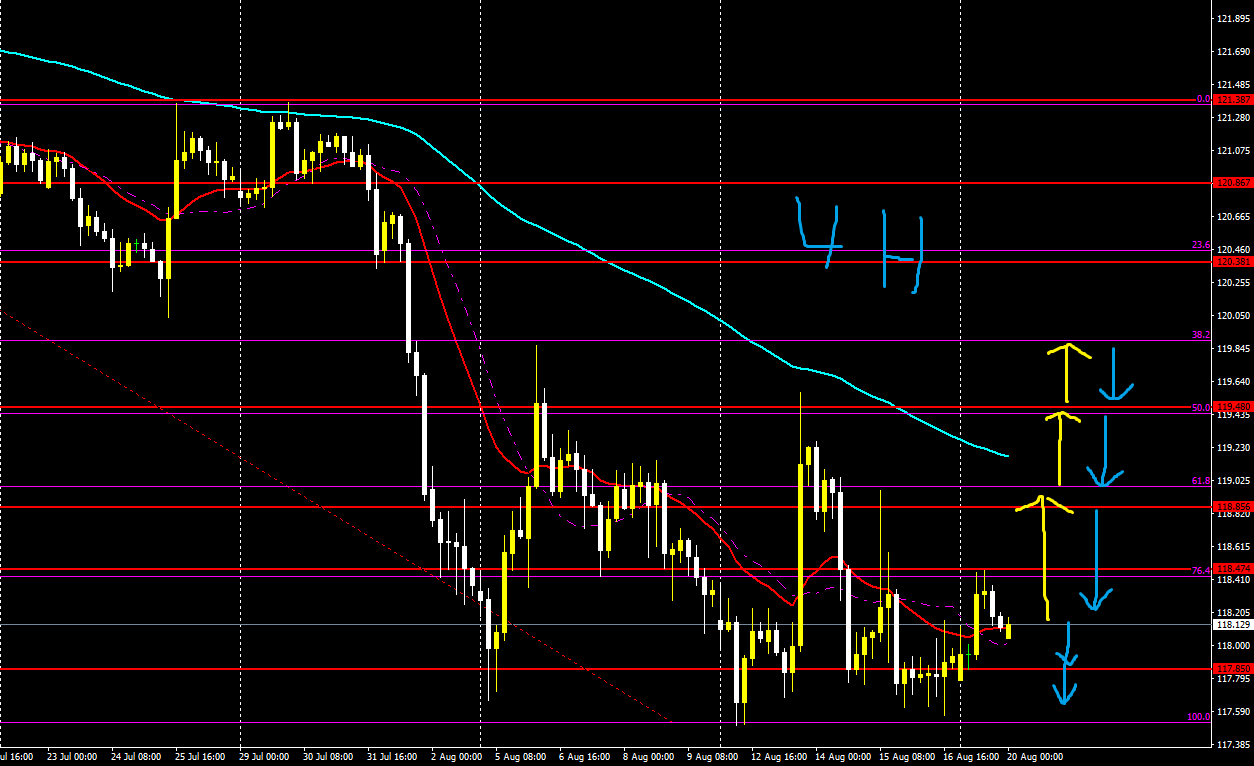
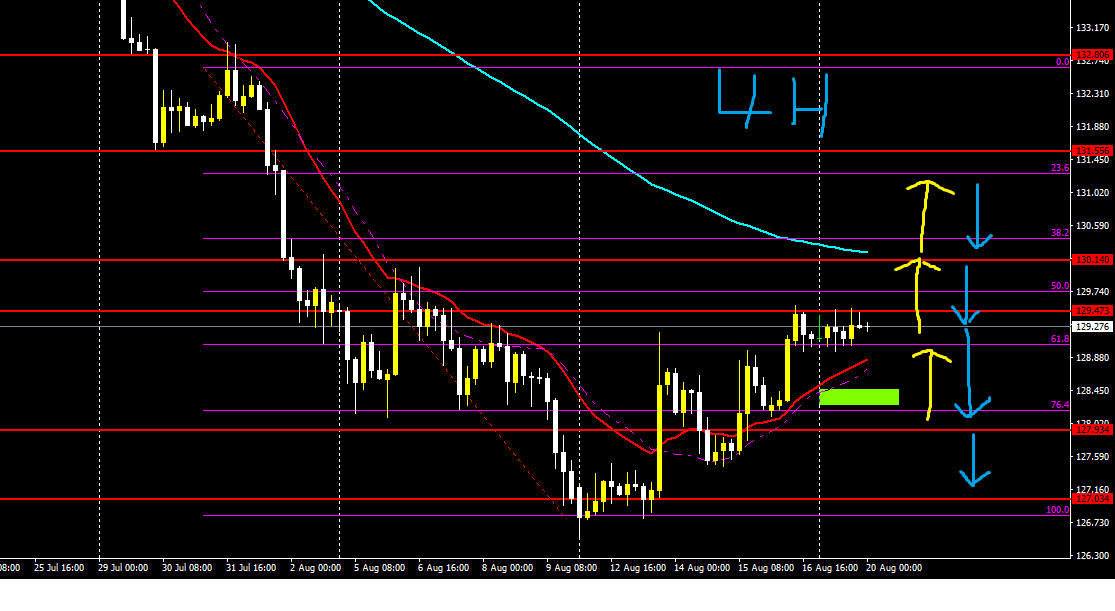
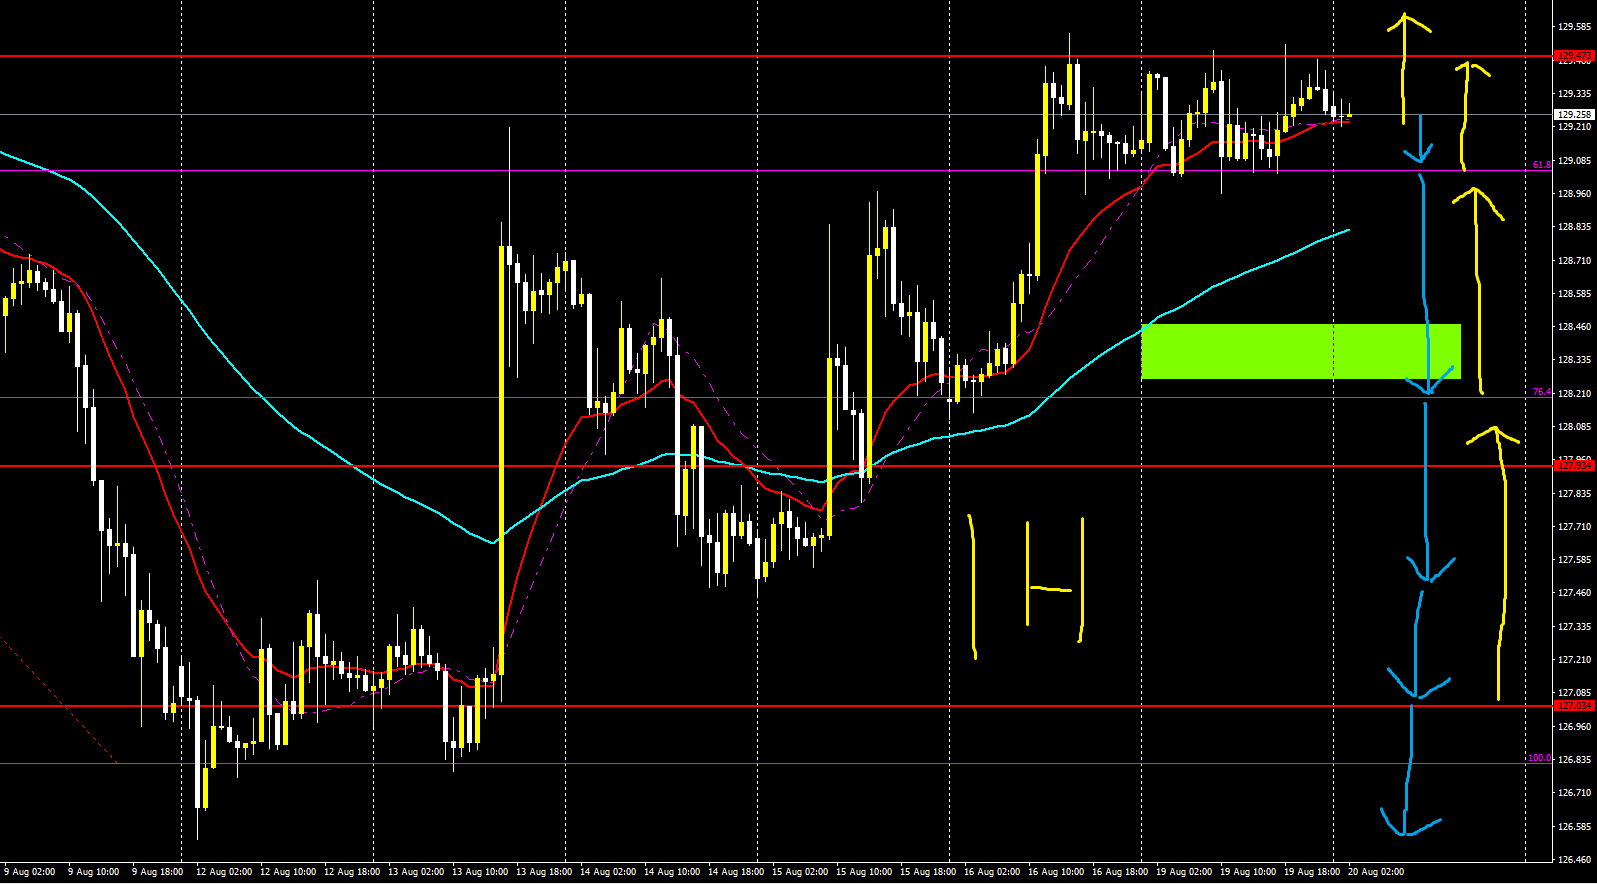
【ドル円(USDJPY)】
トレード難易度B-
長期目線は下、短期は上
4時間の短期MAの上に位置しているので買いで攻めてもいいかもしれない
しかしこれがたんなる戻しなら売りが入る可能性あり
日足にMAにグランビルが入り売りが入る事も考えよう
逆にそのまま売りが加速するのなら再び安値を試していく感じになる
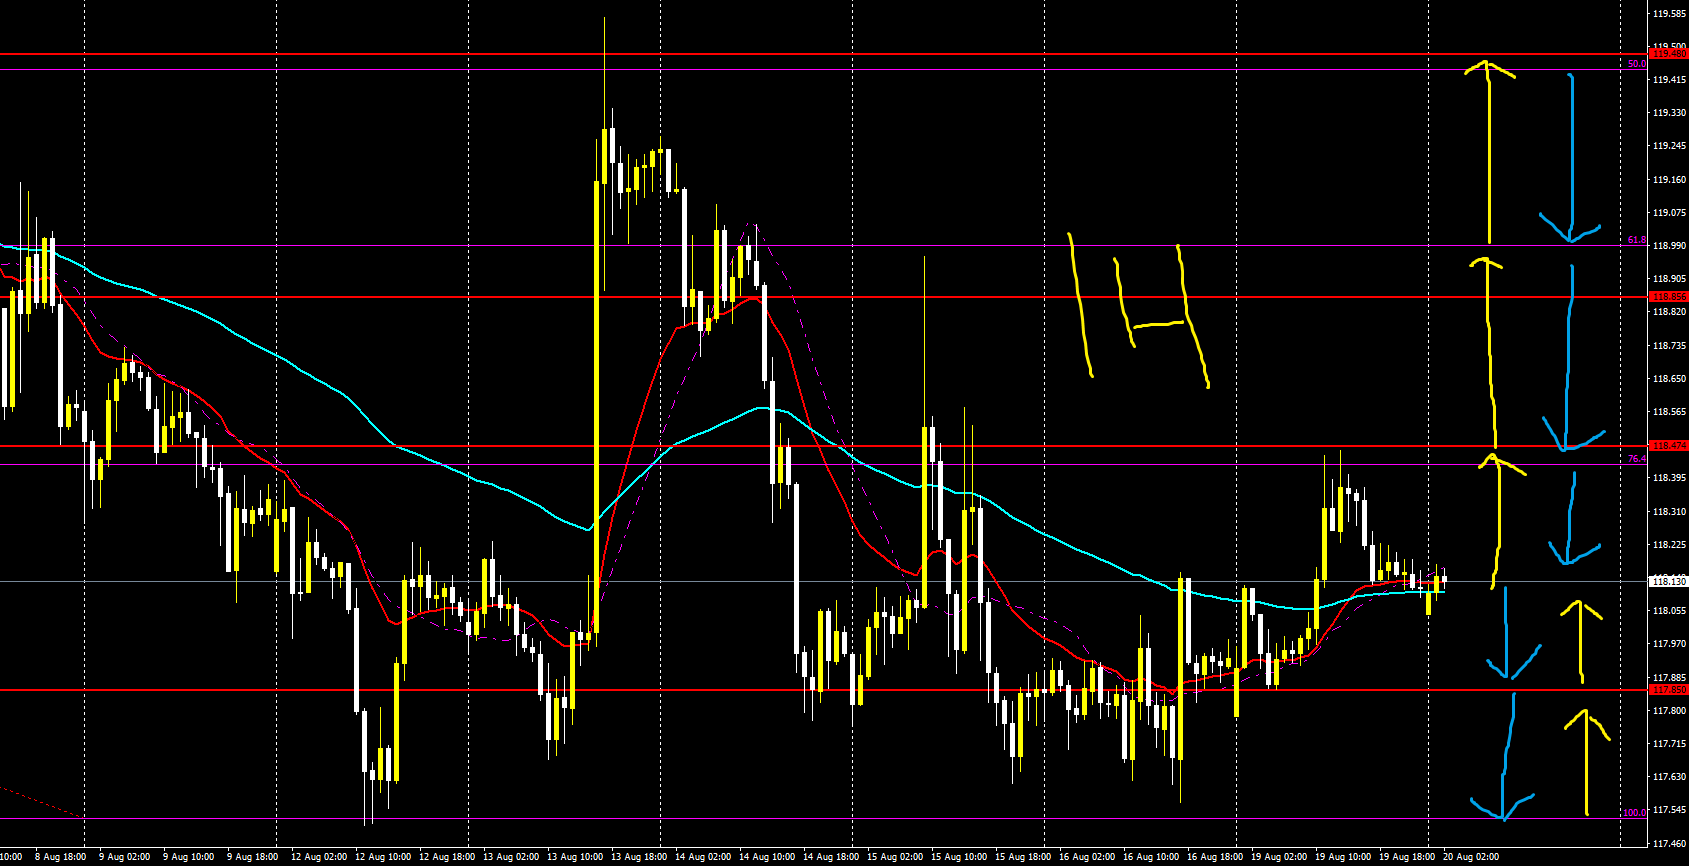
4時間
1時間
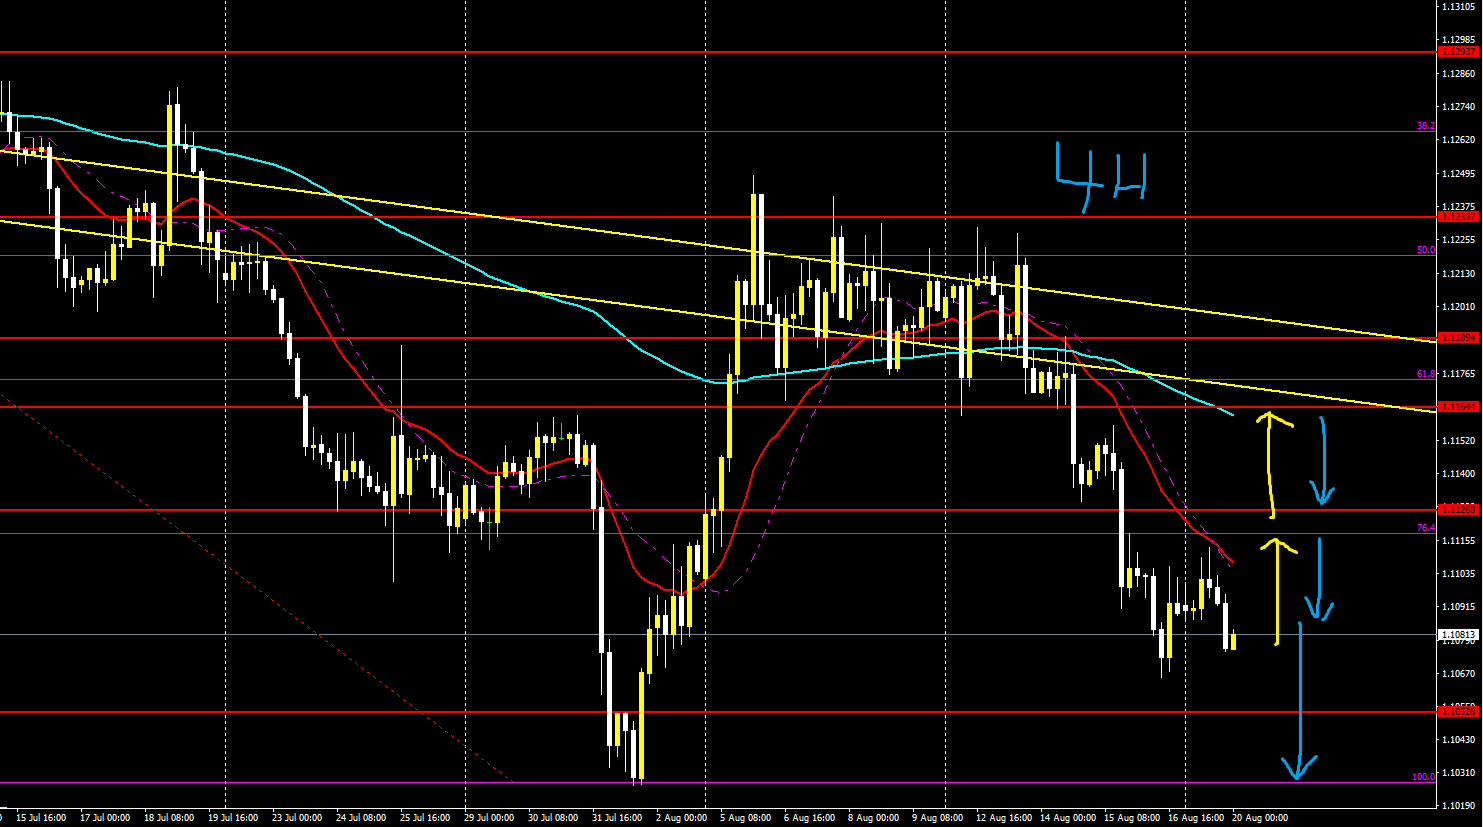
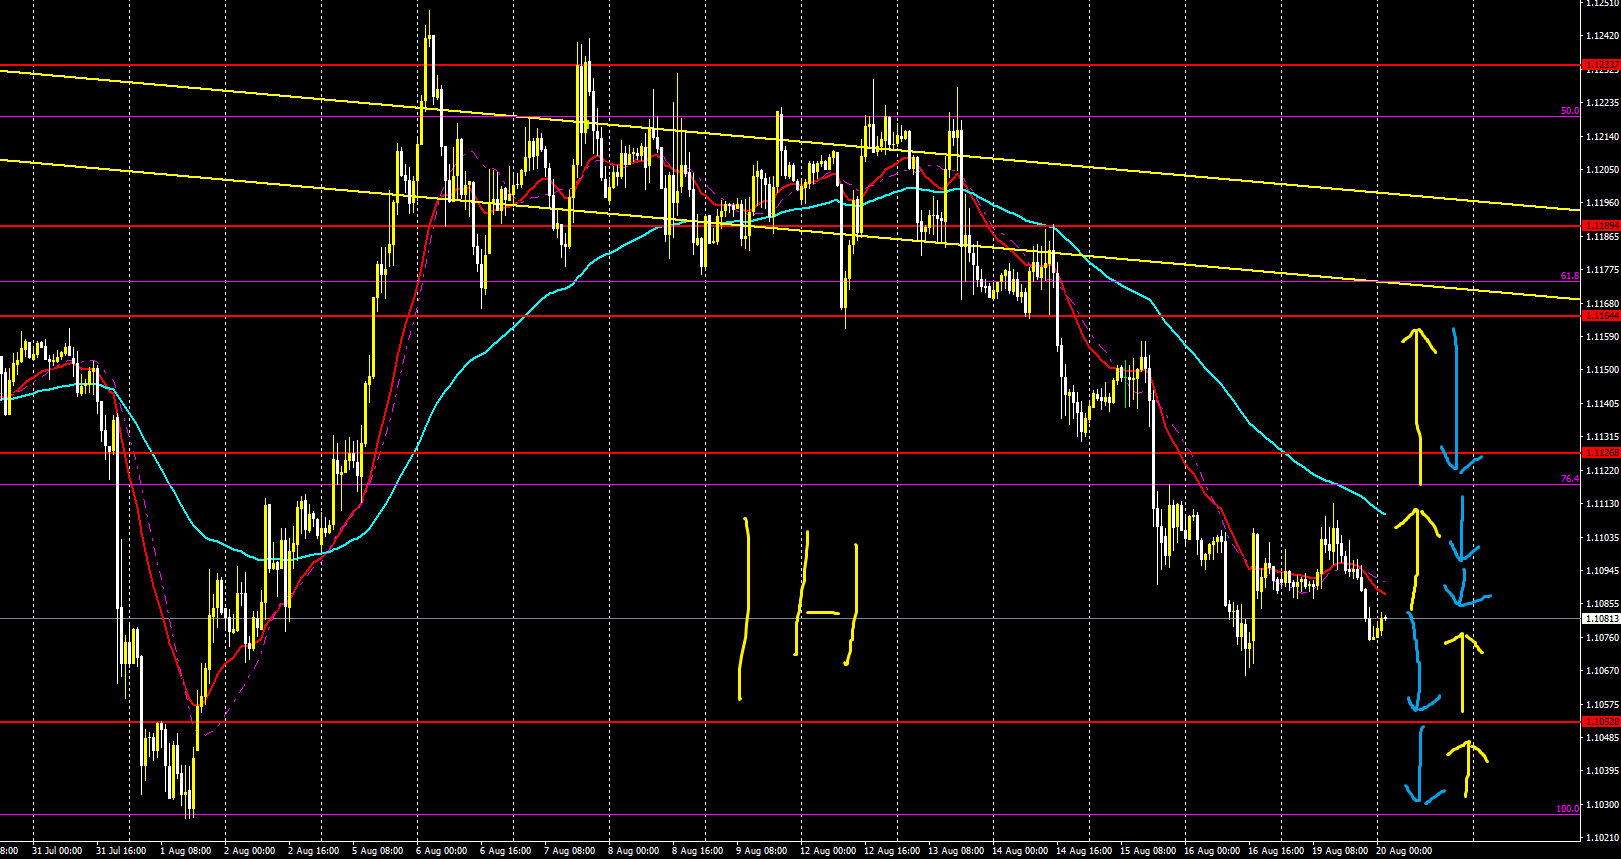
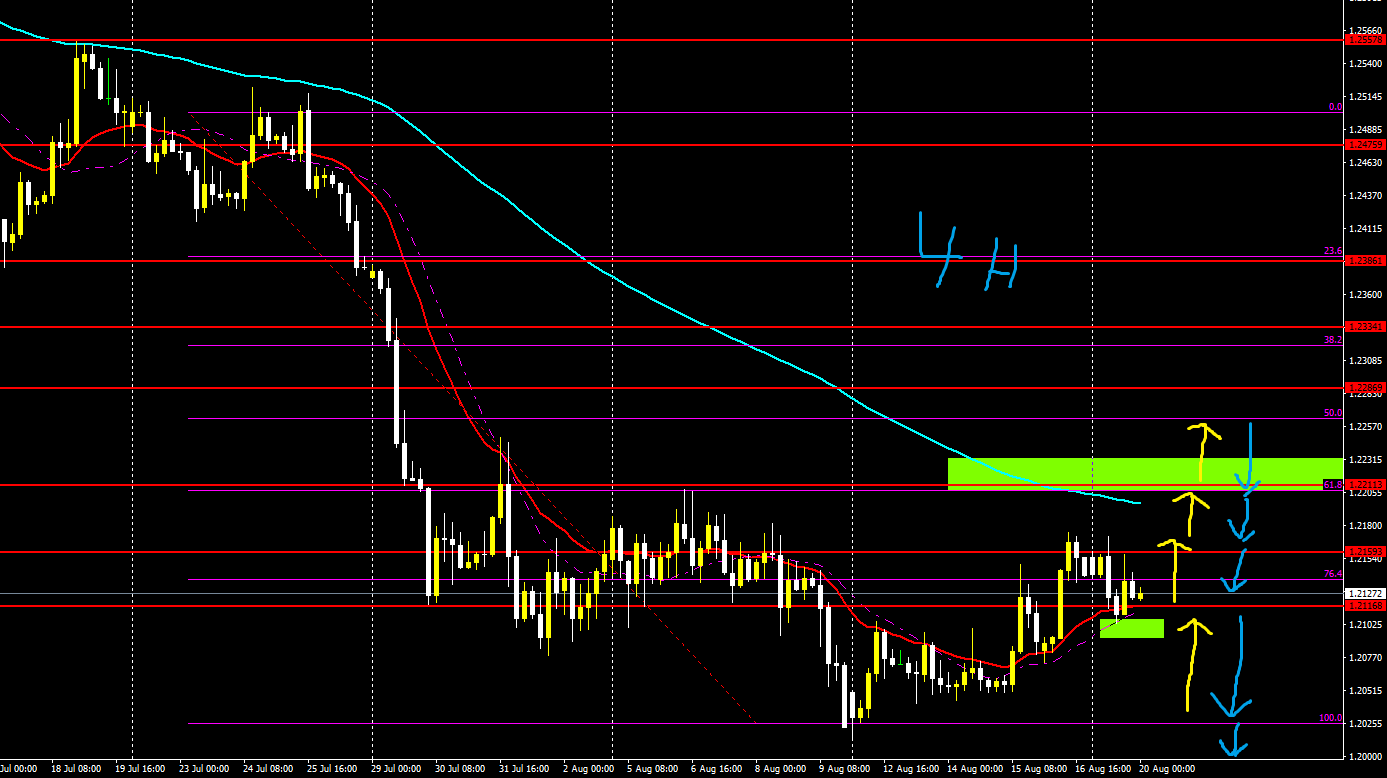
【ユーロドル(EURUSD)】
トレード難易度B-
長期目線は下、短期も下
一旦売りの勢いが弱くなった感じだがまだまだやすねまで伸びてくる感じもある
逆に戻しをつけに買われてくるならフィボの76や直近の戻り高値を見ておこう
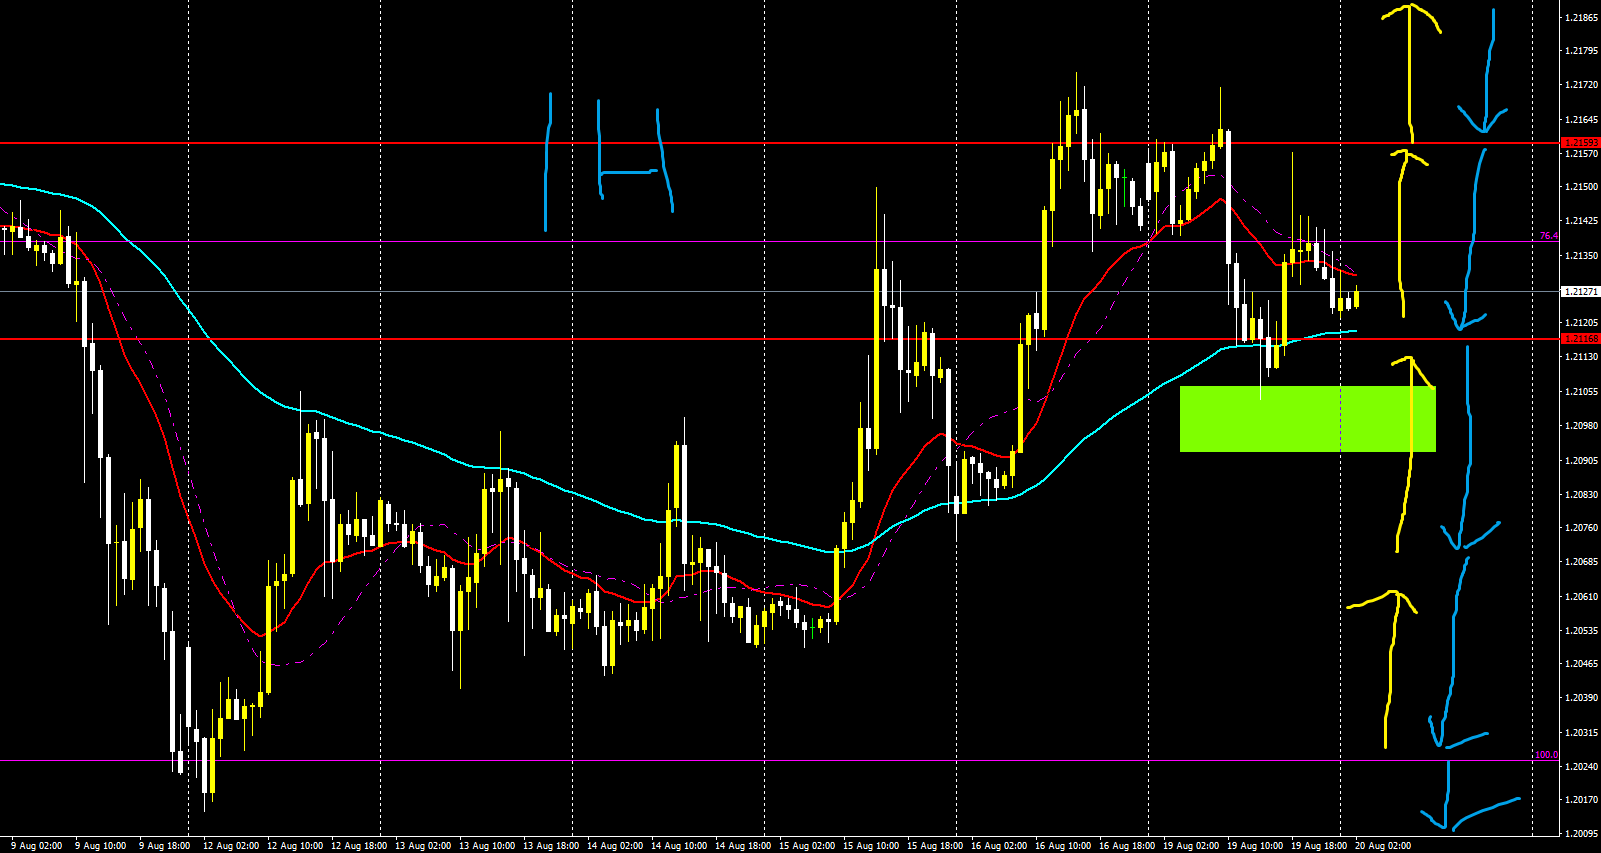
4時間
1時間
ユーロ円(EURJPY)】
トレード難易度A-
長期目線は下、短期も下
底値圏で推移している
買われてくるならフィボの76や61までの戻しが入る可能性が高い
逆に売りが入り安値を目指していく動きなら短期足を見て売っていこう
4時間
1時間
【ポンドドル(GBP/USD)】
トレード難易度B-
長期目線は下、短期はやや上
日足の短期MAにグランビルが入りそうでもしかしたら戻り売りが入る可能性がある
しかし買いの勢いが強ければそのまま買われていくだろう
とりあえず買いはフィボの61の下まで
売りが入ってくるなら直近安値まで指していこう
4時間
1時間
【ポンド円(GBPJPY)】
トレード難易度B-
長期目線は下、短期はやや上
ポンドル同様戻り売りが入ってきそうな場面
買いはフィボの50の上のラインまで
売りが入ってきてフィボ61を下に割ってきて短期でトレンドをつけたら直近安値まで売っても良いかもしれない
4時間
1時間
【あとがき】
画像に書いてある矢印はその優位的な方向を指してます
黄色は上方向
水色は下方向
トレード難易度
Aに向かうほど簡単
あくまでもその方向に優位性があるだけで、そのレートで確実に反応、反発するわけではありません
しかしその付近の節目あたりに矢印を引っ張ているので是非トレードの参考にしてください
矢印が利確ポイント、損切ポイントになるかもしれません
そしてラインやフィボナッチも同様に利確や損切、エントリーポントの参考にしてください
毎週YouTubeで配信している相場予想、戦略が毎回大体合っています
大事なのはそれをトレードやエントリーにどう生かすかです
相場戦略があっていた時、違っていた時、トレードのやり方や考えかは違ってきます
そしてまたエントリーは別物と考えて下さい


