

Learn from a currency broker on how to create buy/sell plans | 30th installment: Incorporating the Three-Wave Theory into USD/JPY market analysis (23) [Toru Asano]

This企画 features a book that thoroughly teaches trading methods and market-view-building know-how backed by Mr. Toshio Asano's own experience and knowledge. As with previous issues, we will again interpret the recent and future USD/JPY market, and based on that, present the optimal trading plan.
※This article is a reprint and editorial revision of FX攻略.com October 2019 issue. Please note that the market information in the text may differ from the current market.
Toshio Asano Profile

Toshio Asano. A former employee of Tokyo Financial Exchange’s foreign exchange brokerage, associated with Tokyo Forex株式会社, and also with EBS (now ICAP), which boasted over 80% world share in currency trading. He experienced historical markets first-hand, including the Plaza Accord in 1985, the subsequent ultra-strong yen era, the bubble burst, and the Euro introduction in 2000, honing his market sense. Later, he founded two FX trading companies and worked as a private FX fund dealer. Currently, he writes for the daily blog of the Investment School Group. He is also a strong supporter of easy-to-understand video works that utilize his skill in video editing.
Cannot expect a rise with strong downside risk
Since the August 2nd week had the upcoming Federal Reserve Open Market Committee (FOMC) announcement in late July, we reanalyzed in the second week of August. First, here are the chart revisions for this month. The weekly chart as of last month showed a rebound from the low point Q, but the high reached during the FOMC week has become the near-term high, so we mark it as R. Also, the large congestion having the bottom at H−I is now widely recognized as a triangle consolidation; with the low at O, the lower edge has been revised downward and the most recent leg has already reached it, so we add I−O as a trendline just in case. Now, let’s quickly look at the weekly chart (Chart ①).
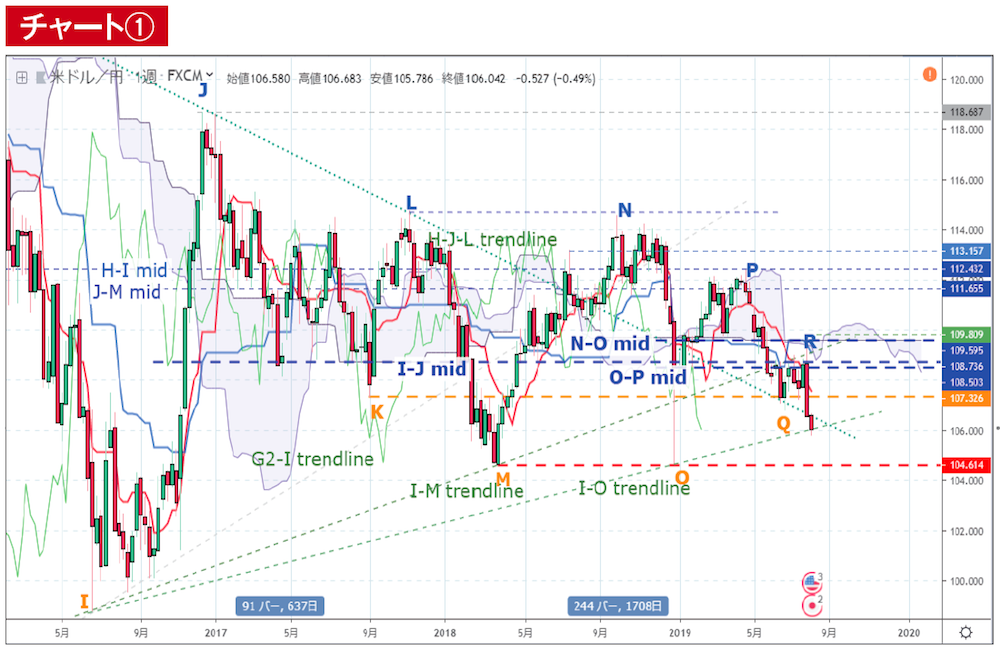
Chart ① Source:TradingView USD/JPY chart
We have been watching whether the price can hold the low K level supported by the closing price up to now as a sign of the strength of the decline. After rising three weeks from the low Q and failing to break the pullback, we ended up at high R. However, moving through the same week to break both the conversion line and Q means we must consider at least the near-term three-wave downward movement P−Q−R−X (X being the provisional low). The retracement of the middle wave Q−R, within these three waves, is also a small three-wave pattern involving an N value, so including this week, the shortest forecast is at least four more weeks of downside bias.
As mentioned in the last issue, the monthly-to-daily down-side support levels have already disappeared, but at the same time, the half-value levels of each wave within the large triangle consolidation after the high H have all become resistance positions. In fact, even when examining the most notable waves’ half-values before the historical low G, there were none that could be considered support, so we faced a situation where the ladder we had climbed was taken away. However, the current consolidation remains with a wide O−P range (larger N−O), and this is suggested by the fact that the Leading Span B (the 52 half-value lines) is still moving horizontally. Thus, the current situation shows very strong downside risk, and the prospect of an upward trend is extremely unlikely; however, it is also a market where a drop of about 10 yen in a short period is hard to envision, so we will first focus on the M−O low level.


