

Future market outlook, strategies and opportunity currencies (from 8/1)
Hello, this is OnePipTrade (@onepipst)
From 8/1 onward, I will share market forecasts, build strategies, and look for entry points
I base horizontal lines and trend lines on the daily chart
I also tweet about profits and other useful things,so pleasefollow Twitter.
Table of contents
- Dollar/Yen (USD/JPY)
- Euro/Dollar (EUR/USD)
- Euro/Yen (EUR/JPY)
- Pound/Dollar (GBP/USD)
- Pound/Yen (GBP/JPY)
- Afterword
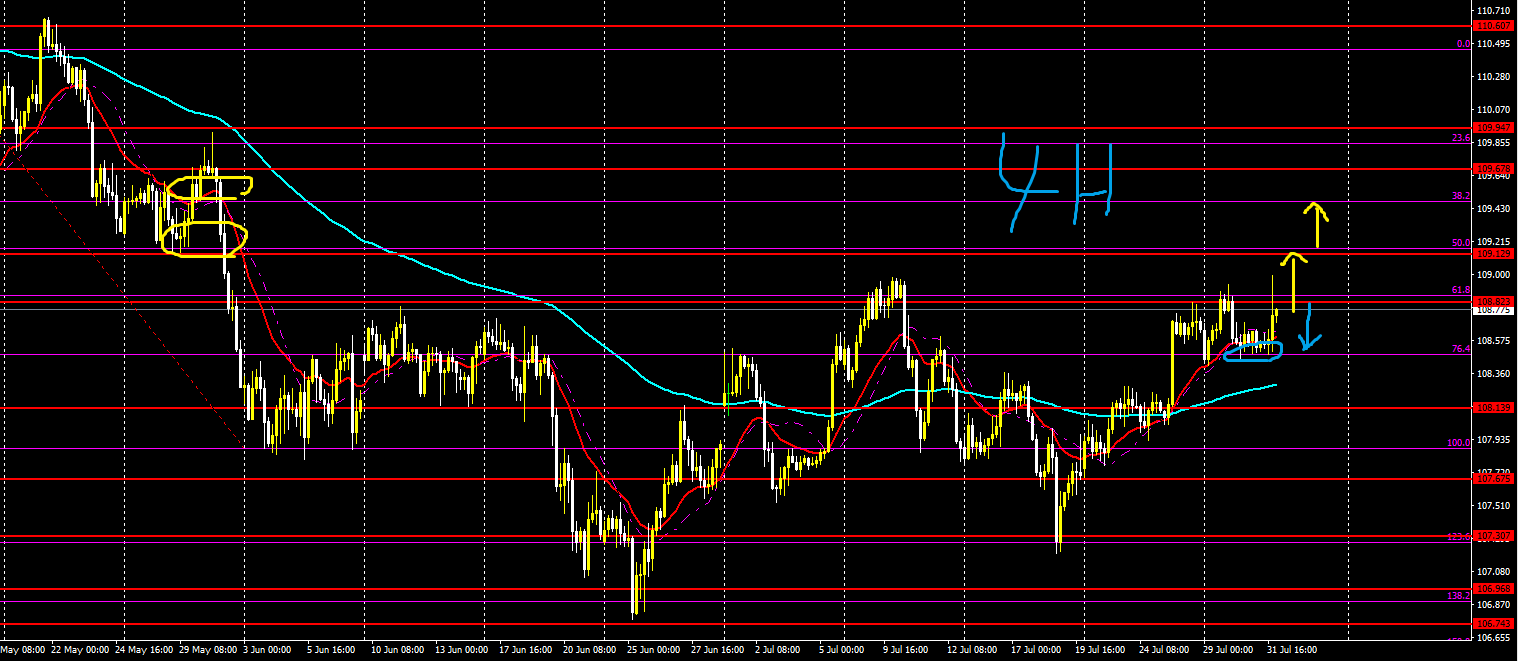
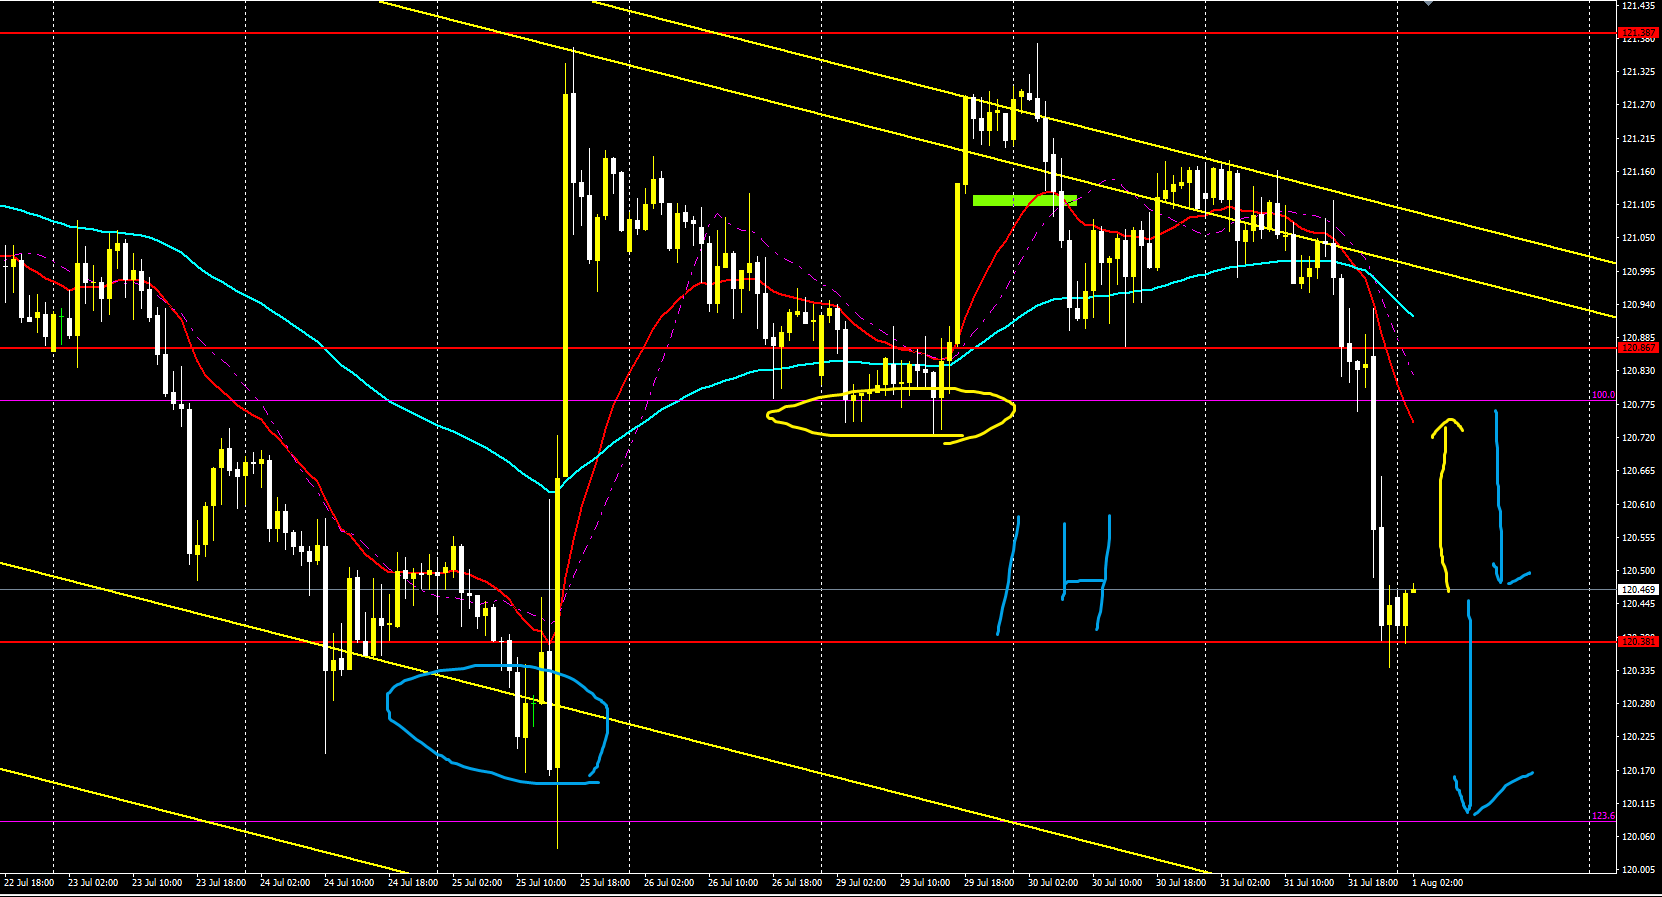
【USDJPY】
Trading difficulty B-
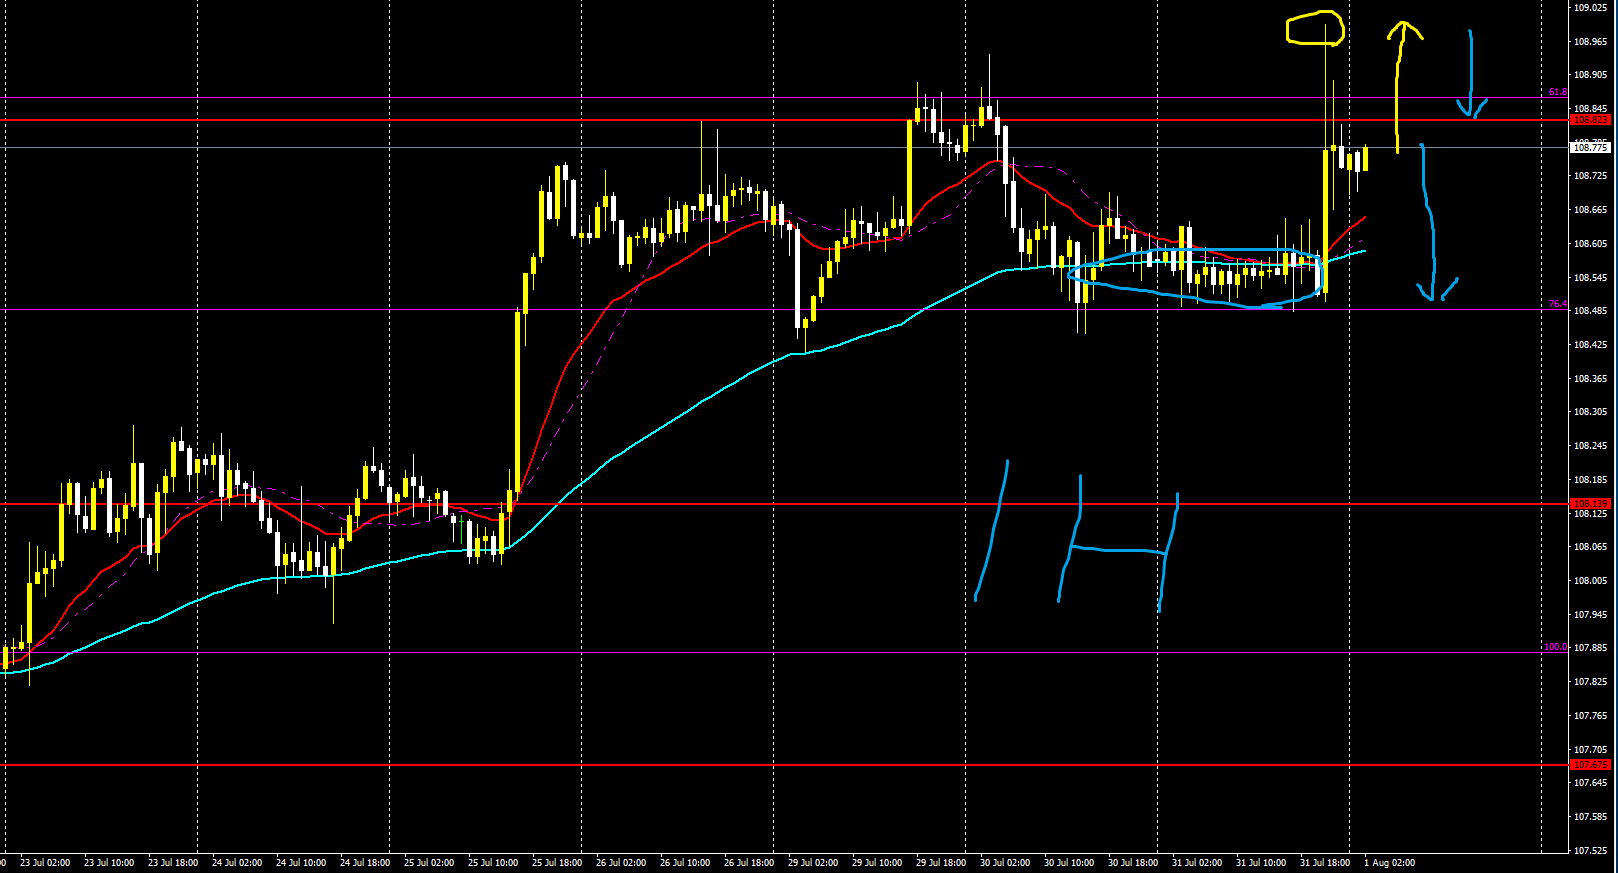
Long-term outlook is down, short-term is up
After the recent FOMC, the long upper wick suggests a breakout to new highs
Continuing that momentum, a long position may be fine
Or there is a possibility of selling again toward short-term MA
4-hour
1-hour
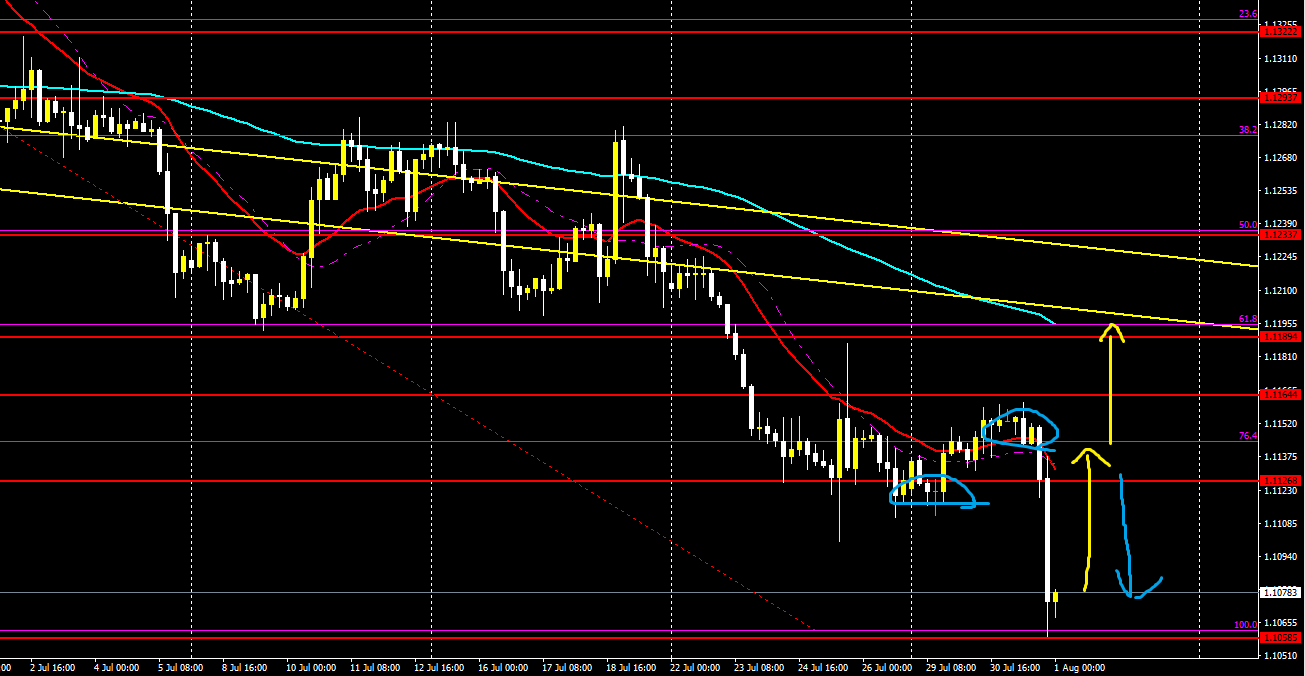
【EURUSD】
Trading difficulty A-
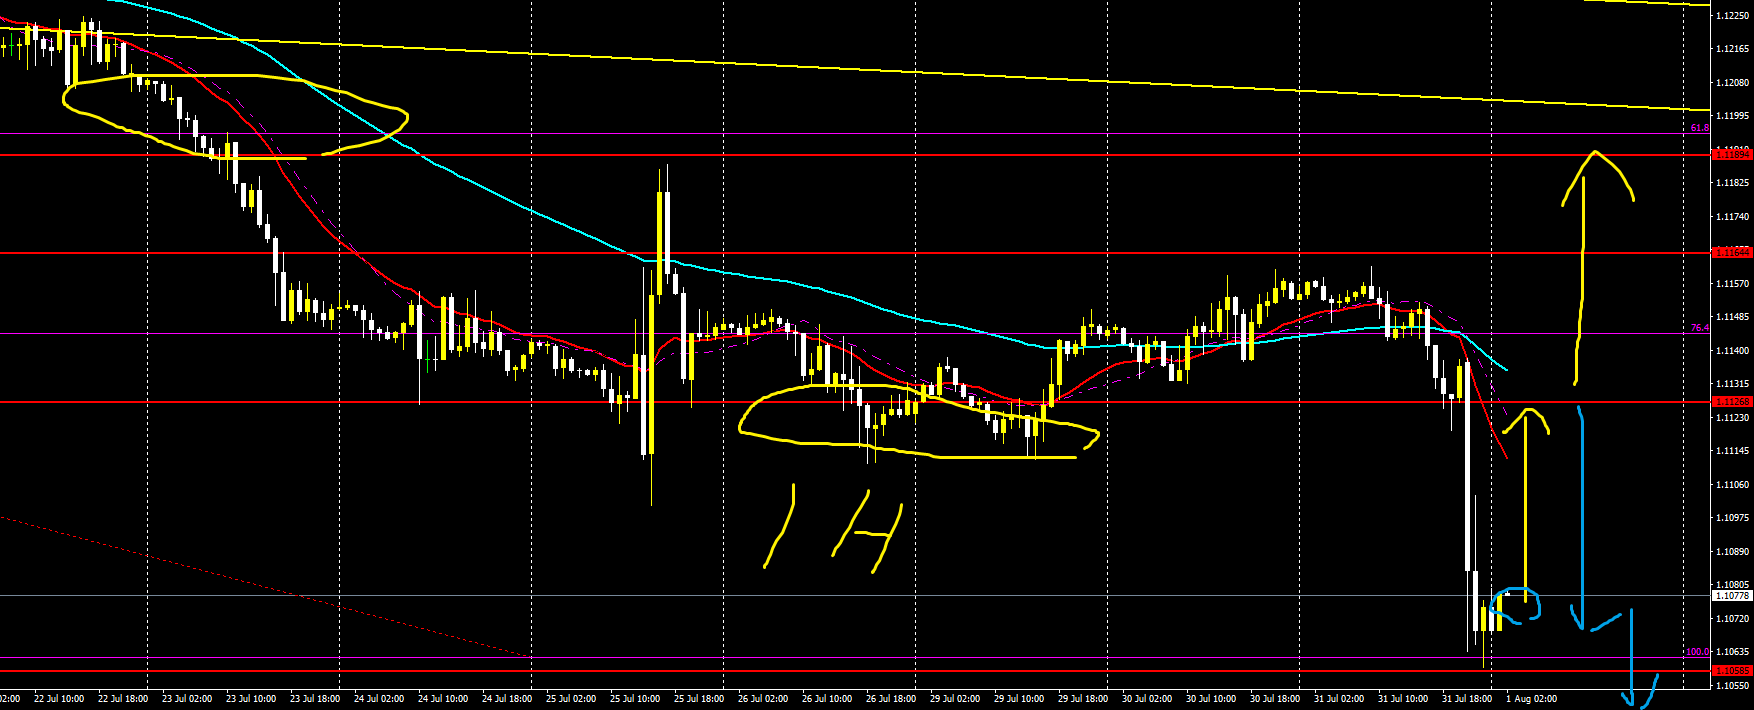
Long-term outlook is down, short-term is down
It has broken lower, so a pullback is possible
Therefore pullback buying is effective
Refer to the Fibonacci 76 area line and short-term MA
When a pullback occurs, we should sell
Conversely, if pullback is weak and it continues lower, selling may proceed
4-hour
1-hour
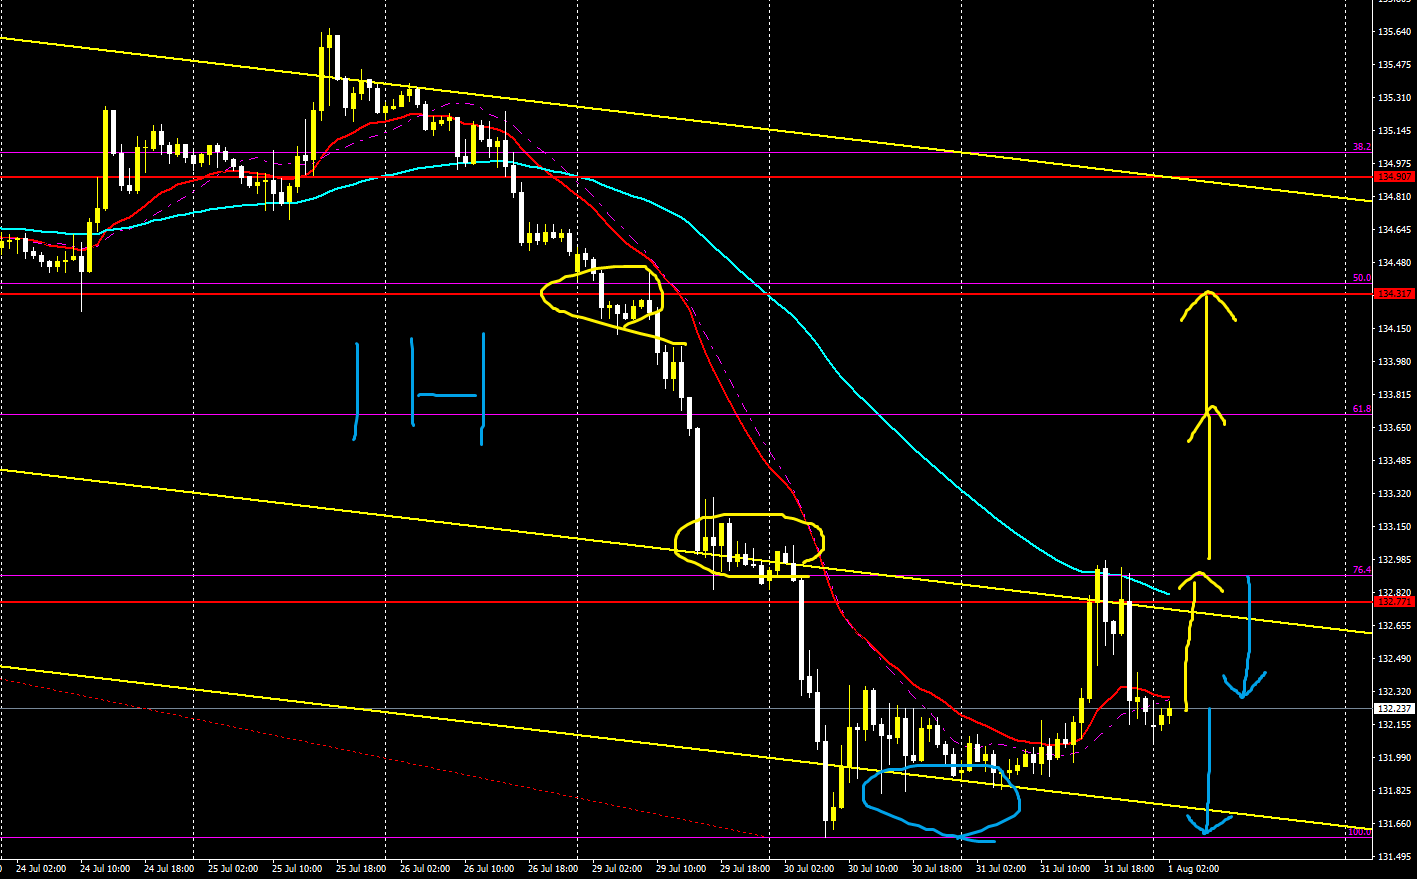
EURJPY】
Trading difficulty A-
Long-term outlook is down, short-term also down
Similar to EURUSD, a pullback may occur
Refer to Fibonacci near 100 or short-term MA for contrarian buying
And once a pullback occurs, sell
Conversely, if pullback is weak and it continues down, selling is also in view
4-hour

1-hour
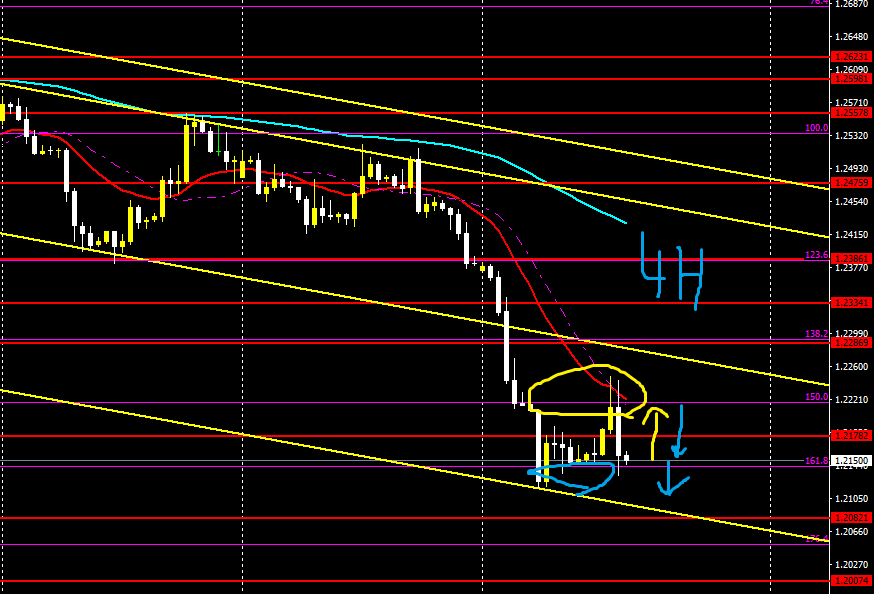
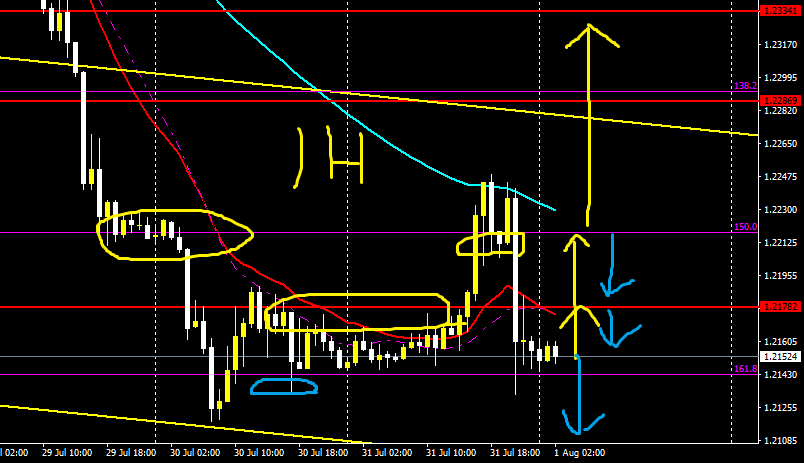
【GBPUSD】
Trading difficulty B+
Long-term outlook is down, short-term also down
It may range sideways
Pullback to short-term MA and then sell
Safe approach is to sell after a breakout of the lows, or buy after clearly breaking through Fibonacci 150
4-hour
1-hour
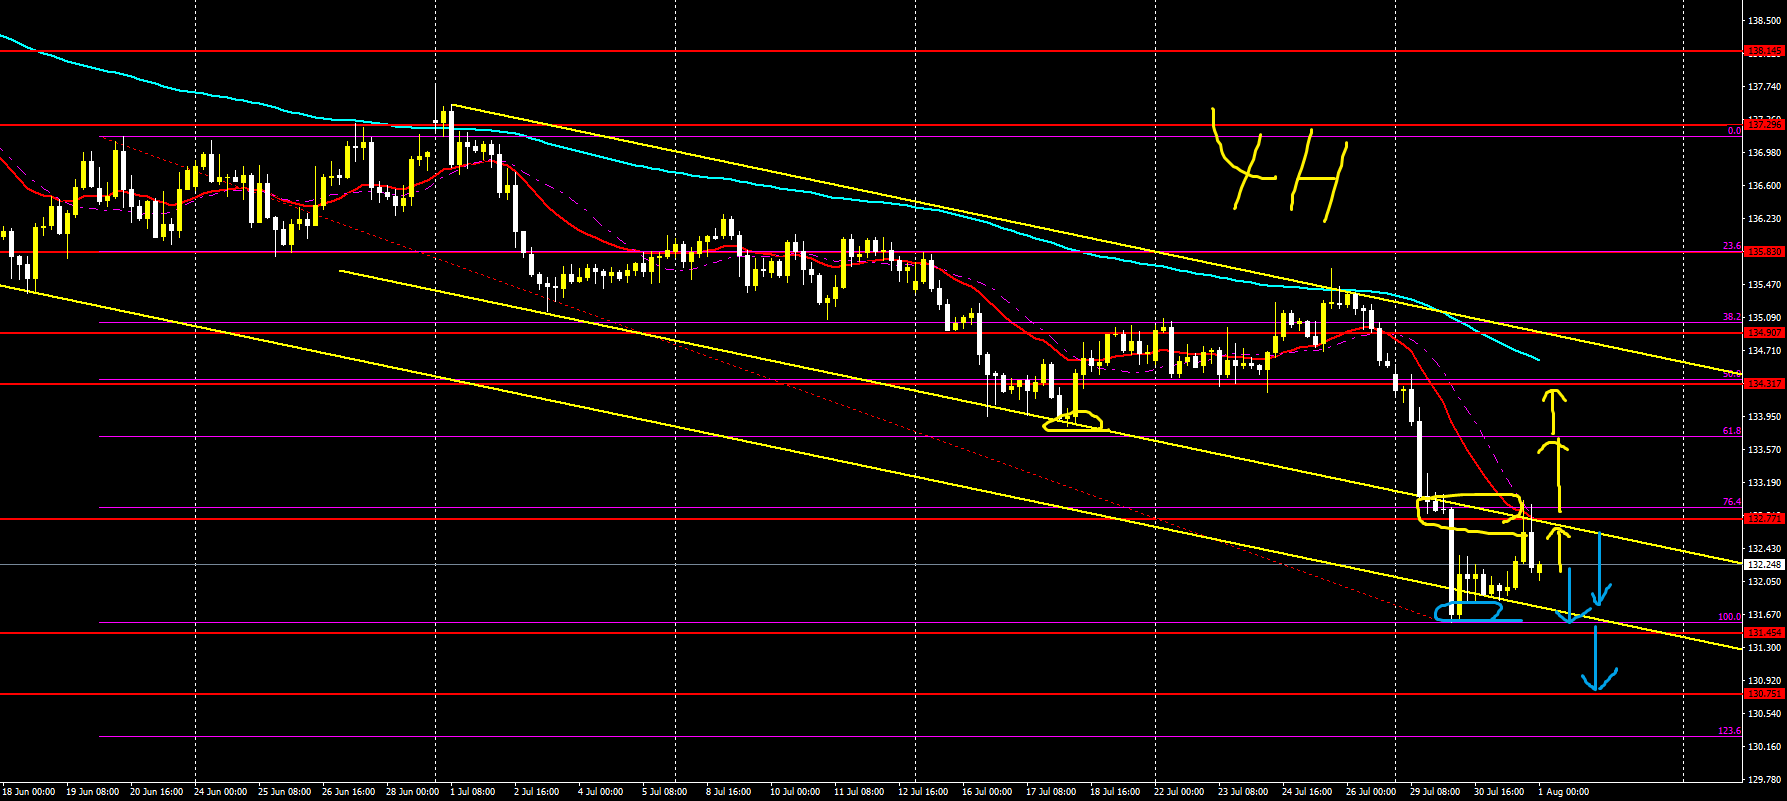
【GBPJPY】
Trading difficulty B+Trading difficulty B+
Long-term outlook is down, short-term also downLong-term outlook is down, short-term also down
There may be a retrace for a dipThere may be a retrace upward
Retrace up to Fibonacci 76 before sellingRetrace to 76% Fibonacci before selling
If it breaks above that, it may rise to 61 or 50If it breaks above that, it may rise to 61 or 50
4-hour4-hour
1-hour1-hour
【GBPJPY】【Afterword】
The arrows drawn in the images indicate the favorable direction
Yellow indicates upward direction
Light blue indicates downward direction
But that only indicates a relative advantage; it does not guarantee that the price will react or rebound at that level
However, since arrows are drawn near key levels, please consider them as trading references
Arrows may become take-profit or stop-loss points
And please use the lines and Fibonacci similarly as references for take-profit, stop-loss, and entry points
I publish weekly market forecasts and strategies on YouTube, and they are generally accurate each time
What matters is how you apply them to trading and entries
When the market strategy was right or wrong, your trading method and approach will differ
And please treat each entry as a separate matter


