

Learn how to create buying/selling plans from currency brokers|Episode 19 Incorporating the concept of three waves into USD/JPY market analysis 12 [Toshiro Asano]

Toshio Asano will thoroughly teach his trading methods and market-view-building know-how backed by his own experience and knowledge in this project. As in the past, he will continue to interpret the recent and future USD/JPY market and, based on that, present the most suitable buy/sell plan.
※This article is a reprint and revision of an article from FX攻略.com November 2018 issue. Please note that the market information written in the body may differ from the current market.
Toshio Asano Profile

Asano Toshirō. He has worked at Tokyo Forex Co., Ltd., a foreign exchange brokerage in the Tokyu Group, and at EBS (now ICAP), known for over 80% of the world forex trading share, among others. He experienced historical markets firsthand, including the 1985 Plaza Accord, the subsequent era of strong yen, the bubble burst, and the euro introduction in 2000, which helped him develop his market sense. He later founded two FX trading companies and has worked as a trader for a private FX fund. Currently, he writes for the daily blog of the Investment School Group. He is also a strong supporter of easy-to-understand video works, leveraging his video editing skills.
A Narrowing, Consolidation-Heavy Move Continues
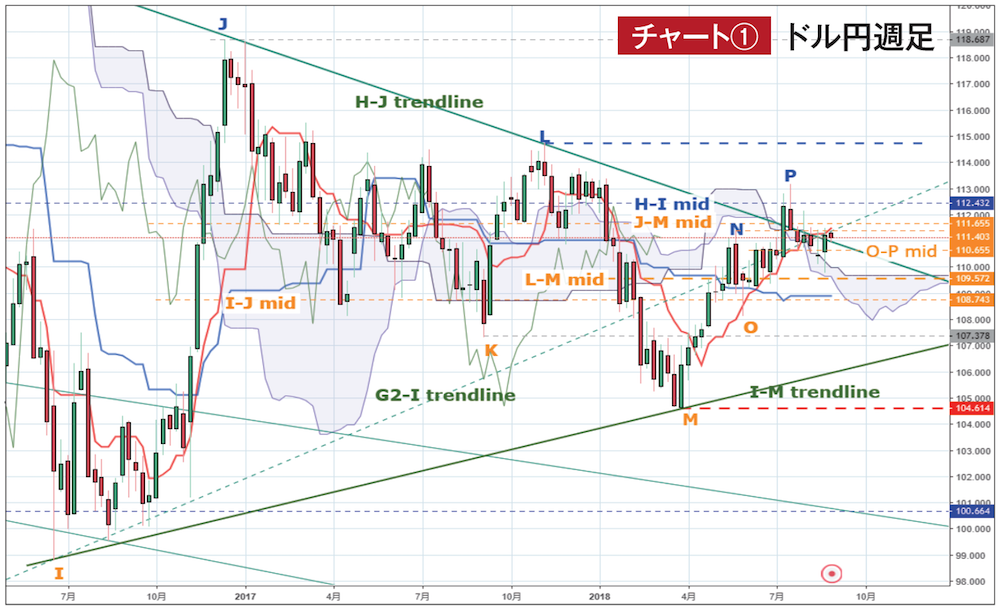
Chart 1 Source:USDJPY chart by TradingView
Before the weekly analysis, here are the changes this time (Chart 1). The high P has been confirmed for the moment, and the three waves M–N–O–P have completed, so M–Nmid has been removed. Ideally, M–Pmid should be newly added, but for four more weeks the baseline remains meaningful, so this is postponed. One reason the upside remains constrained is that the drop after the high J has not yet been completely denied; while the calculated N value for J–K–L is valid, practically it is unnecessary until the low M is broken, so it is temporarily removed. On the other hand, the mid of the final upward wave O–P has been added.
Now for the weekly analysis, this past month has required reconsideration of the uptrend, and another consolidation is the plausible path. Reasons include: 1) the upward wave since M has run out of time, 2) the inability to update the high L in this flow, and in addition, 3) compared to the down-wave duration L–M of 21 weeks, the upward duration after M reached 21 weeks by the week of August 13, showing that the upward force after M did not match the downward force from L–M.
From P to the present, the decline has only risen in price both on the lower and upper sides by one week when compared to the previous week, and the turning line is acting more like resistance than support. The price has already breached the high N level, and O–Pmid cannot support it, which is bad news for an upside view.
On the other hand, it is hard to call it a resumption of decline because, even passively, prices have risen above the leading span again, and for the turning line to reverse early or for the baseline to fall, there would need to be a sharp drop below M, which is not realistic. Also, the positions of the lines in the Ichimoku chart still indicate a strong upward trend and an environment where high prices can be pursued at any time.
That said, in the near term, the only plausible clue for an upside move is that the third wave of I–J–M–P would extend, leaving only to monitor whether M–P or O–P acts as the first wave, so you understand that as long as price does not break either L or M, it will be moving within this range.


