

[7/29] Entry Point Distribution
【AUDCHF】
▼ Status Check
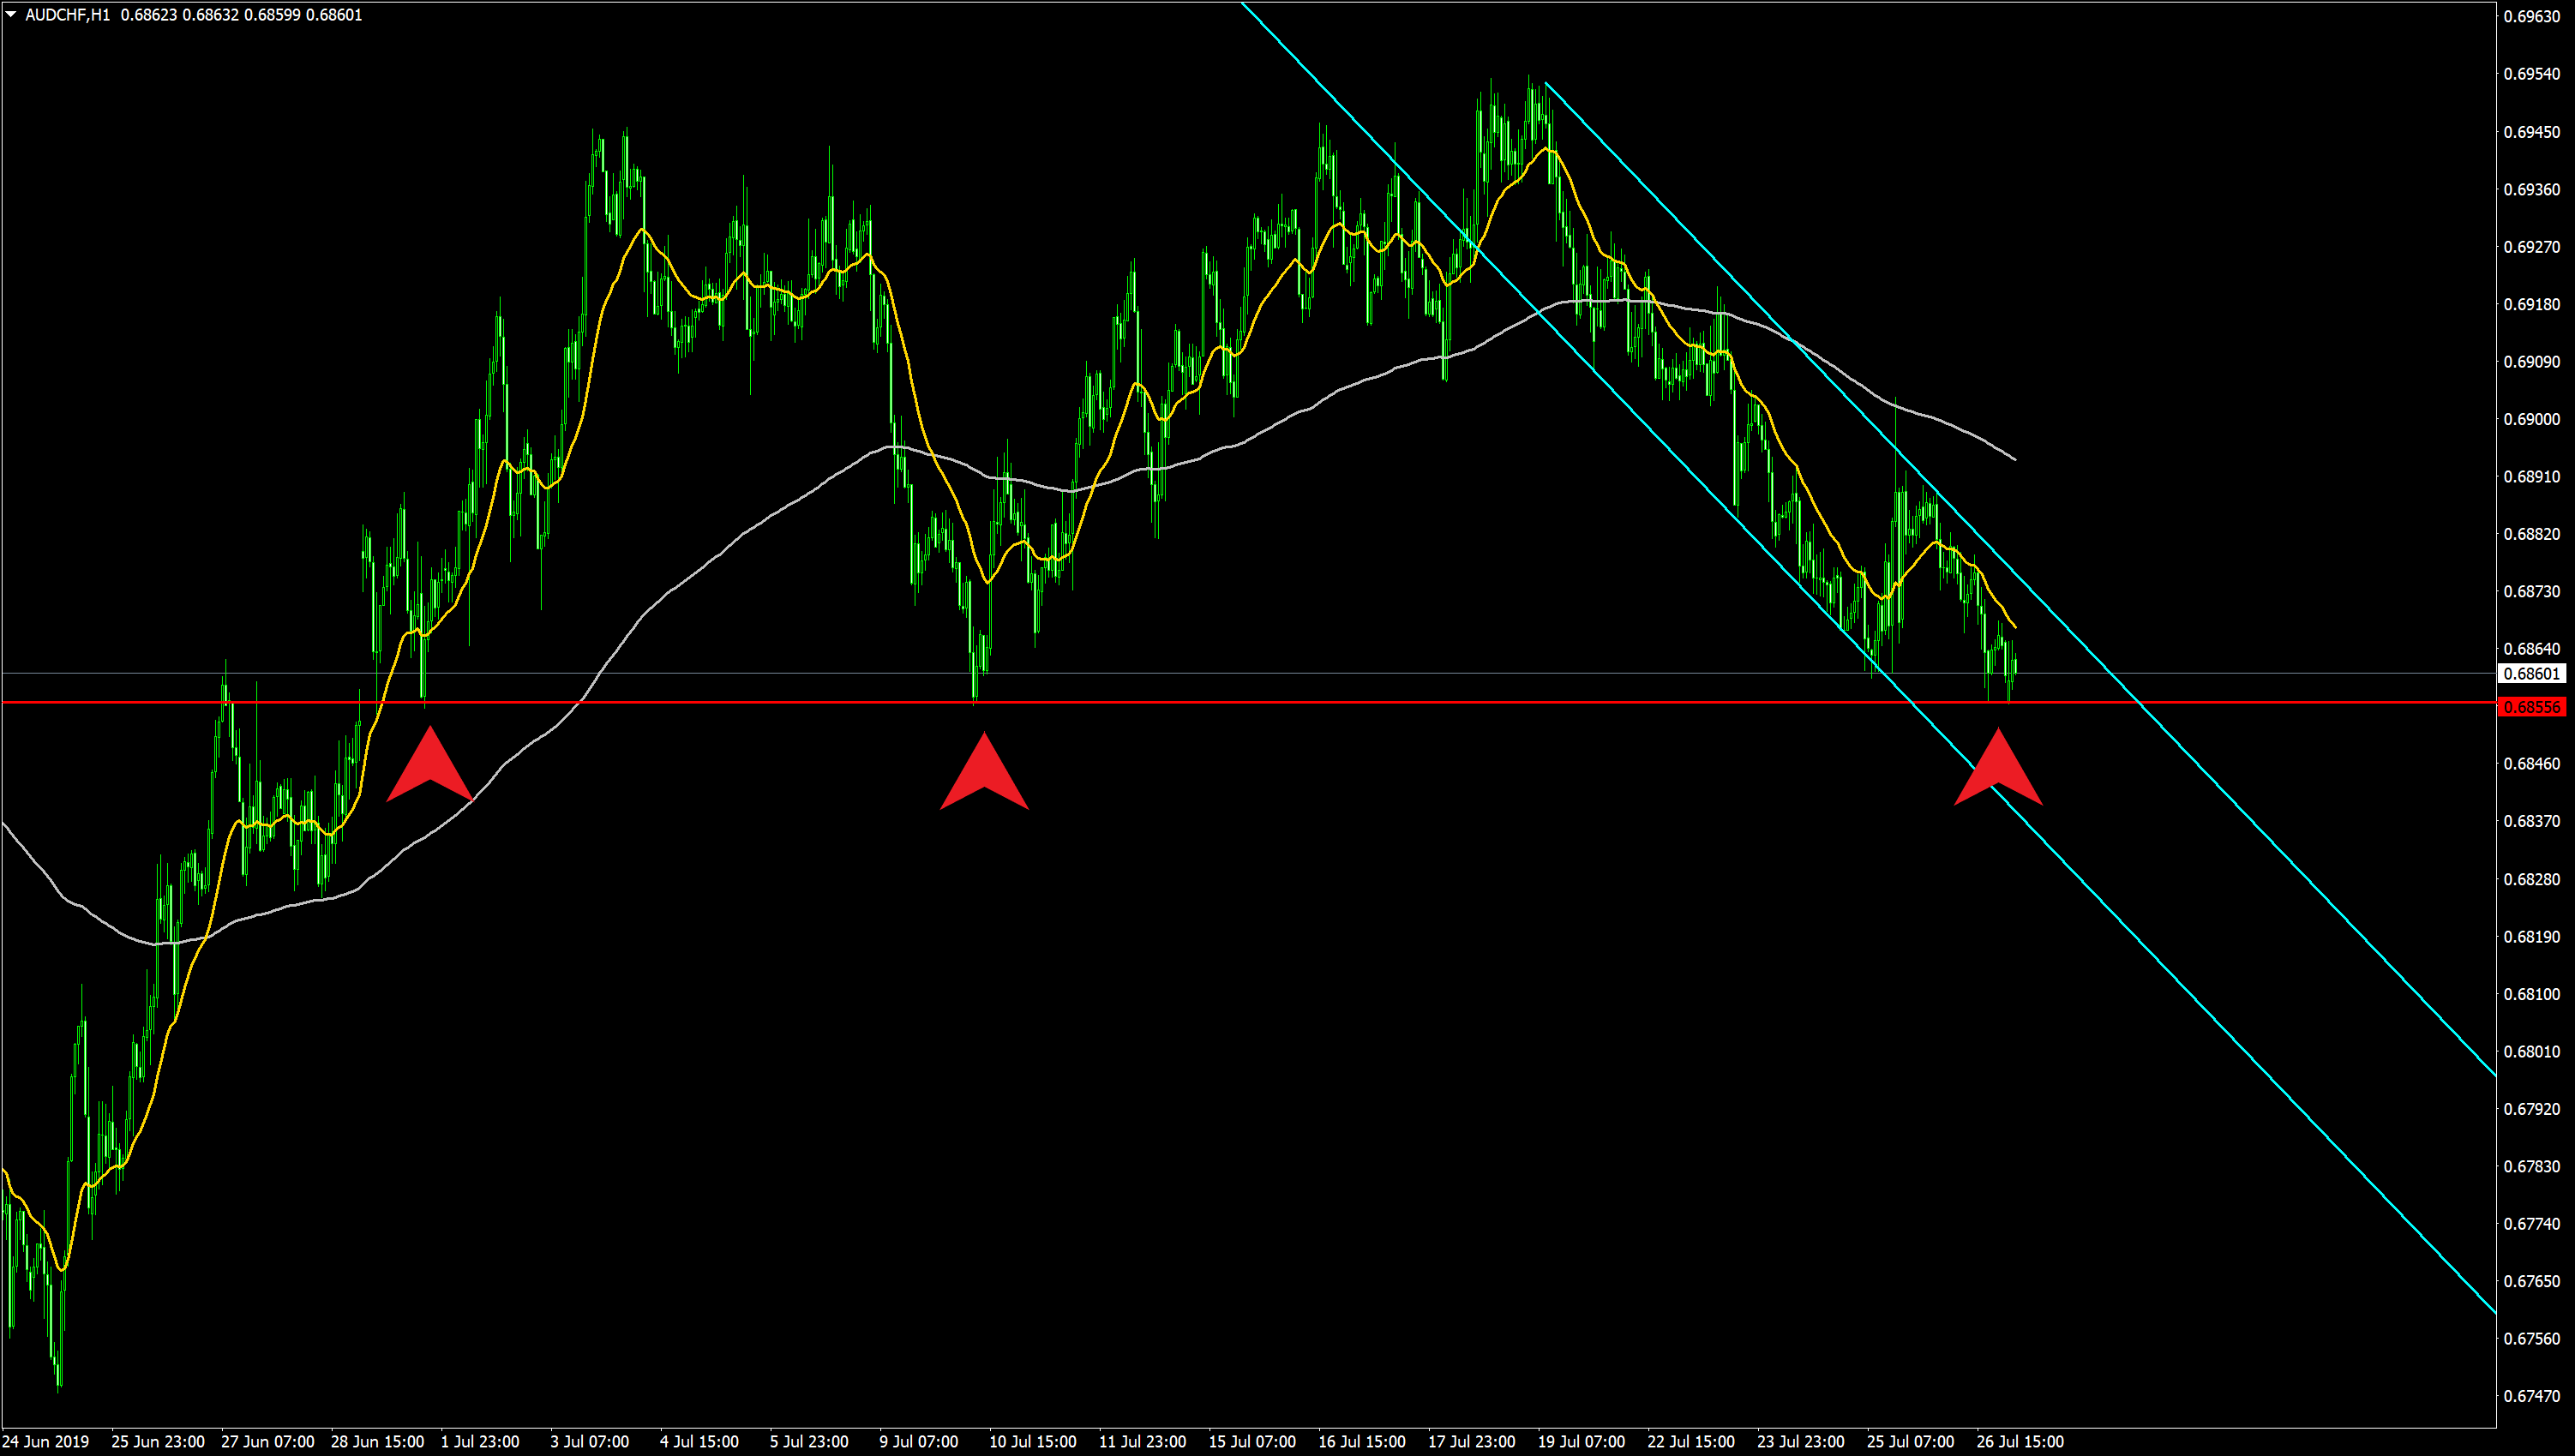
Overall currency correlation and technicals point to AUDCHF as the most promising.
A downtrend is confirmed on the daily chart, and the same downtrend is forming on the short term as well.
Naturally, the perspective is bearish.
The line that must not be broken at all costs is the red support line below.
There are three red-marked support points, and it is a very important moment to challenge the red support within a descending channel.
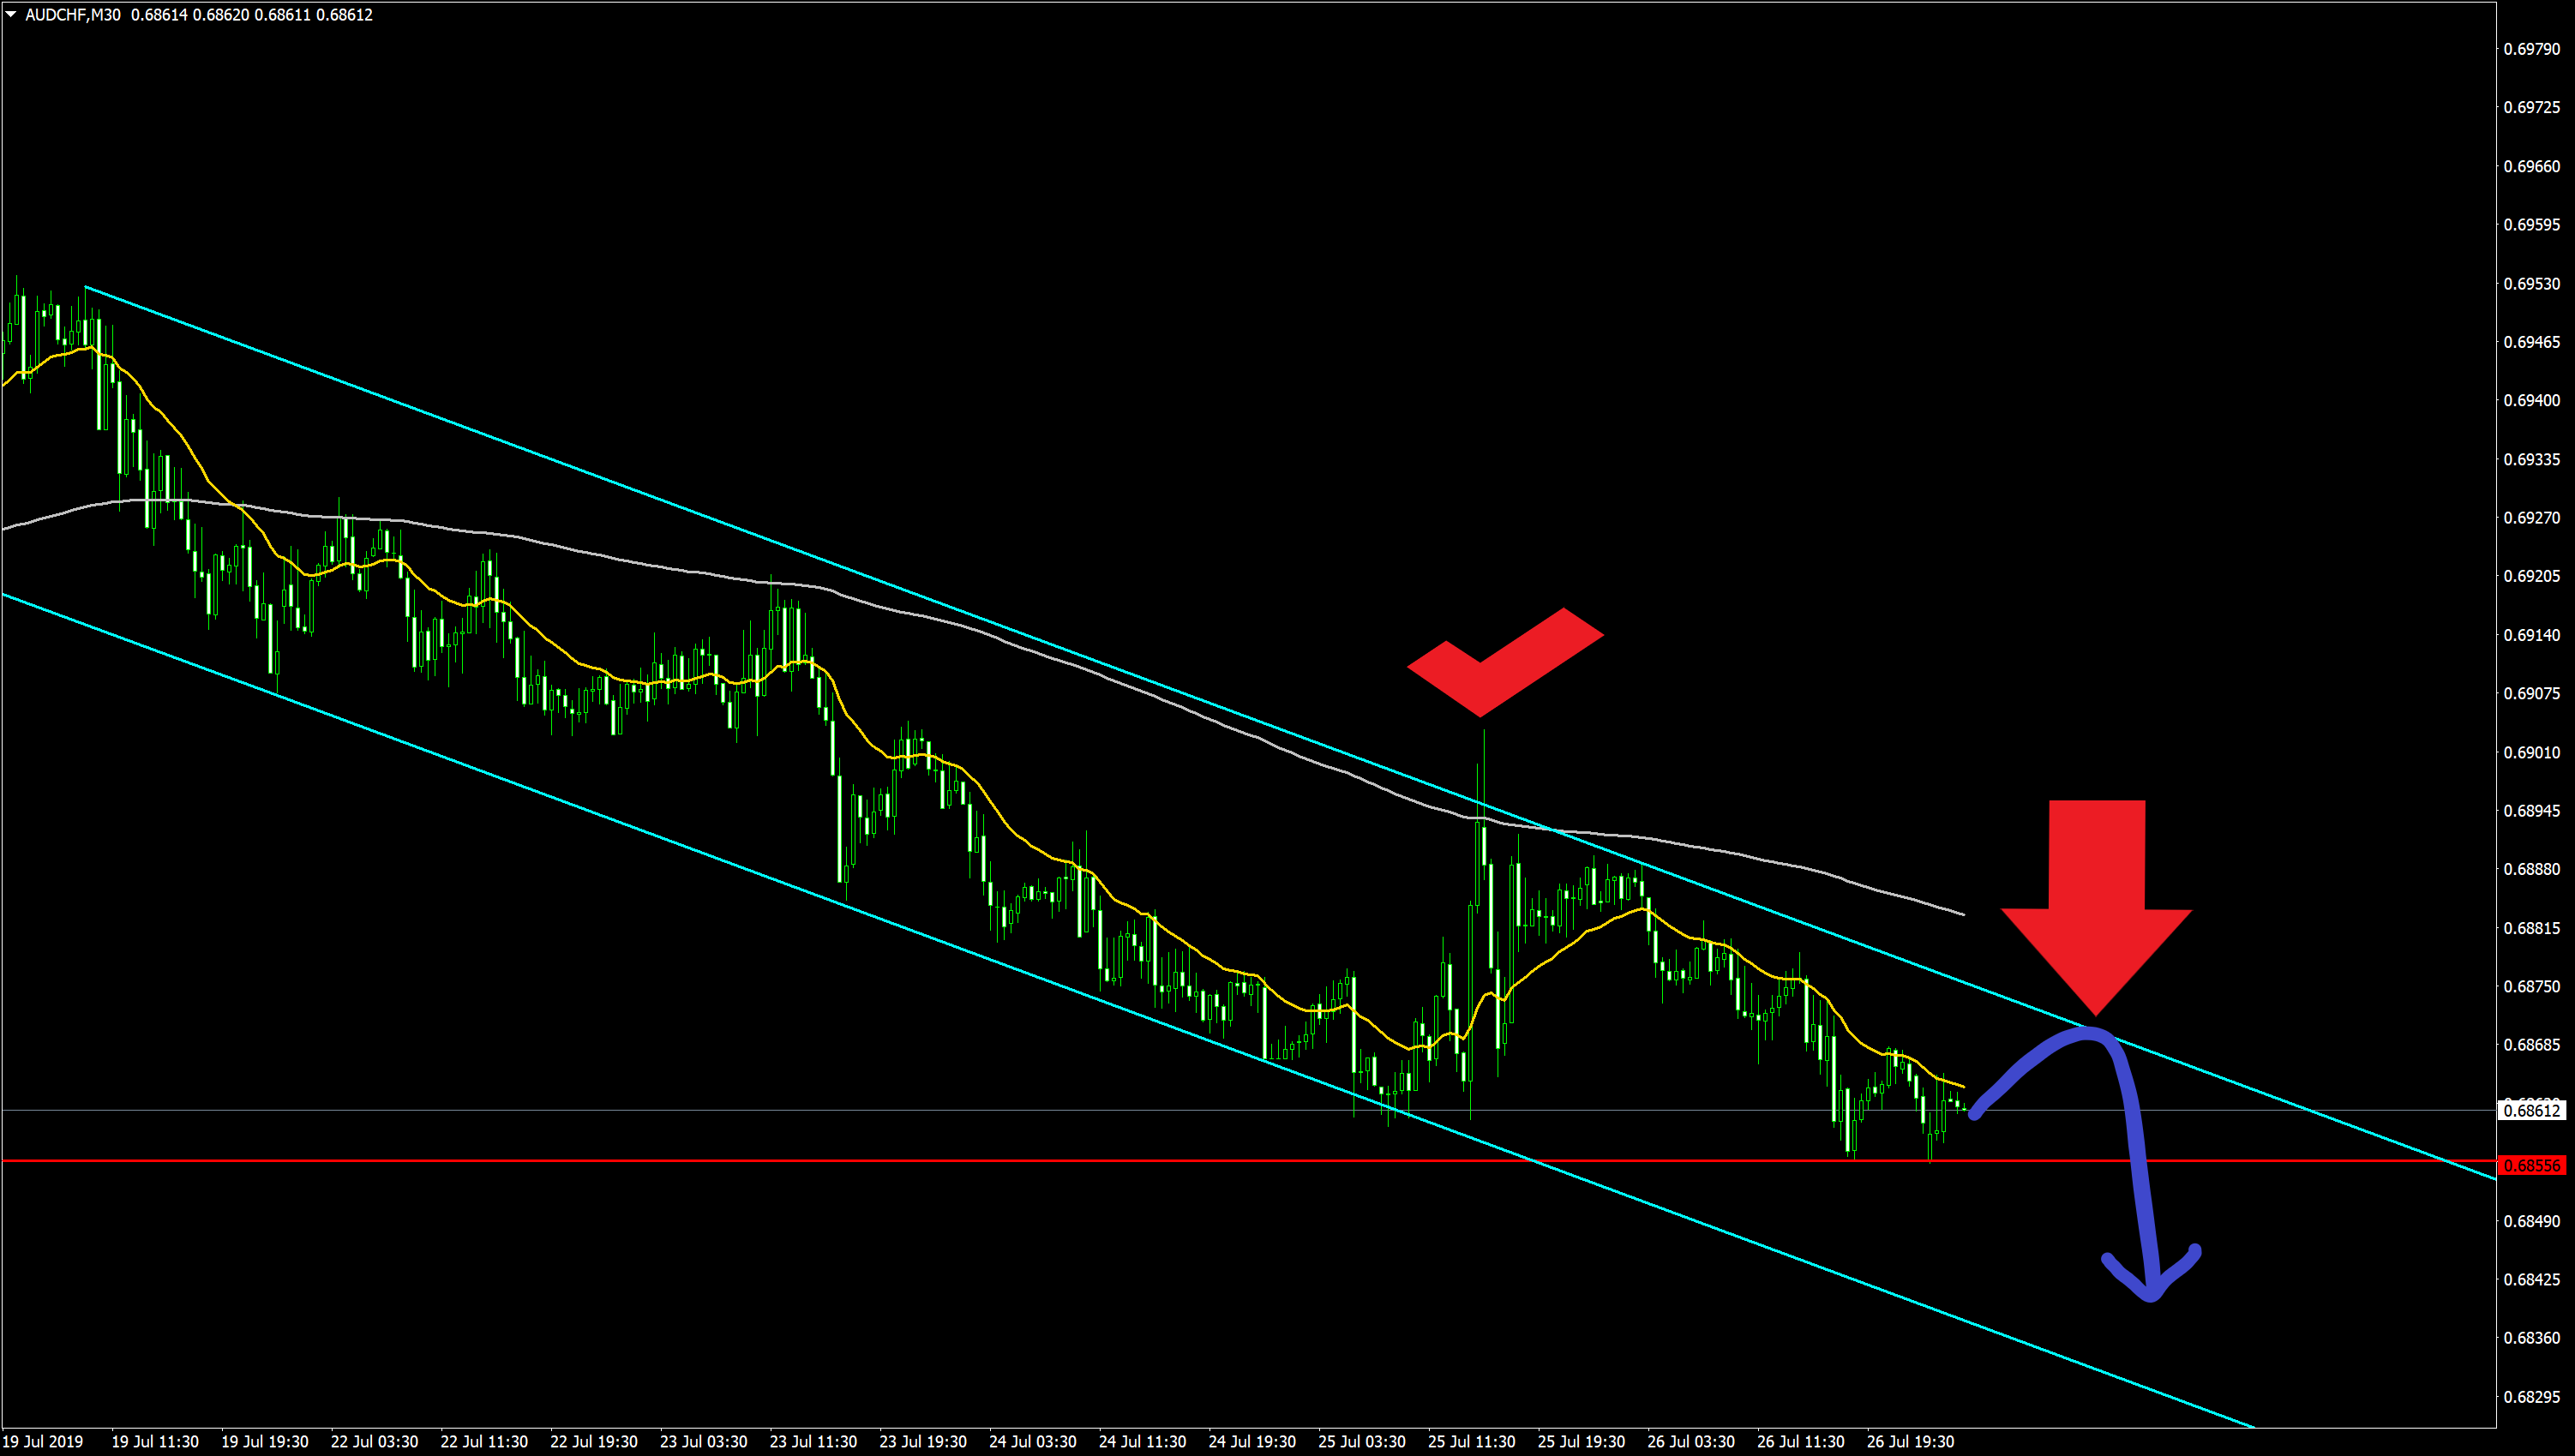
《1H》
▼ Entry Pattern ①
On the 1-hour chart it is hard to see, so we will look a little shorter time frame for more detail.
In Pattern ①, please focus only on the red support.
Because this is a parallel line,the price remains constant, so limit orders and stop orders tend to cluster and the next price movement is greatly affected at this point.
After breaking below the support and then returning, the red arrow becomes the entry point.
If this pattern forms with the current waveform, even if things go smoothly, the move is likely to occur tomorrow or later.
The key is to enter once you have clearly broken through and clearly pulled back.
If the breakout is messy, and not clearly recognized, do not enter.
Drawing this single support line provides a very high edge for trades.
《30分足》
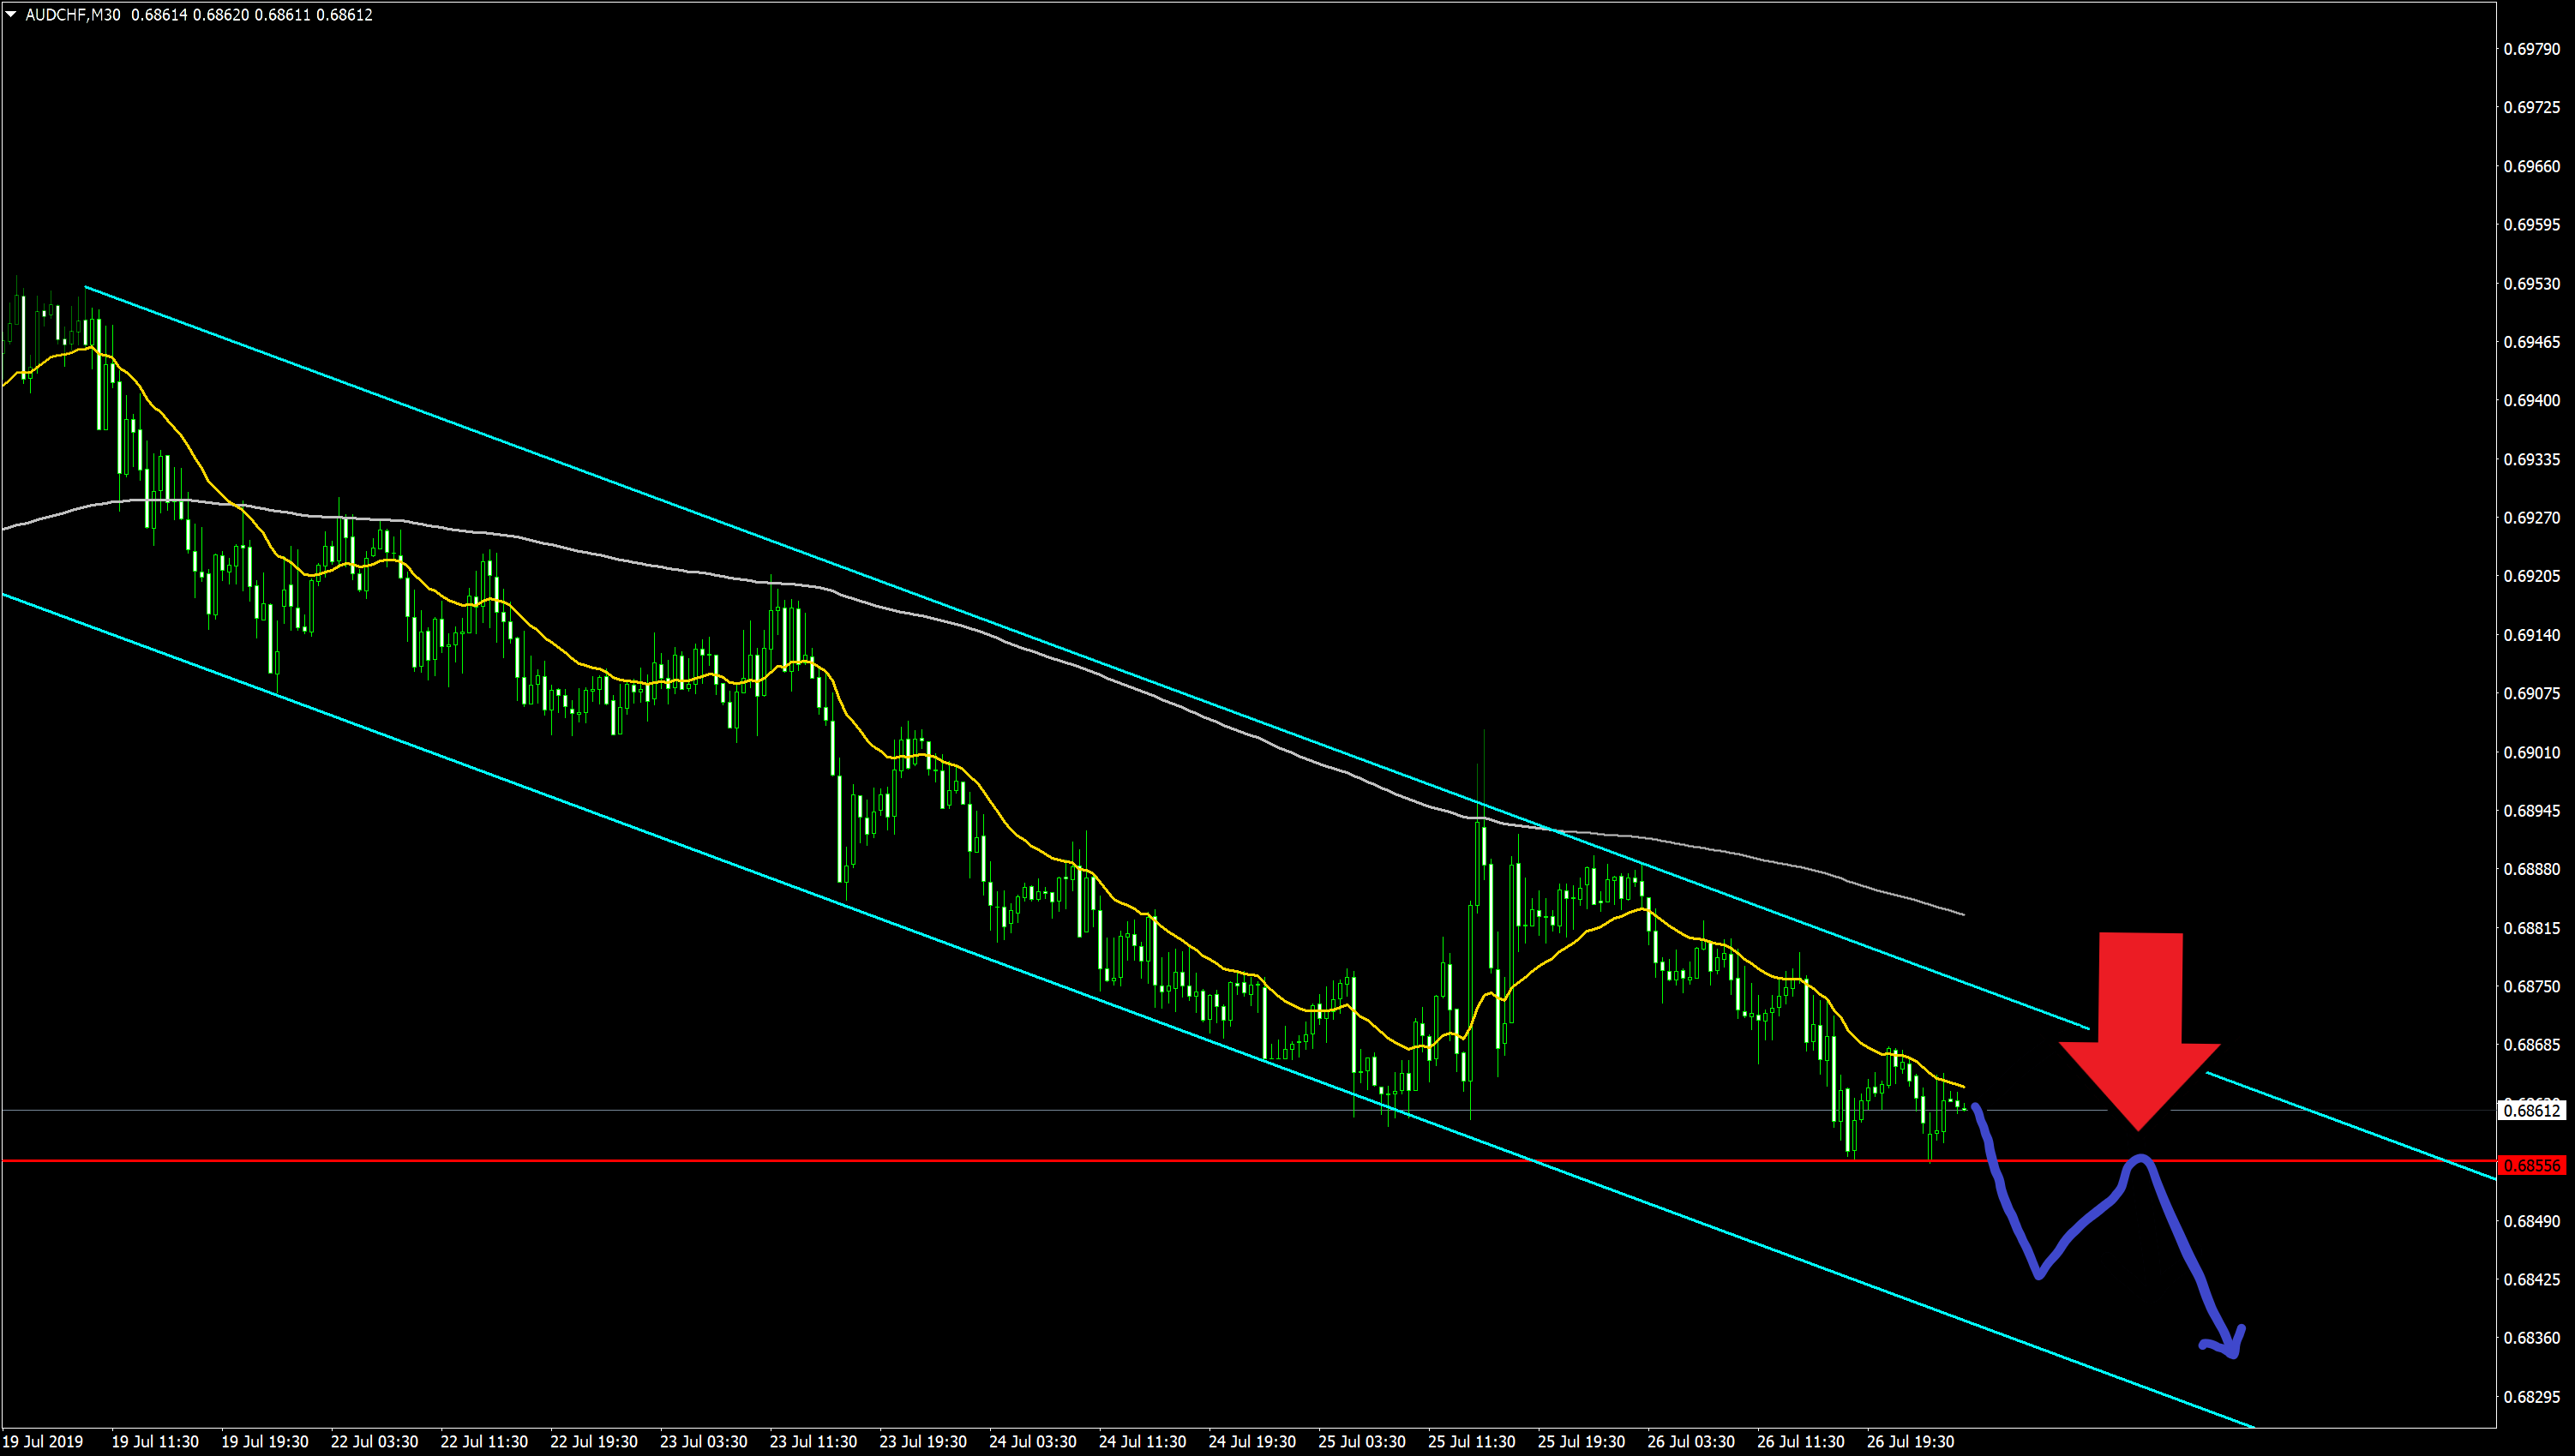
▼ Entry Pattern ②
Next, focus on the channel lines.
This is red-marked; there has been a failed breakout to the upside, forming an overshoot.
As mentioned at the beginning,From the daily to the short termDowntrendprogresses,an upward overshootoccurs,which may lead to continuation of the downtrendwith about a 50% higher probability.
Compared to the previous parallel line, the channel moves with time, so targets for limit and stop orders may be somewhat dispersed, slightly weakening the basis.However, there is also the upside potential added by the overshoot, so entering is not problematic.
Also, given the waveform size, this could occur within today.
《30分足》
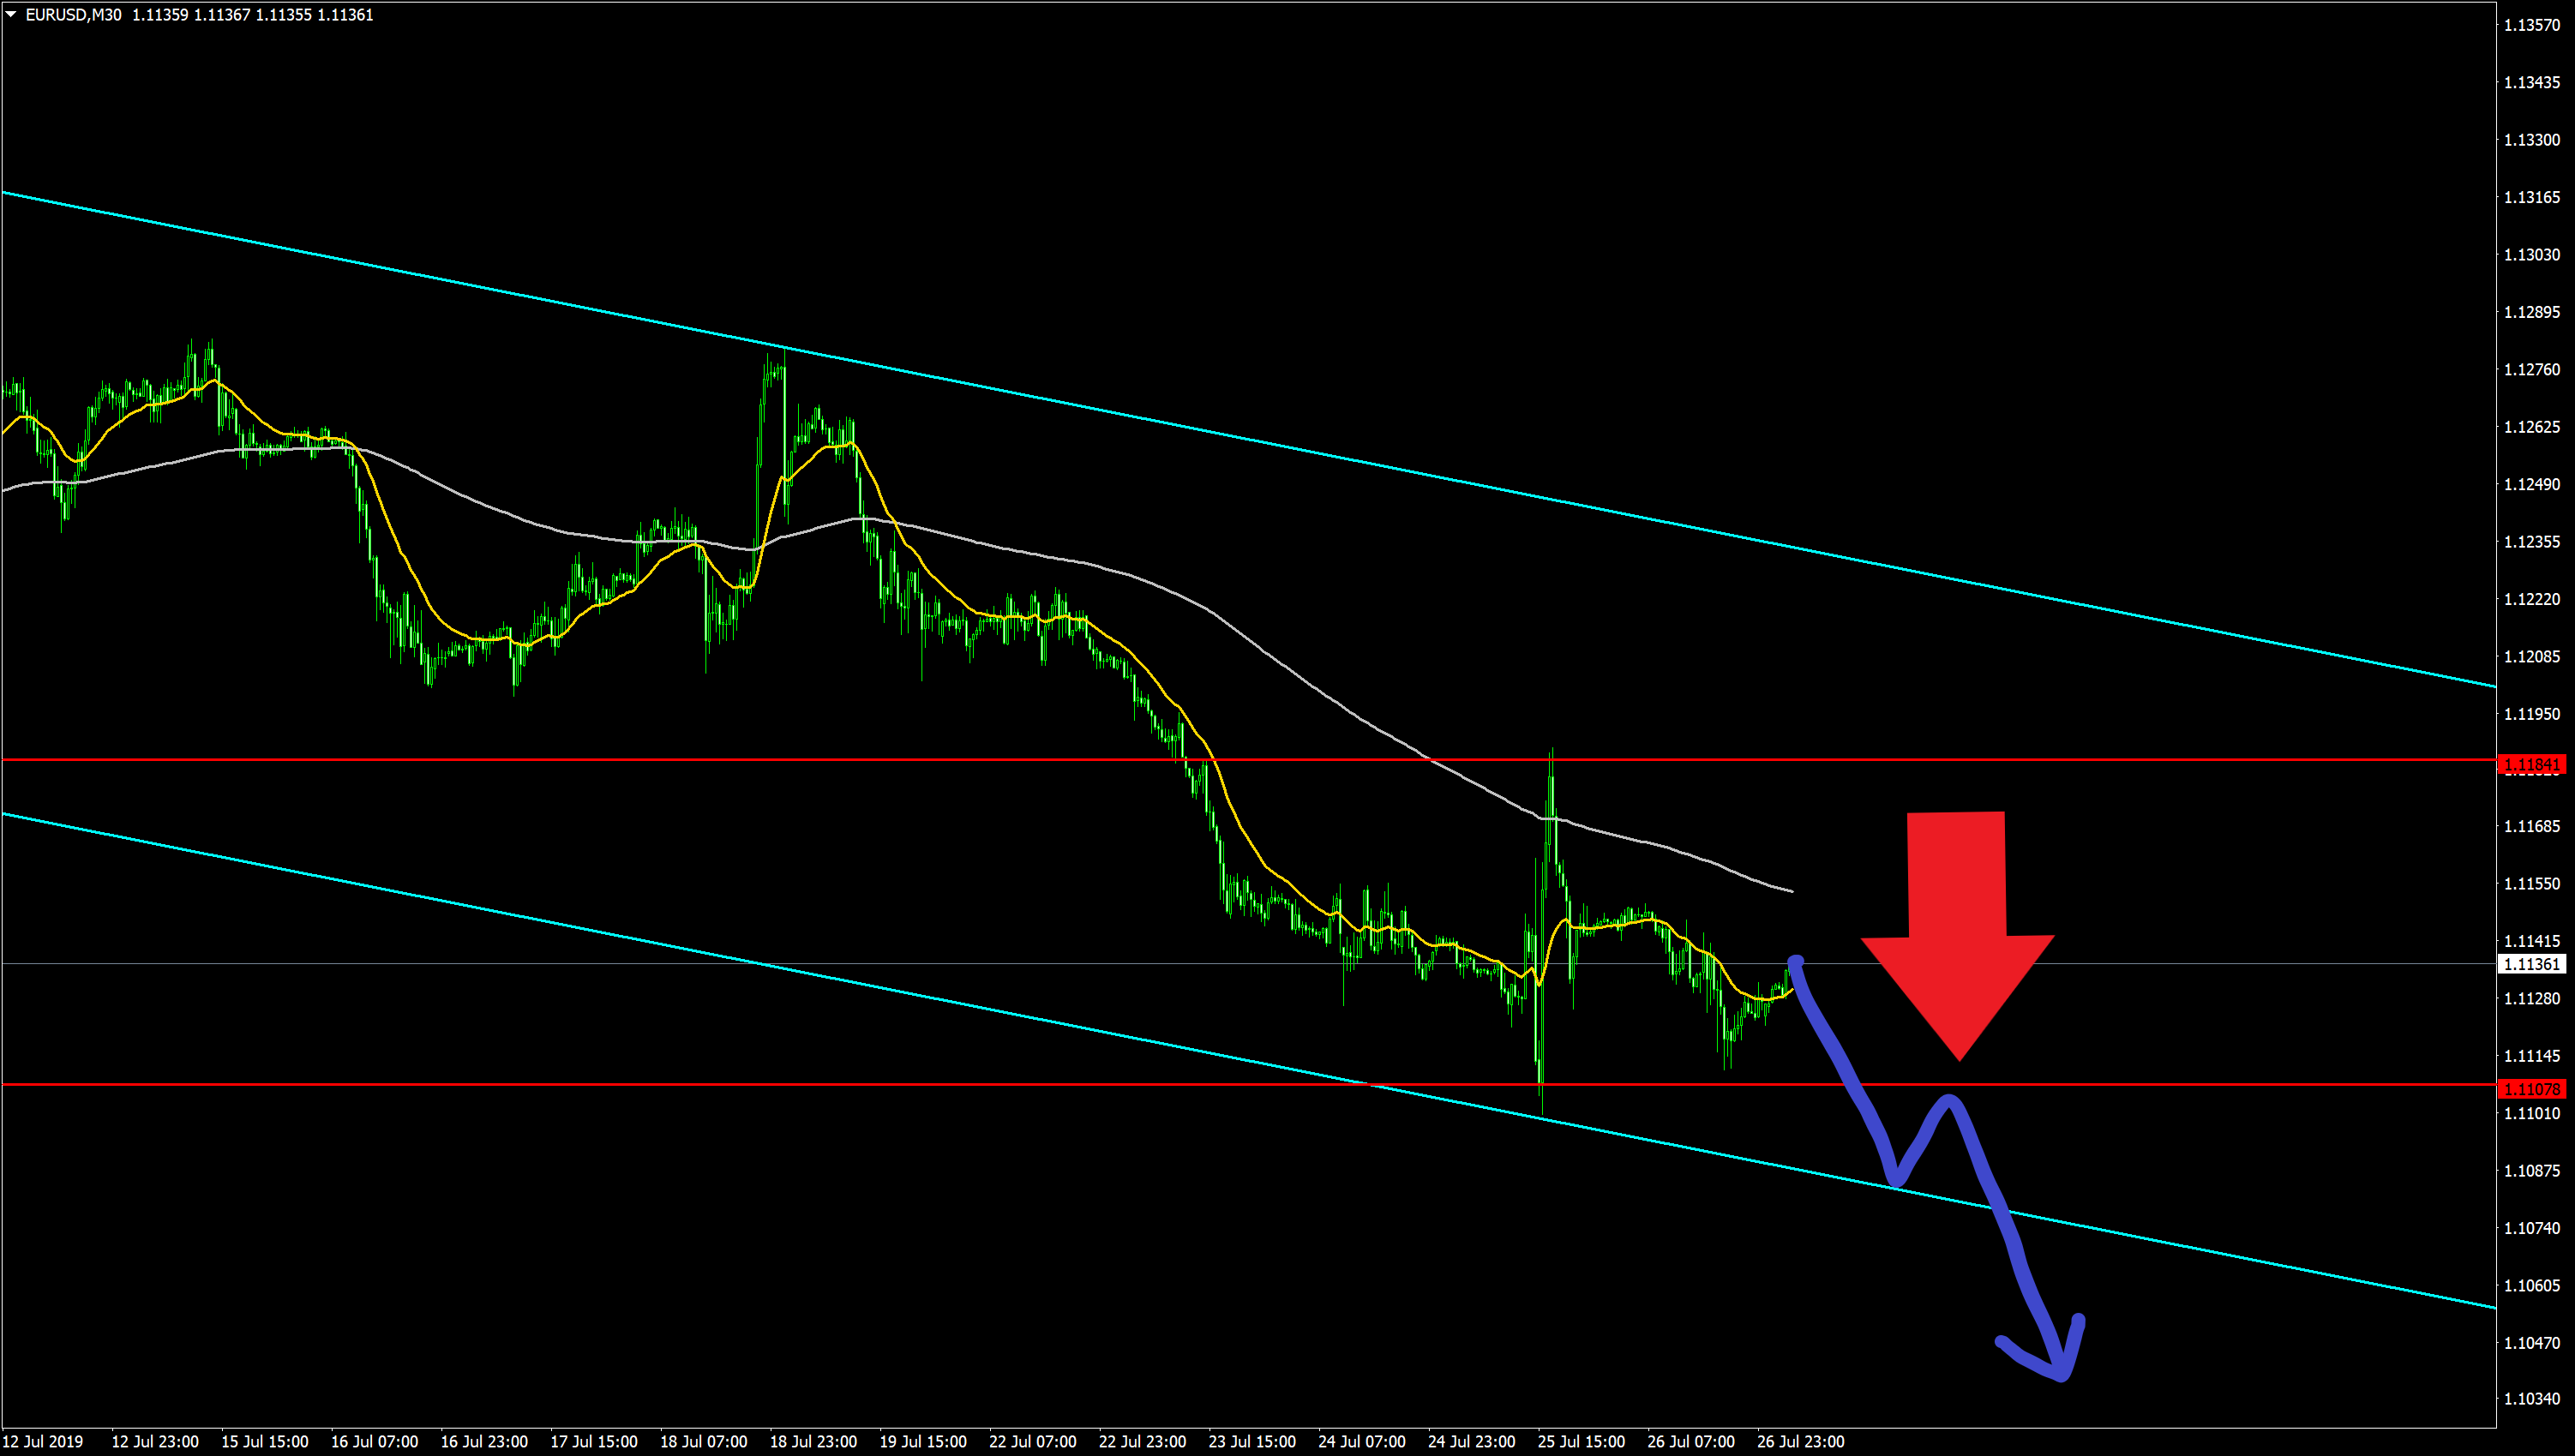
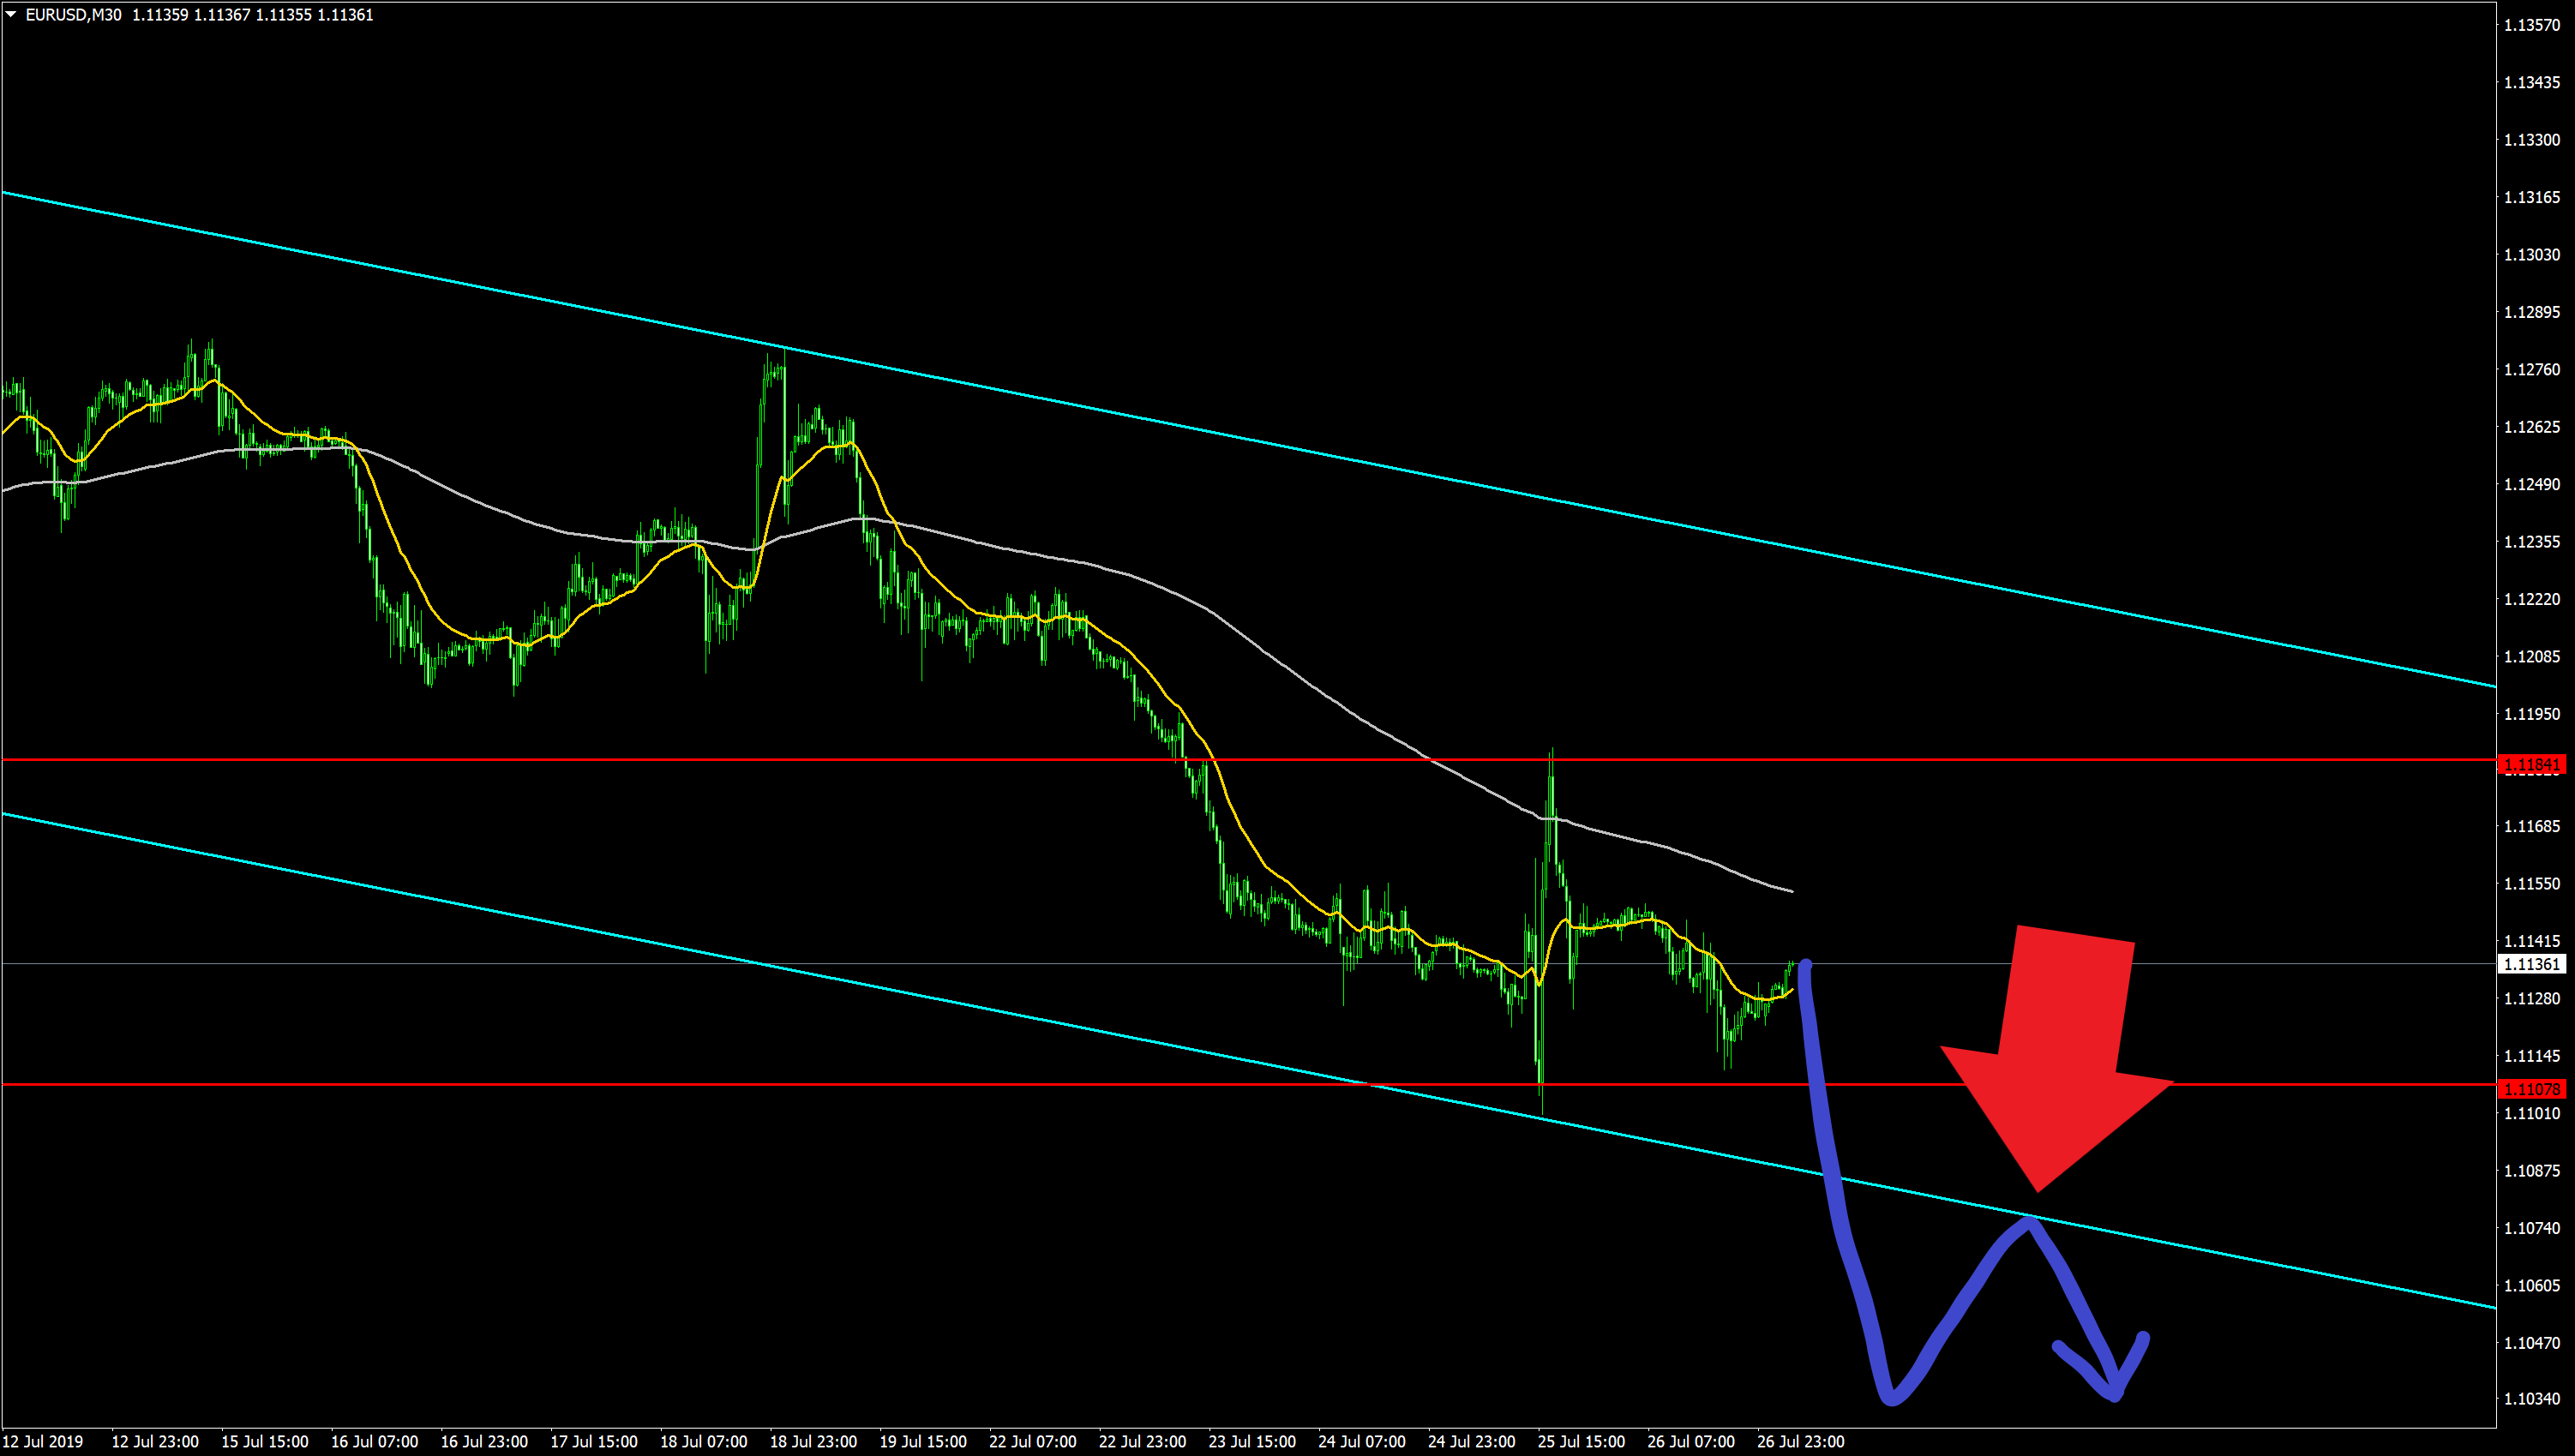
【EURUSD】
▼ Status Check
Like AUDCHF, this pair also has high potential.
The daily downtrend and the short-term downtrend are both confirmed.
There are two red parallel lines for evaluating entries, and an attack via a channel is currently underway.
Obviously, the view is bearish here as well.
▼ Entry Pattern ①
The red arrows are the target.
In words: after breaking below the lower red line, there is a pullback around the channel bottom, touching the red line.
This entry has:
・A daily downtrend
・To move higher, it must break through two supports (which draws in many orders)
・No next support exists even on weekly timeframes
・Positive swap points
All these factors make it a potentially excellent swing position if it moves upward.
《30分足》
▼ Entry Pattern ②
Similar to Pattern ①, but this is a pattern where a resistance-to-support change occurs in the channel.
Enter at the red arrow.
Its edge is slightly less than ①, but still a point with good expected value.
《AUDNZD》
▼ Status Check
Looking across currency pairs, AUD tends to be sold here, clearly.
A daily downtrend and a short-term downtrend are confirmed.
Obviously bearish.
AUDNZD cannot draw the highest-advantage parallel line, but it is forming a triangle range squeezed by two channels.
《1H》
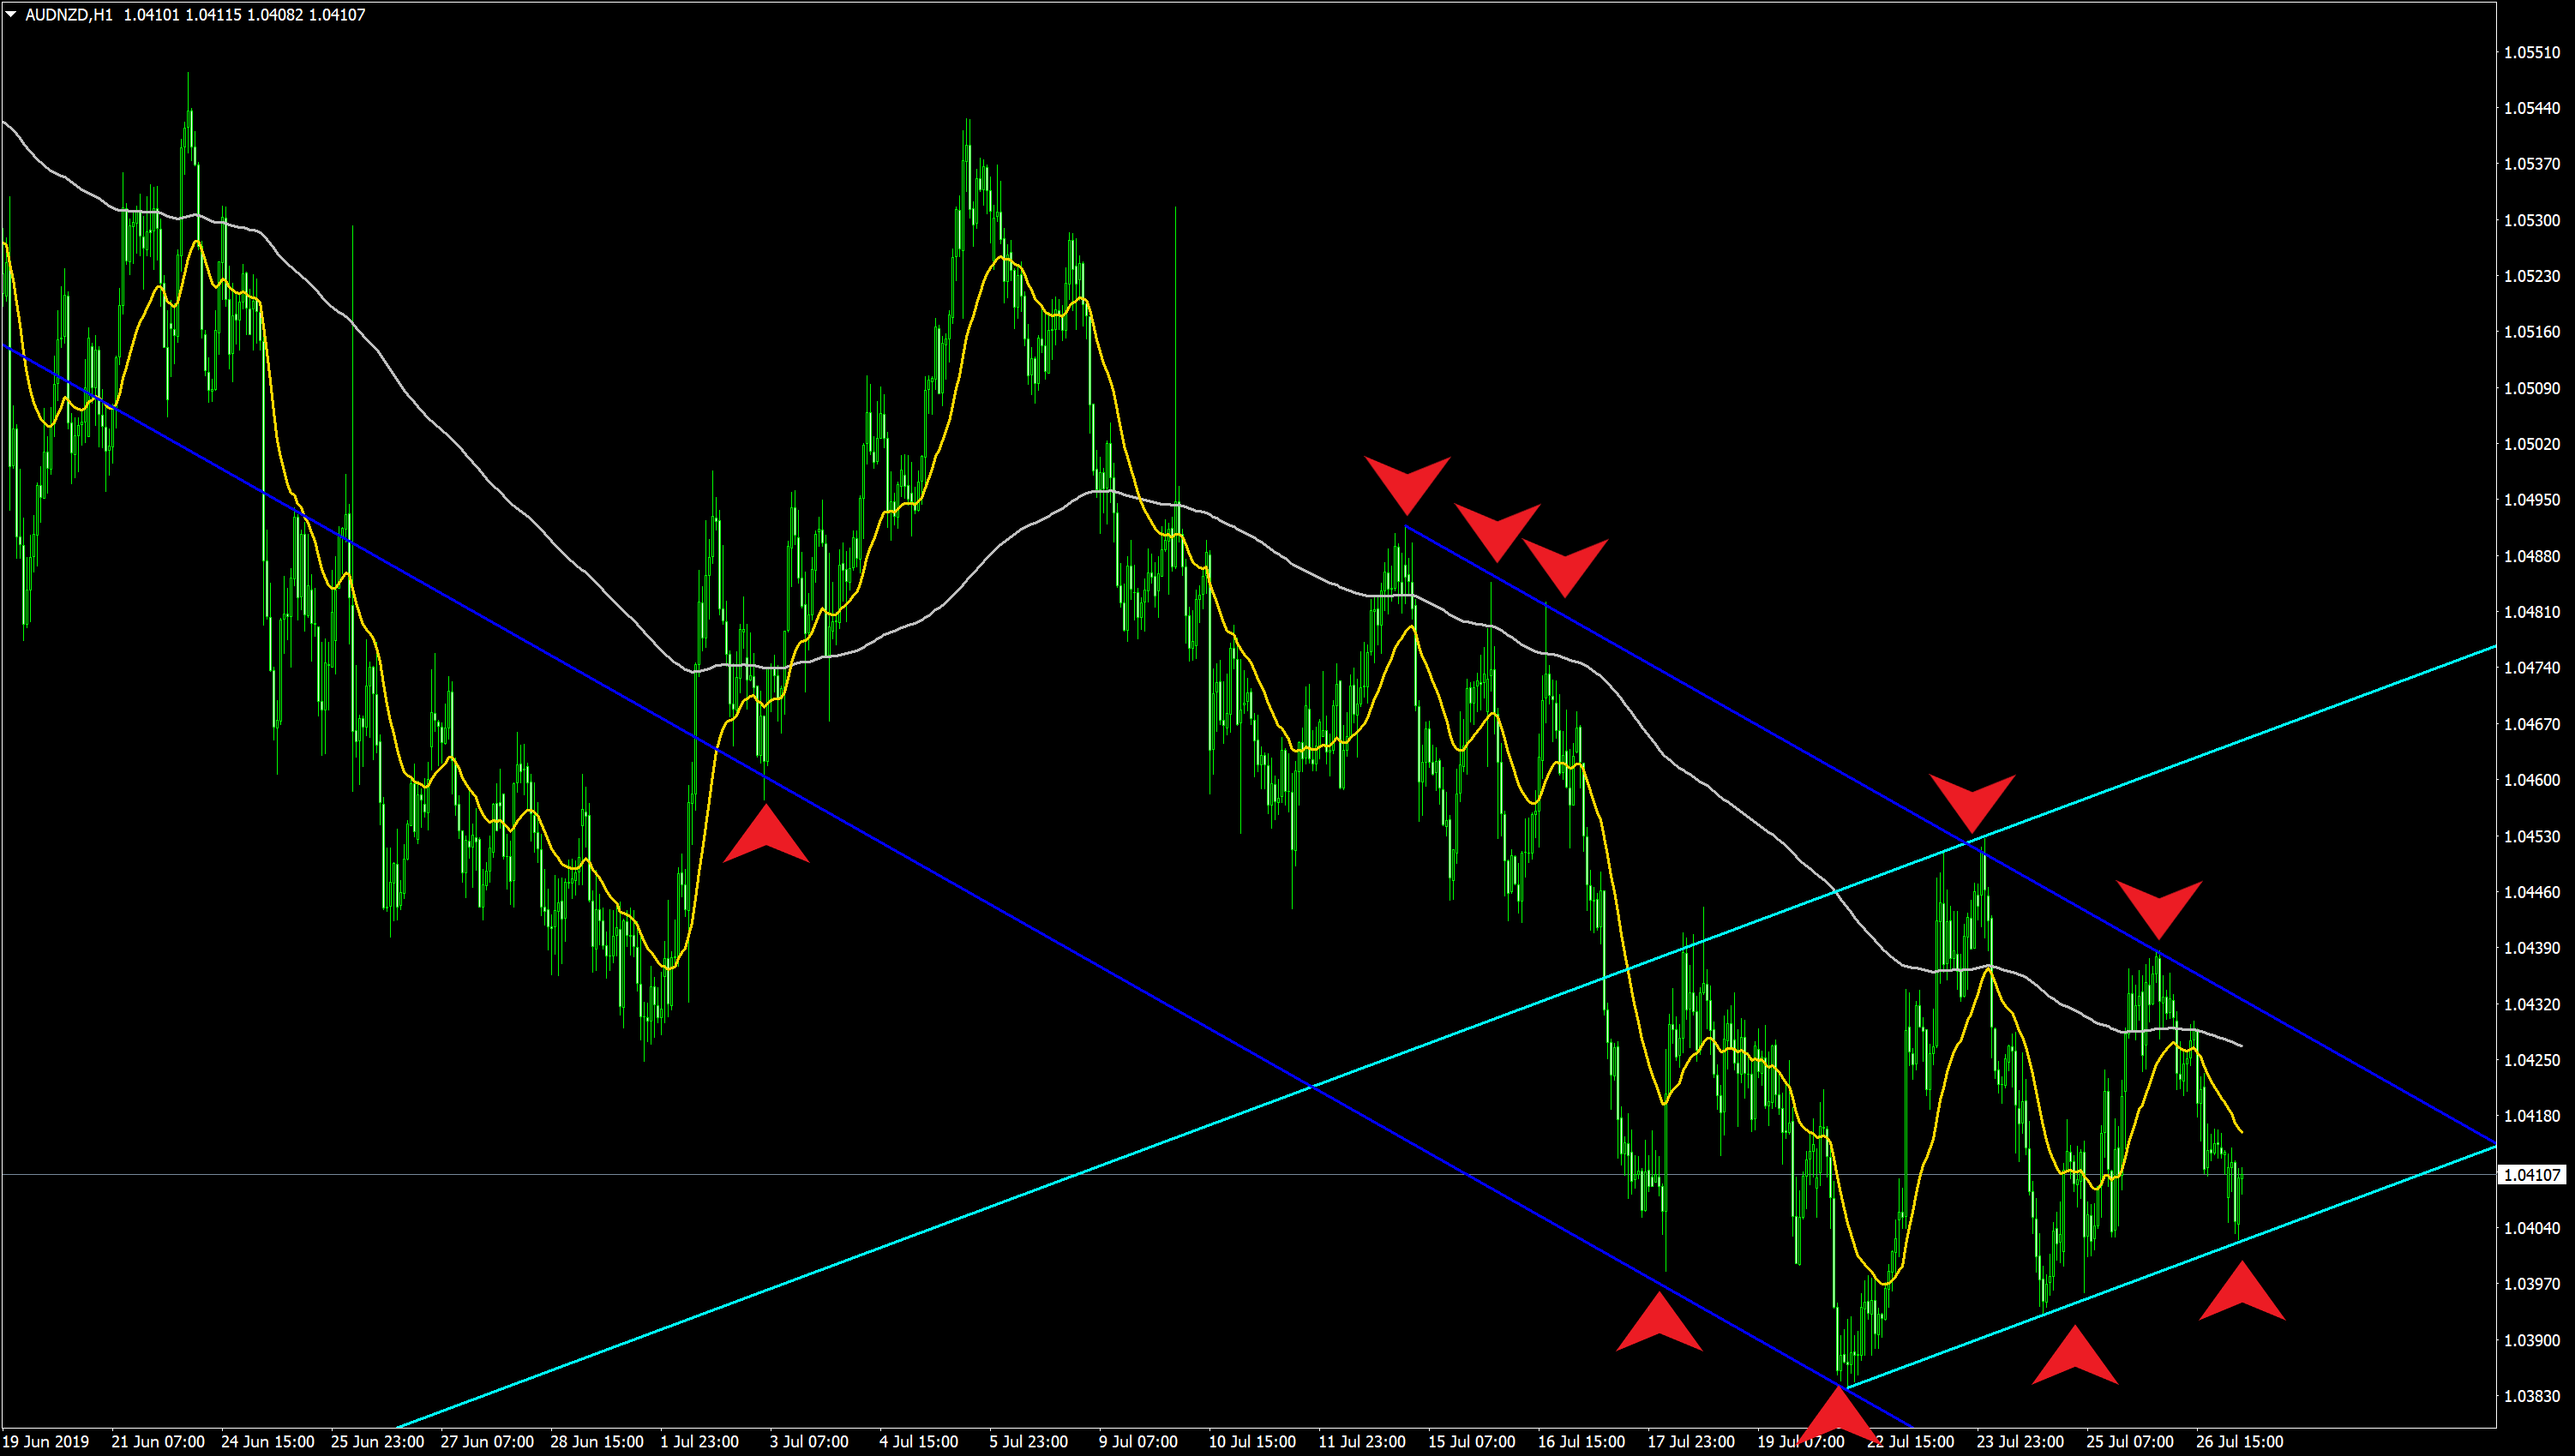
▼ Entry Pattern ①
A pattern of selling at the upper bound of the down channel.
Enter at the red arrow.
Given the downtrend and repeated rebounds of this down channel, the success rate is relatively high.
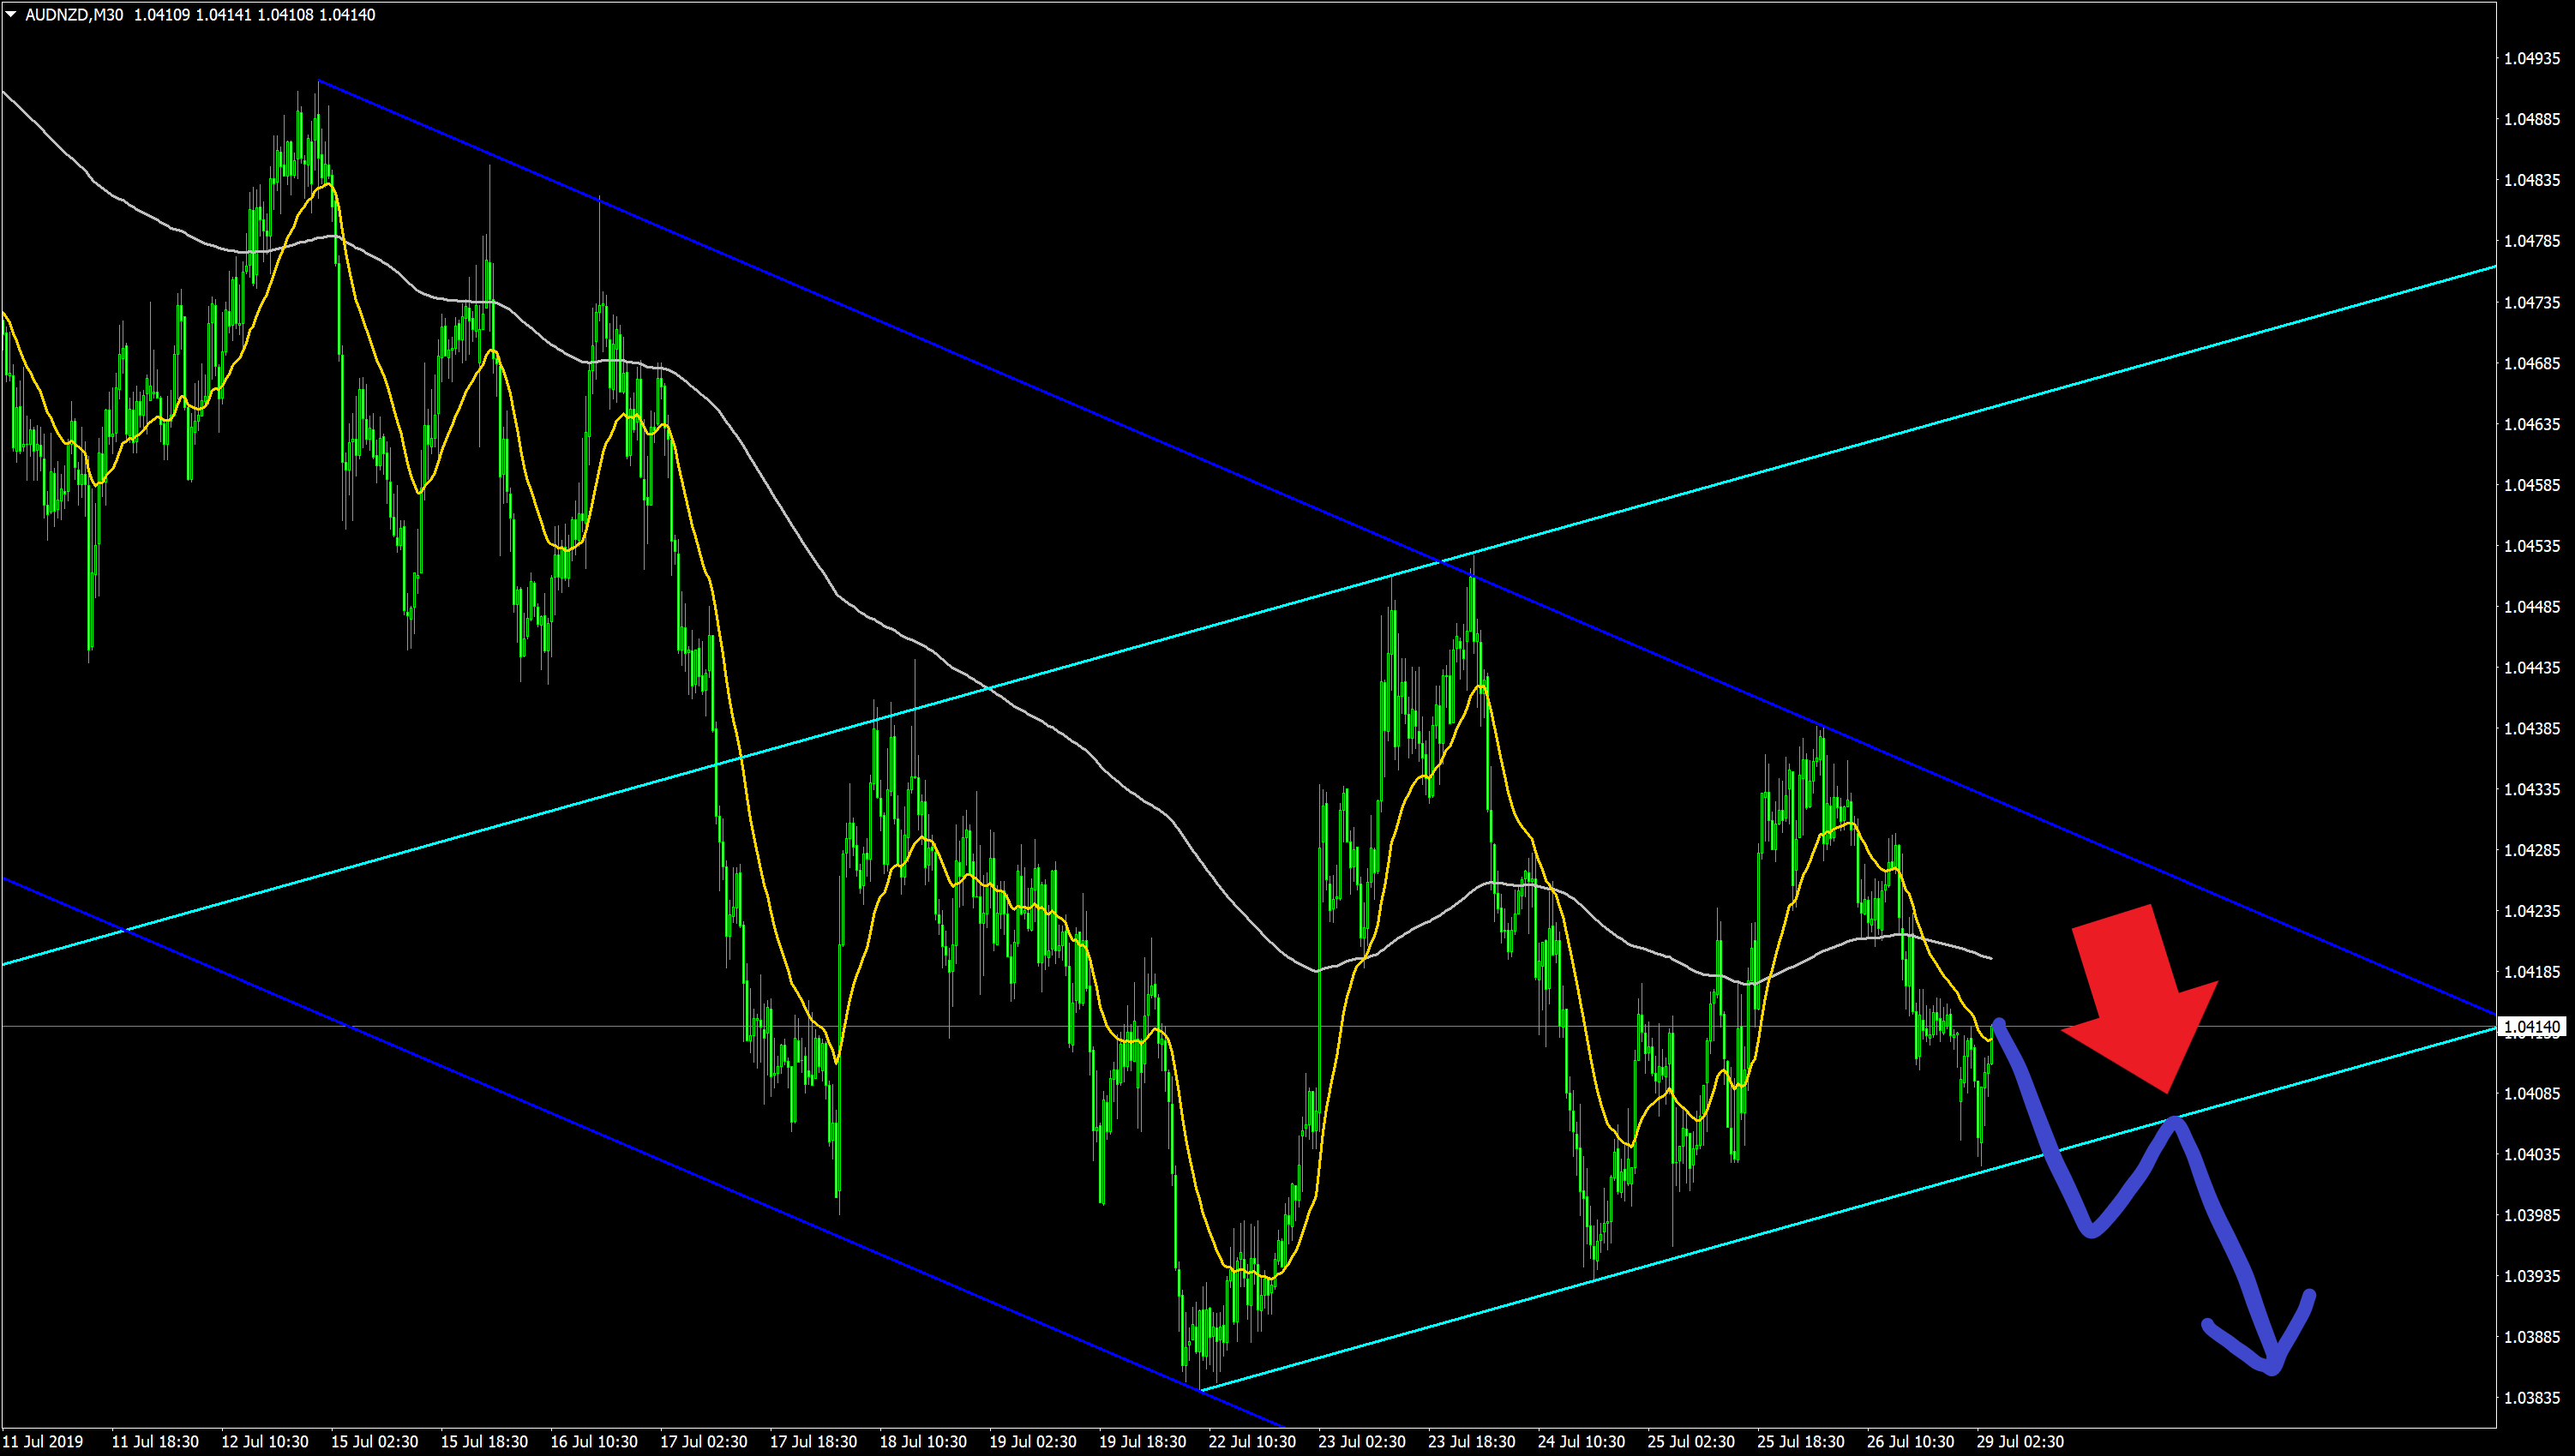
《30分足》
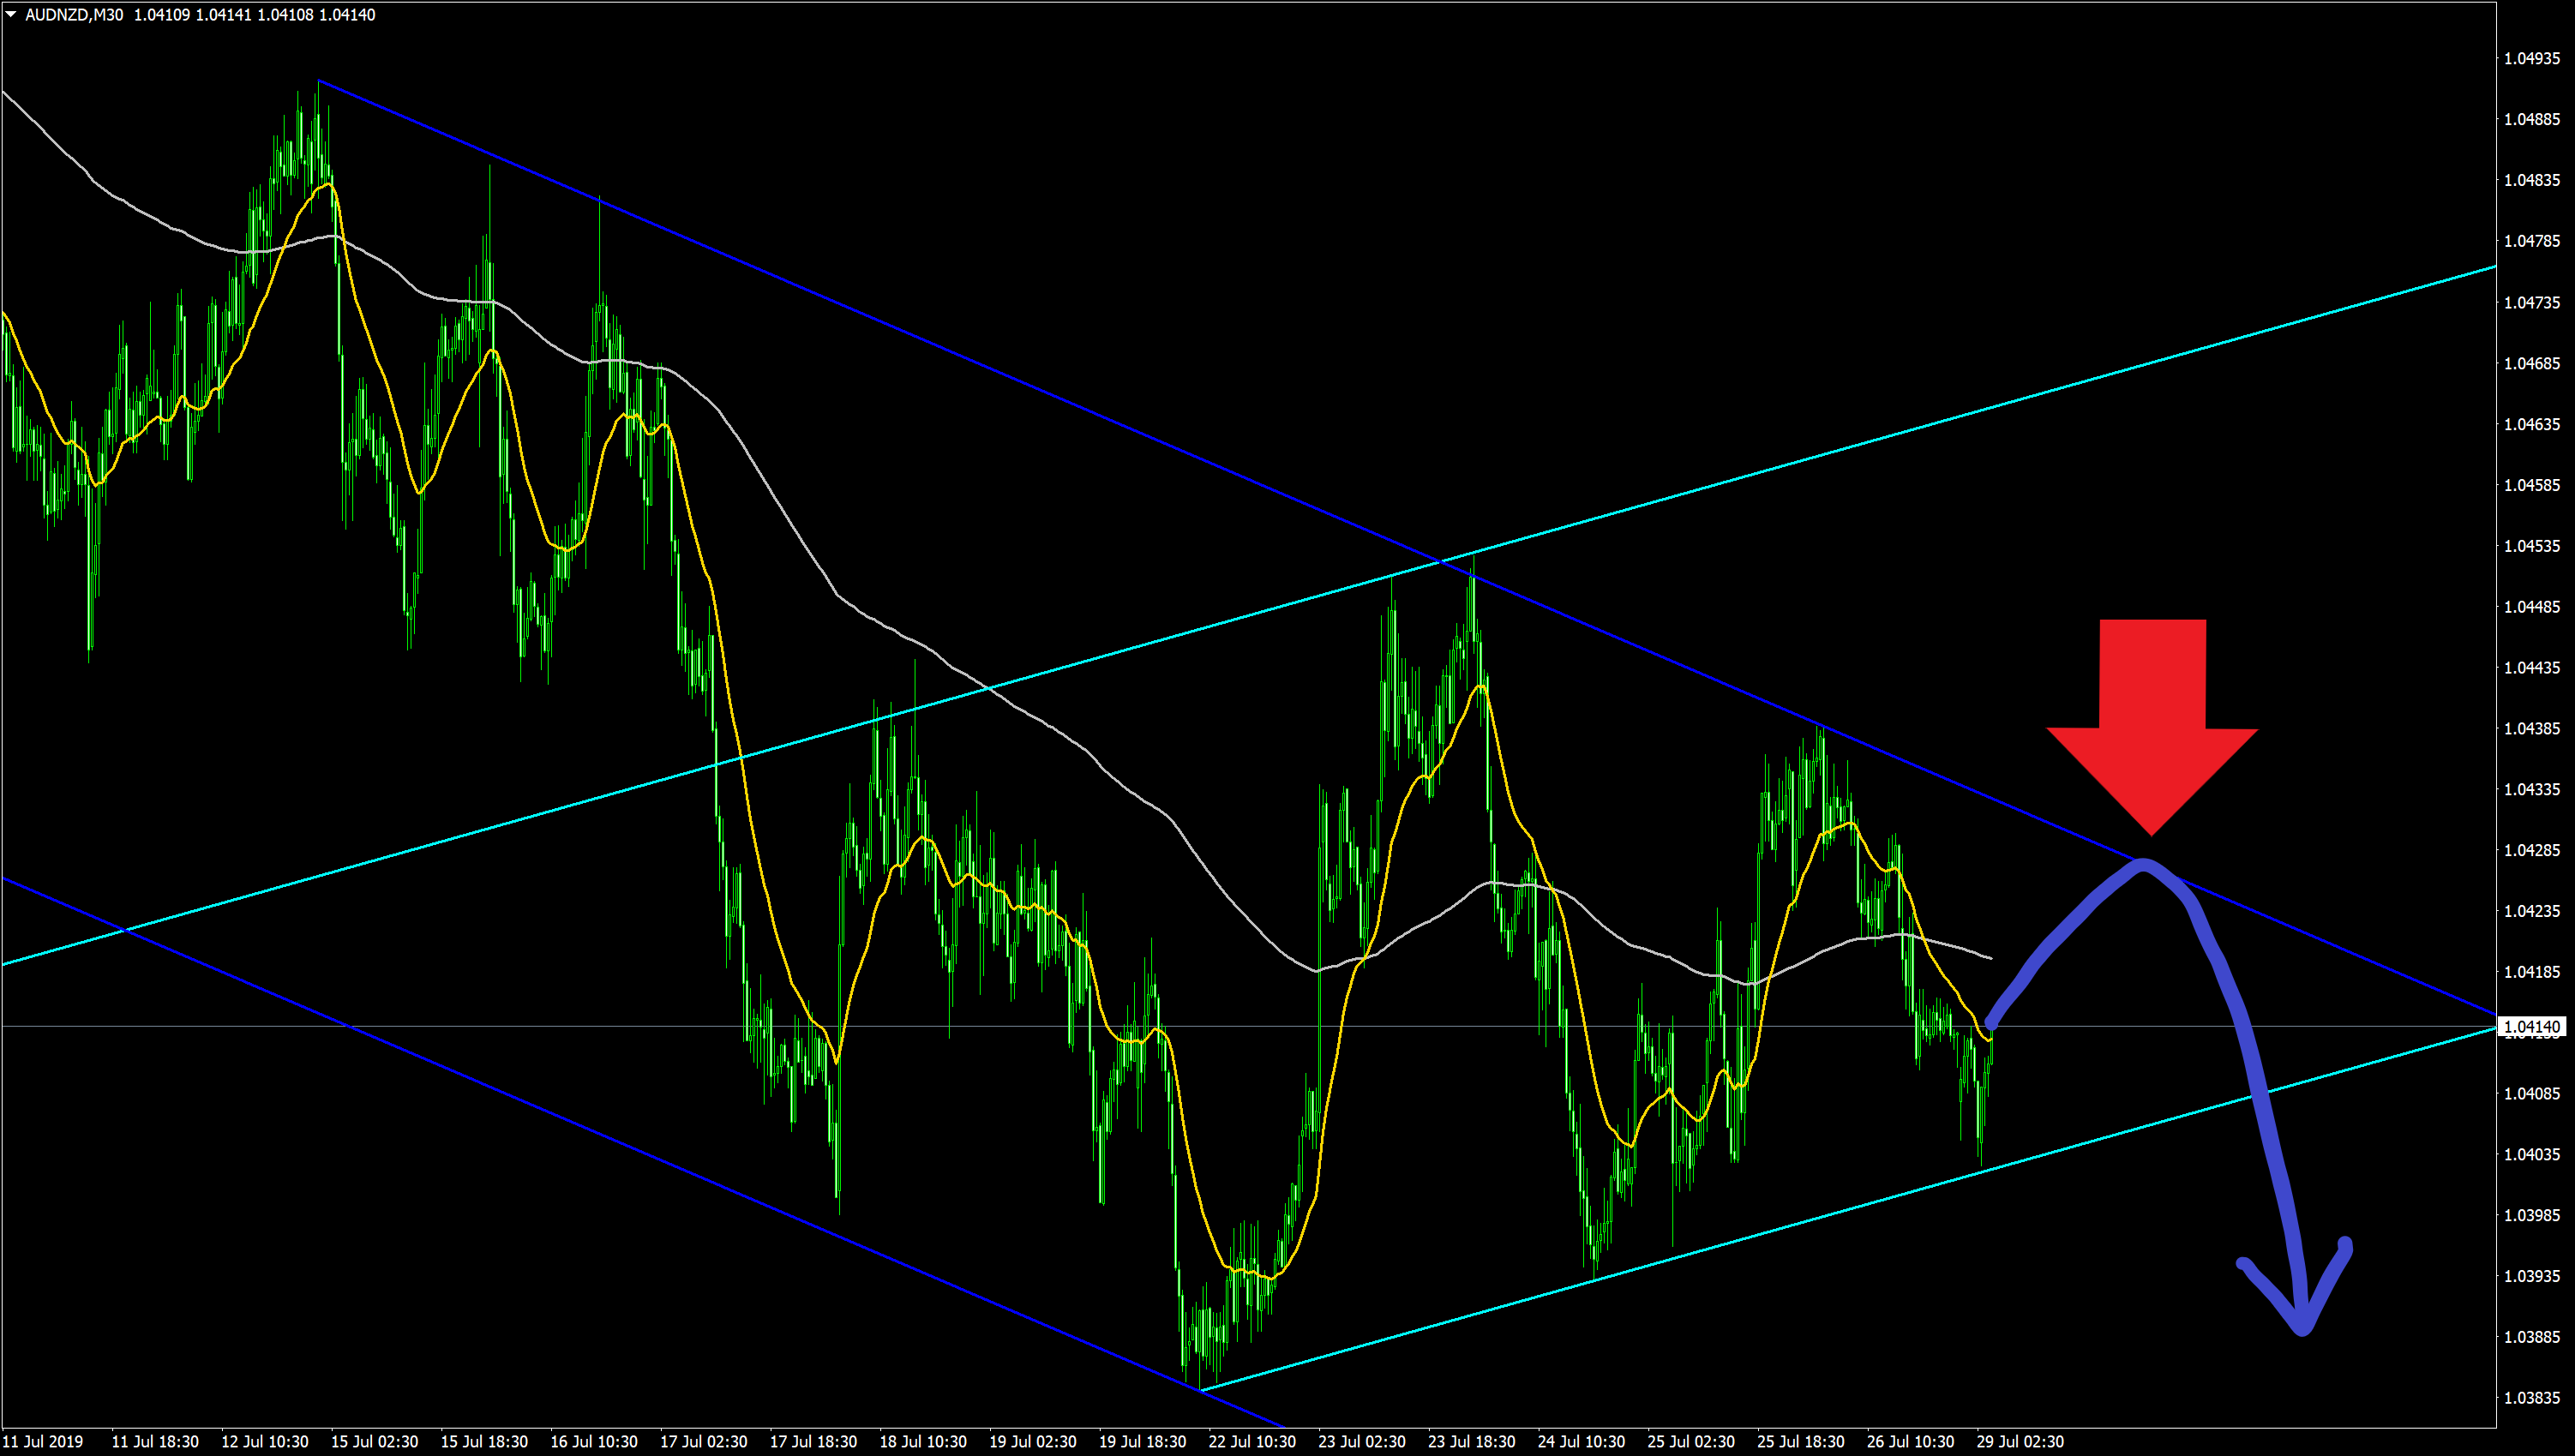
▼ Entry Pattern ②
This is a pattern of breaking below the channel lower bound and selling on the pullback.
By its nature, both Entry ① and ② can occur on the same move.
《30分足》
That is all for today.
For take profit, stop loss, skipping entries, and efficient time-saving methods, I plan to explain more as more market enthusiasts join in.
If there are any unclear points,
Please ask questions there.
If you ask, I will explain, so feel free to chat.