

Future market outlook, strategies and opportunity currencies (7/25~)
Hello, this is Onepiece Trade (@onepipst)
From 7/25 onward, I’d like to outline the market outlook, plan strategies, and search for entry points
I draw horizontal lines and trend lines based on the daily chart
I also tweet about profits and other useful things, so please followTwitter.
- USD/JPY
- EUR/USD
- EUR/JPY
- GBP/USD
- GBP/JPY
- Afterword
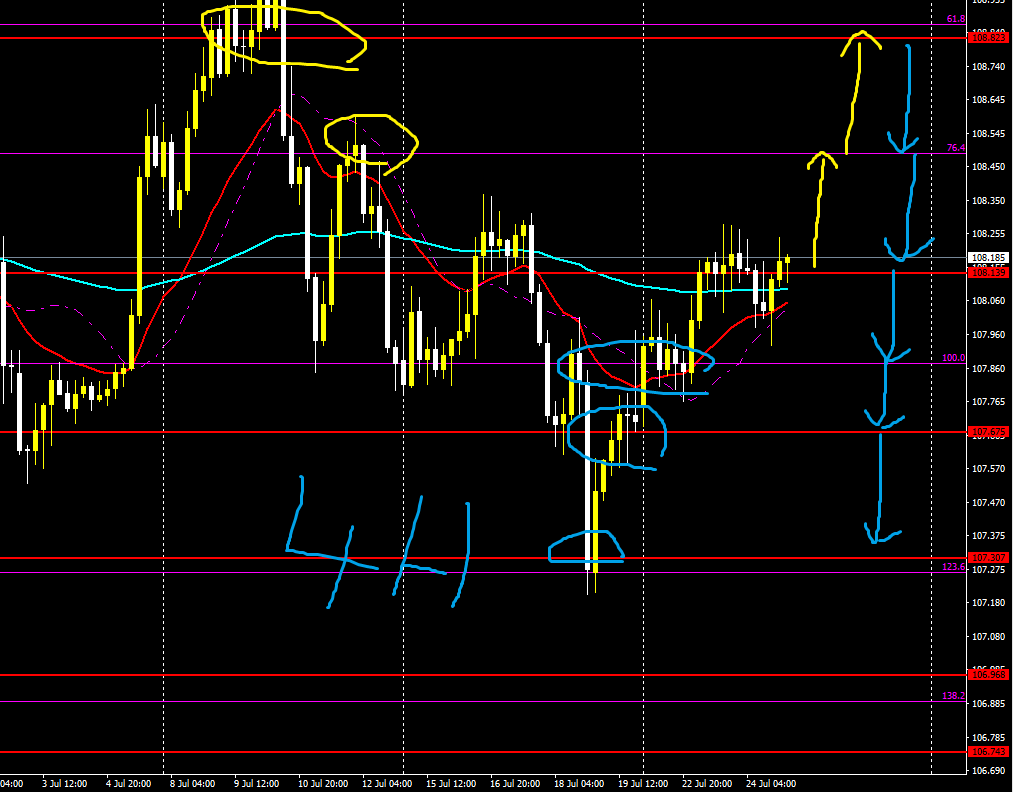
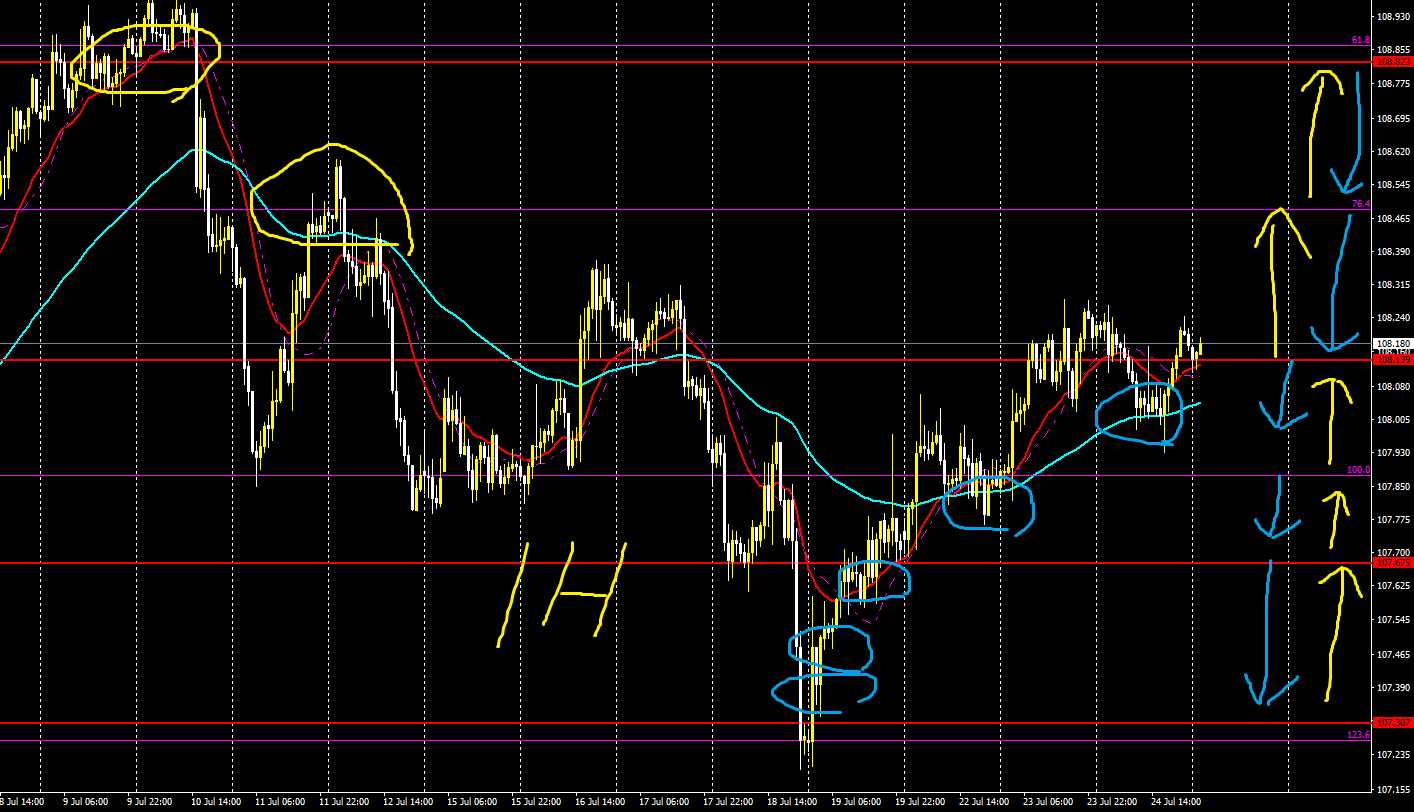
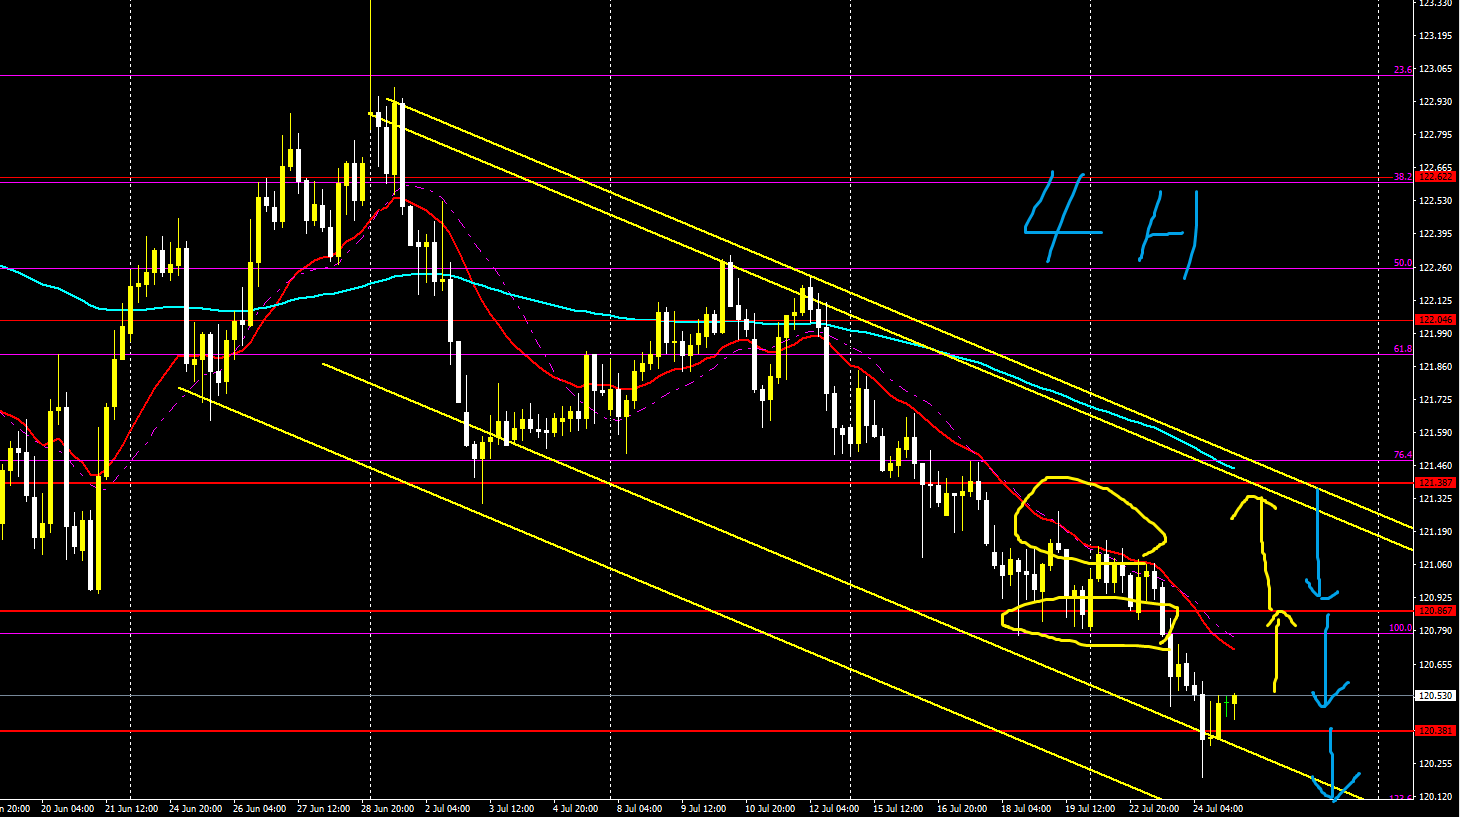
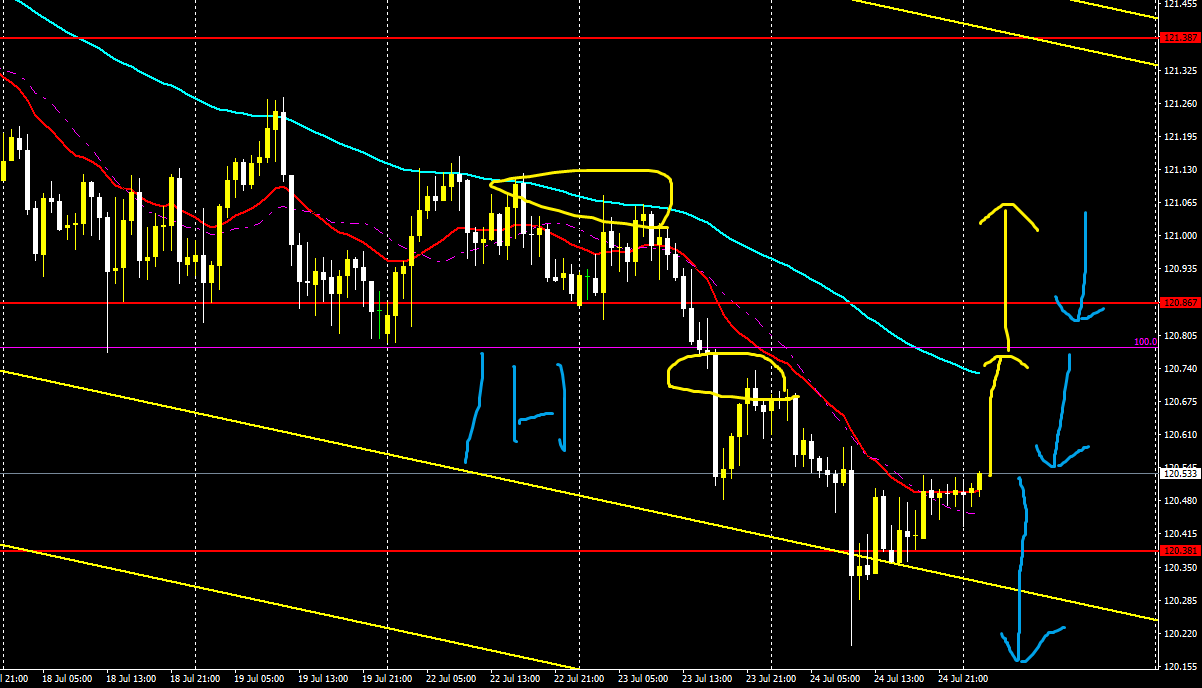
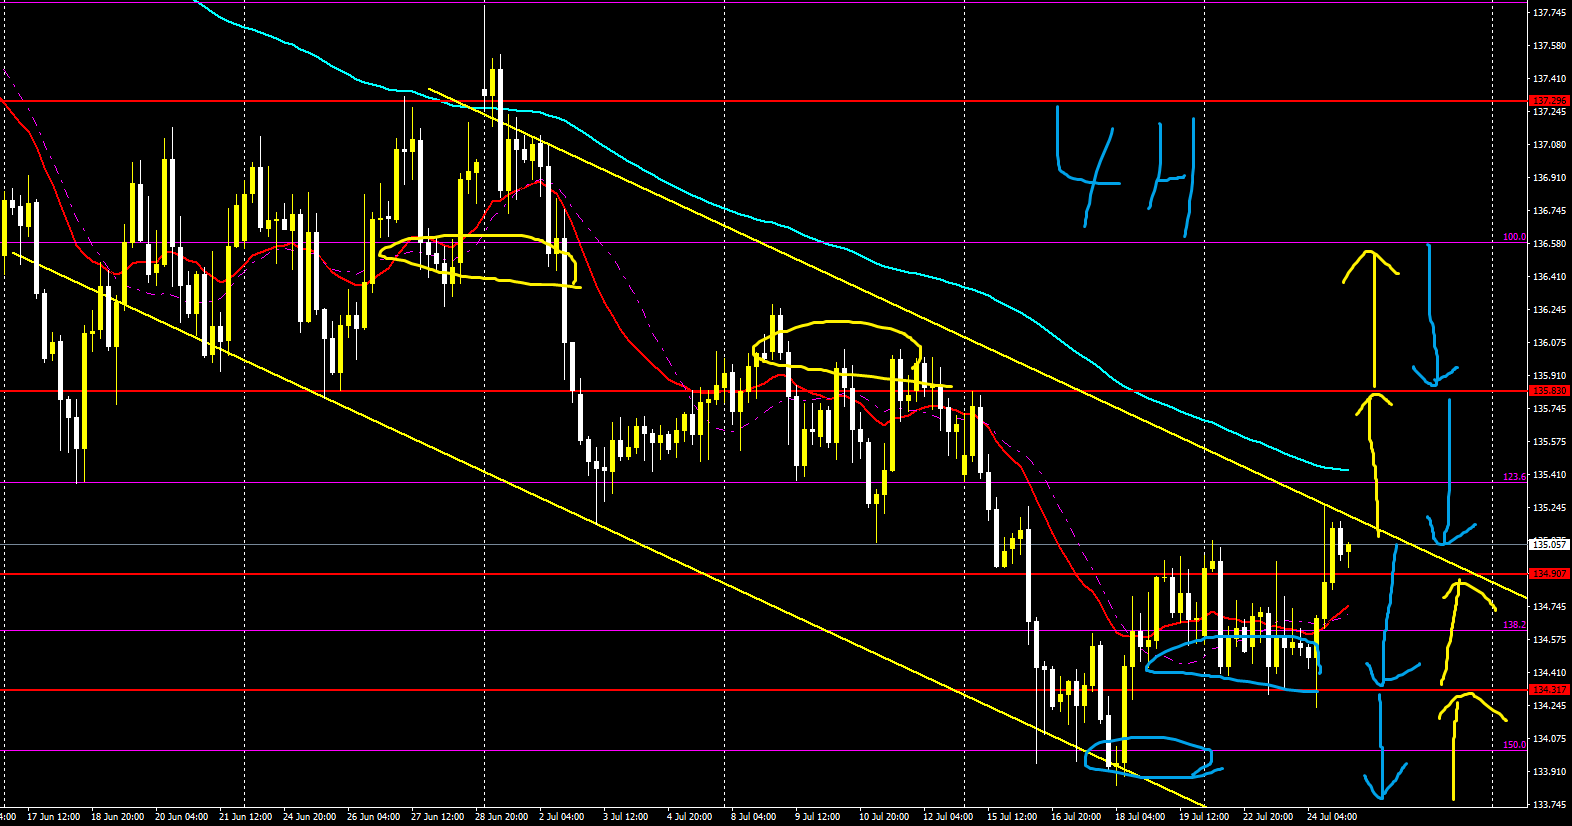
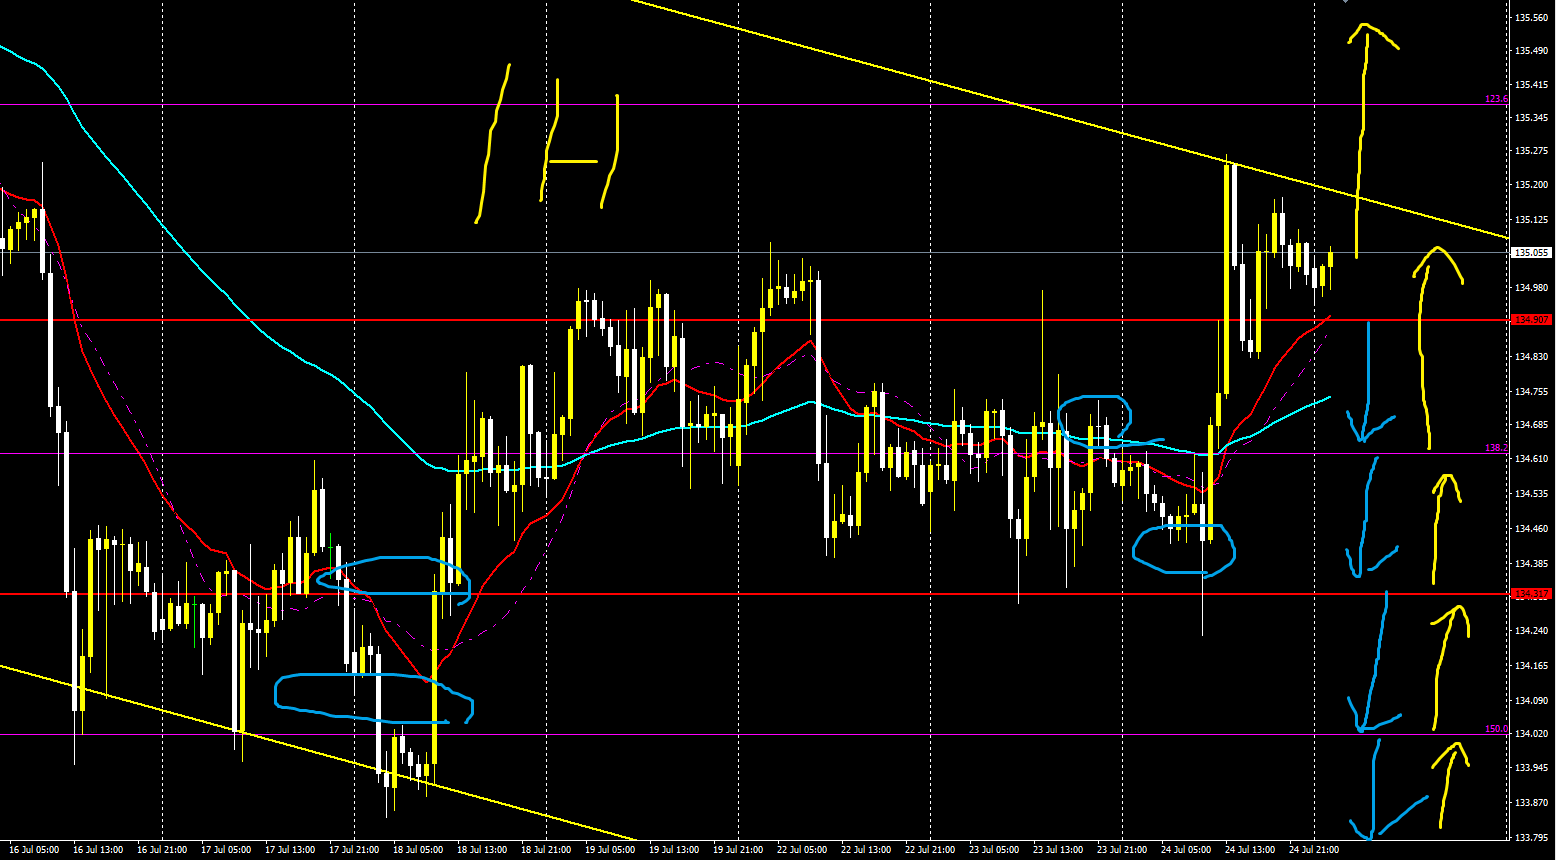
【USD/JPY】
Trading difficulty B-
Long-term outlook slightly down, short-term up
In a range
The focus is whether it can break the recent high
If held at the high, consider selling
4-hour
1-hour
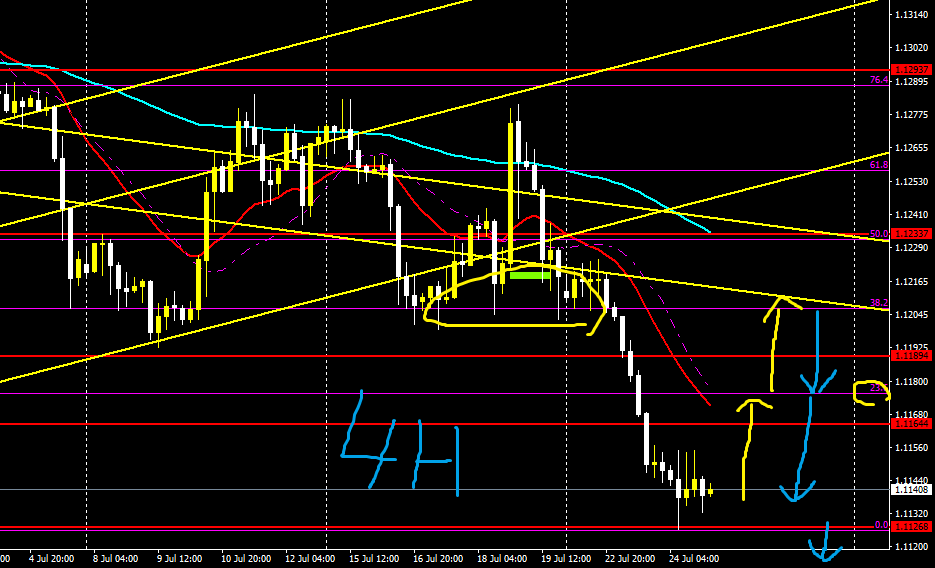
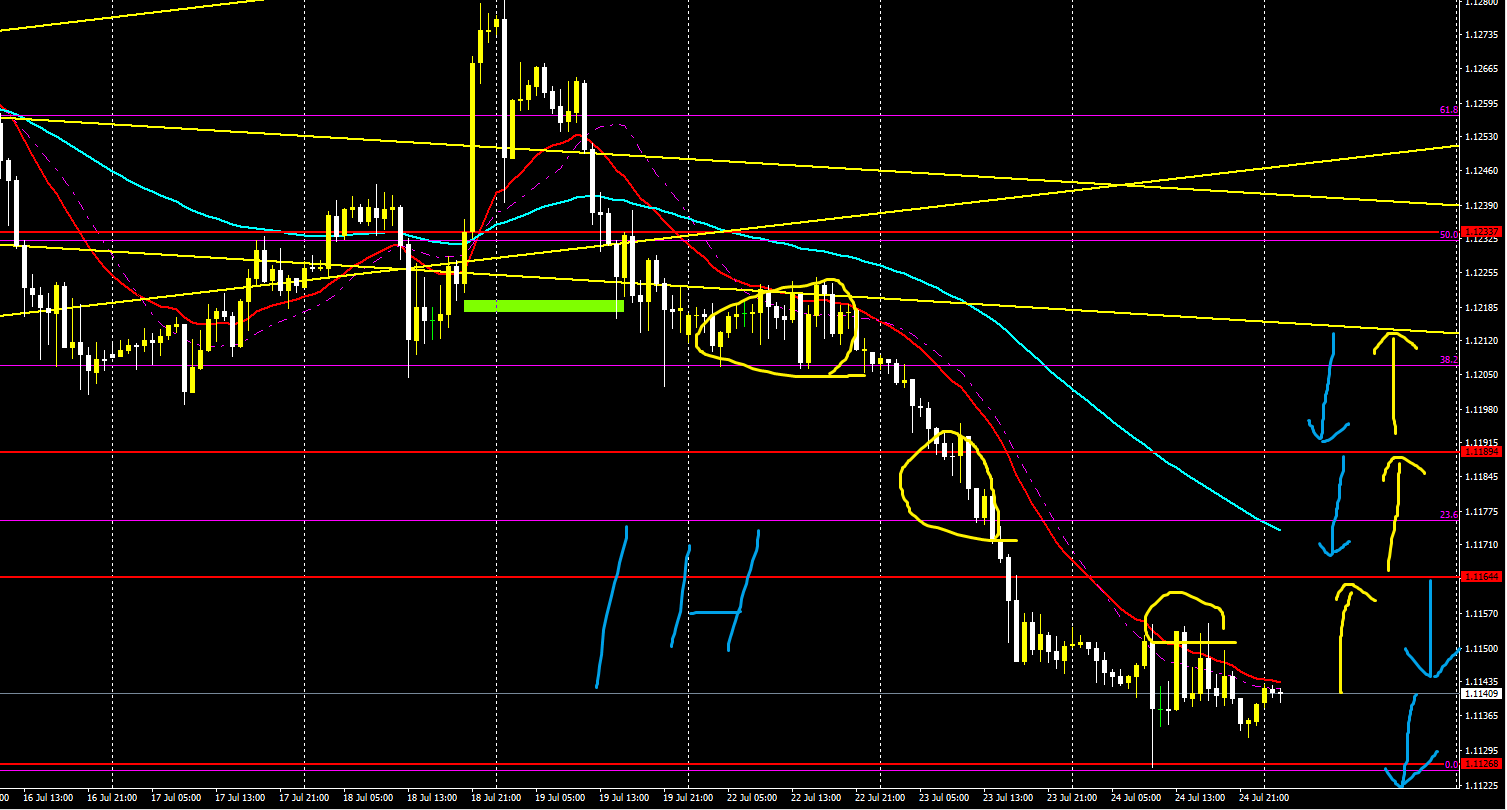
【EUR/USD】
Trading difficulty A-
Long-term outlook down, short-term also down
The price is near a daily-support band
A rebound may occur, so counter-trend buys up to Fibonacci 23 or 38 are possible
From there, consider selling on the rebound or a break below the low
4-hour
1-hour
EUR/JPY】
Trading difficulty A-
Long-term outlook down, short-term also down
A pullback before selling is safer
Thus, selling back from Fibonacci 100 is good
Counter-trend buying may also be good
If there is a strong buying, buy up to Fibonacci 76
4-hour
1-hour
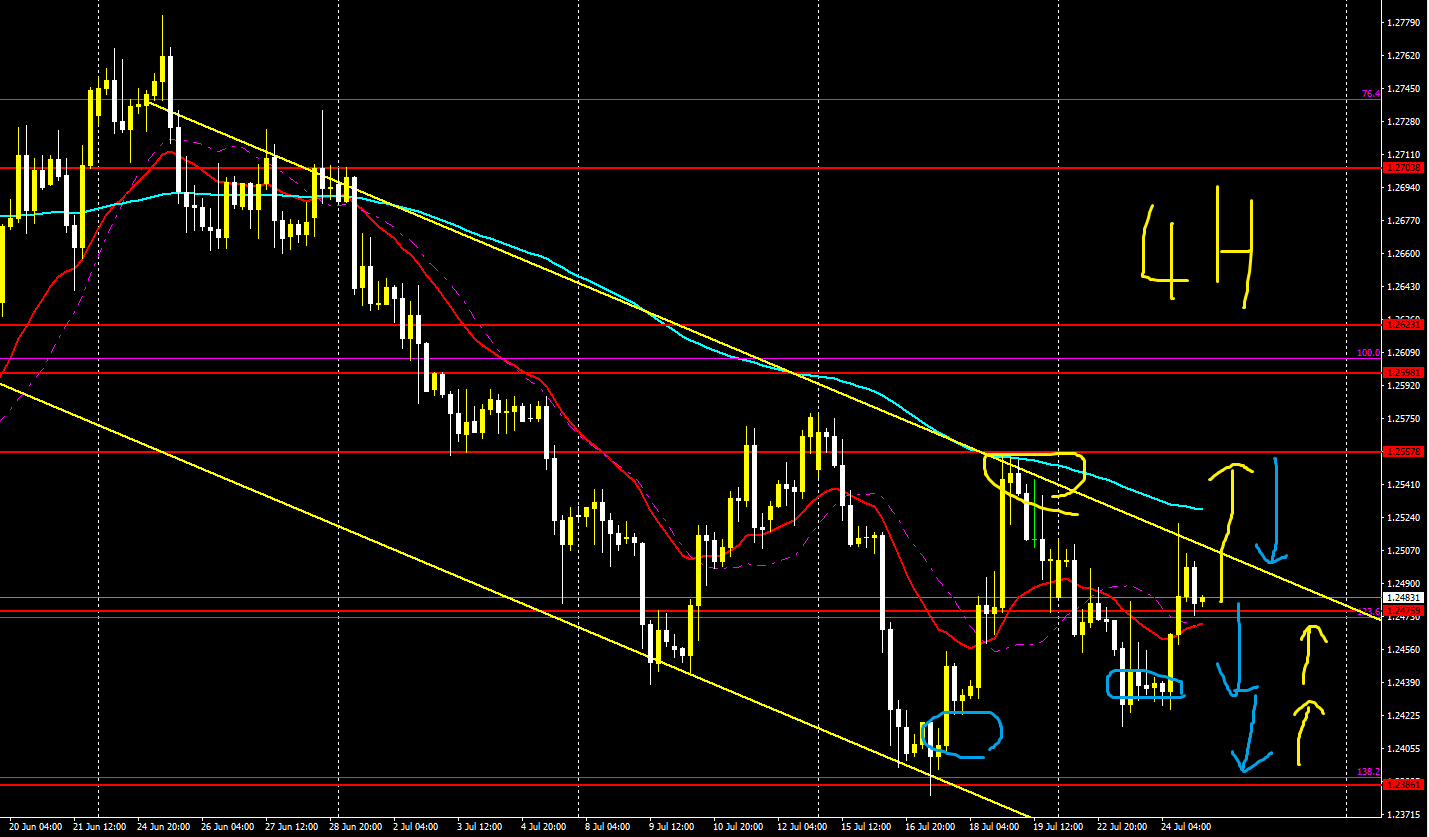
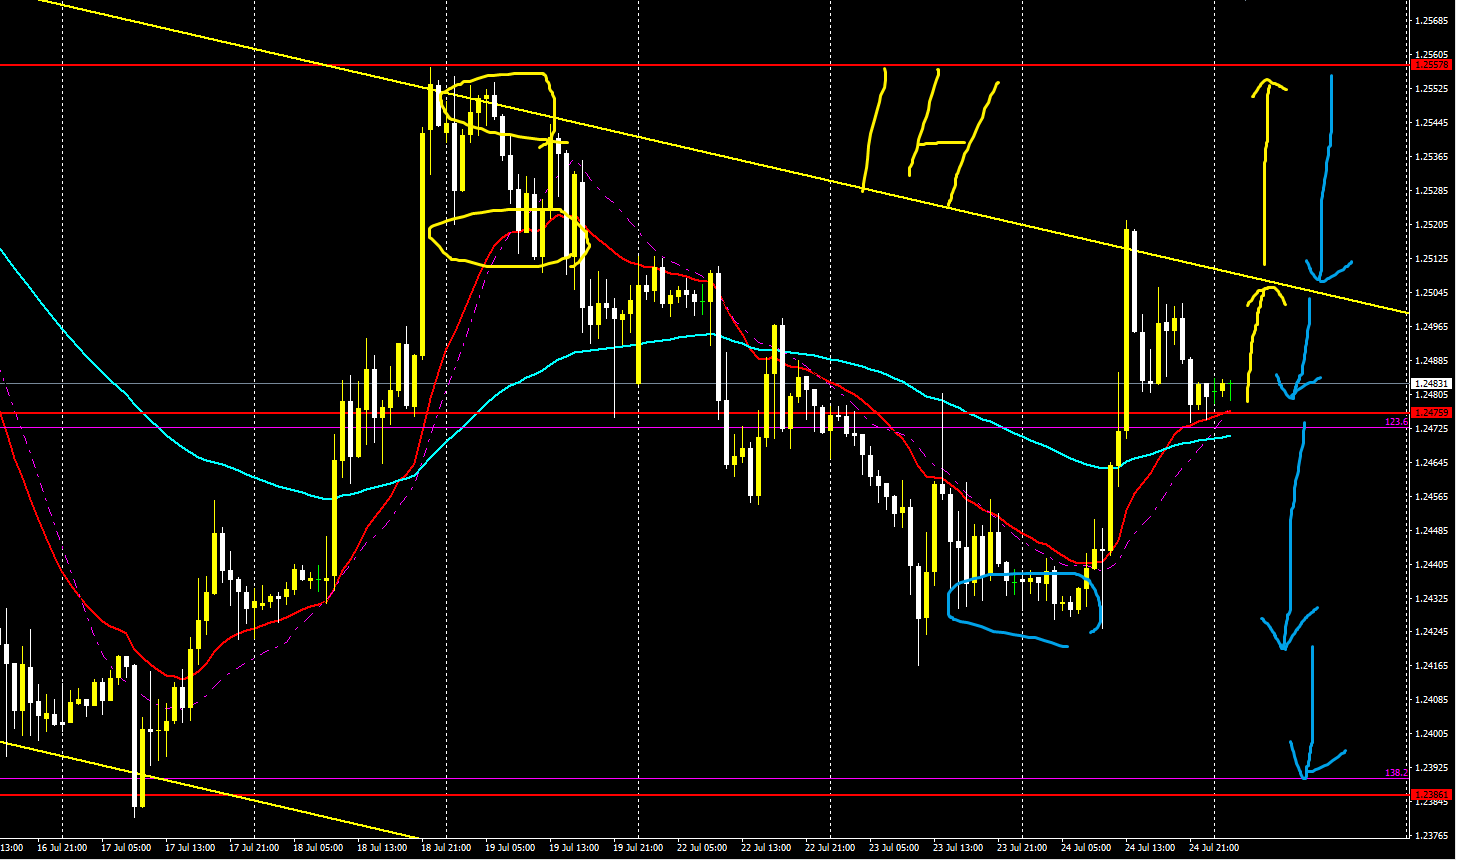
【GBP/USD】
Trading difficulty A-
Long-term outlook down, short-term also down
Proceed with a rebound selling strategy
For now, consider selling near Fibonacci 123
It’s safer after breaking below the MA
I’d also like to consider counter-trend buying, so follow the direction of the yellow arrow or a related rate and buy
4-hour
1-hour
【GBP/JPY】
Trading difficulty A-
Long-term outlook down, short-term also down
A range-style environment for selling on rebounds or breaks
Trade according to the trend
Since the previous market can become range-bound, in that case sell on rebounds with counter-trend buys
Draw an ascending line, and if it breaks, sell
Or perhaps selling after a short-term MA breaks below
4-hour
1-hour
【Afterword】
The arrows drawn in the image point to the favorable directions
Yellow indicates upward direction
Light blue indicates downward direction
These arrows indicate relative advantage, not that the price will definitely react or reverse at that level
However, because arrows are drawn near key levels, please use them as reference for trading
The arrows may become profit-taking or stop-loss points
And please treat lines and Fibonacci as references for profit-taking, stop-loss, and entry points as well
Every week, the market outlook and strategy broadcast on YouTube generally align
What matters is how you apply that to trading and entries
When the market strategy was correct, when it was not, your trading methods and thinking may differ
And again, please consider entries as a separate matter


