

Future market outlook, strategies and opportunity currencies (from 7/18)
Hello, this is Onepist Trading@onepipst)
From 7/18, I will outline market forecasts, develop strategies, and look for entry points
Horizontal lines and trendlines are drawn based on the daily chart
I also tweet about profits and other useful things,so pleasefollow Twitter.
Table of contents
- Dollar/Yen (USD/JPY)
- Euro/Dollar (EUR/USD)
- Euro/Yen (EUR/JPY)
- Pound/Dollar (GBP/USD)
- Pound/Yen (GBP/JPY)
- Postscript
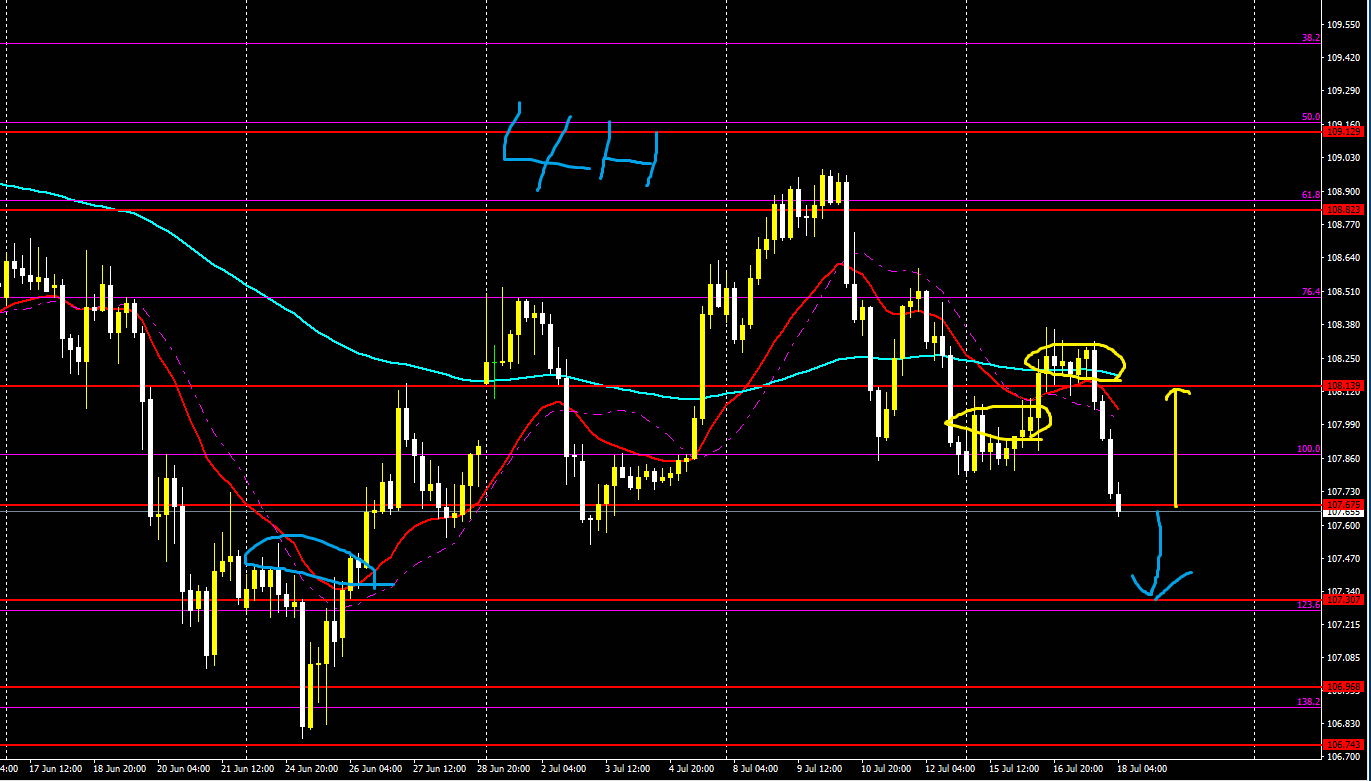
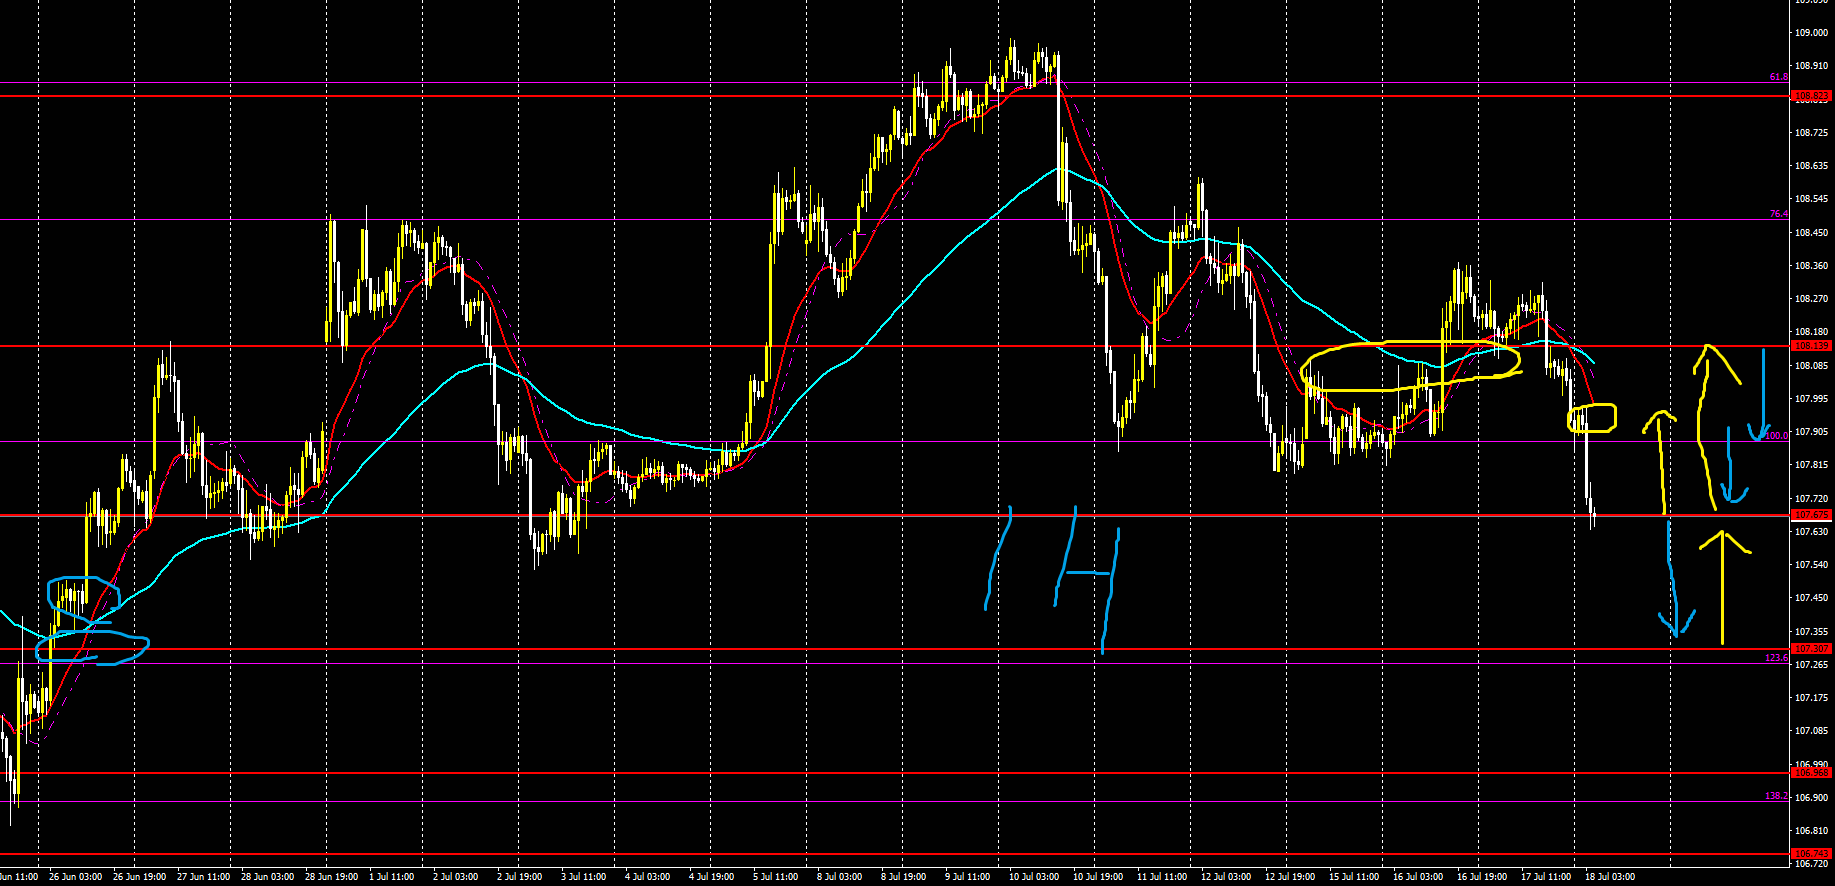
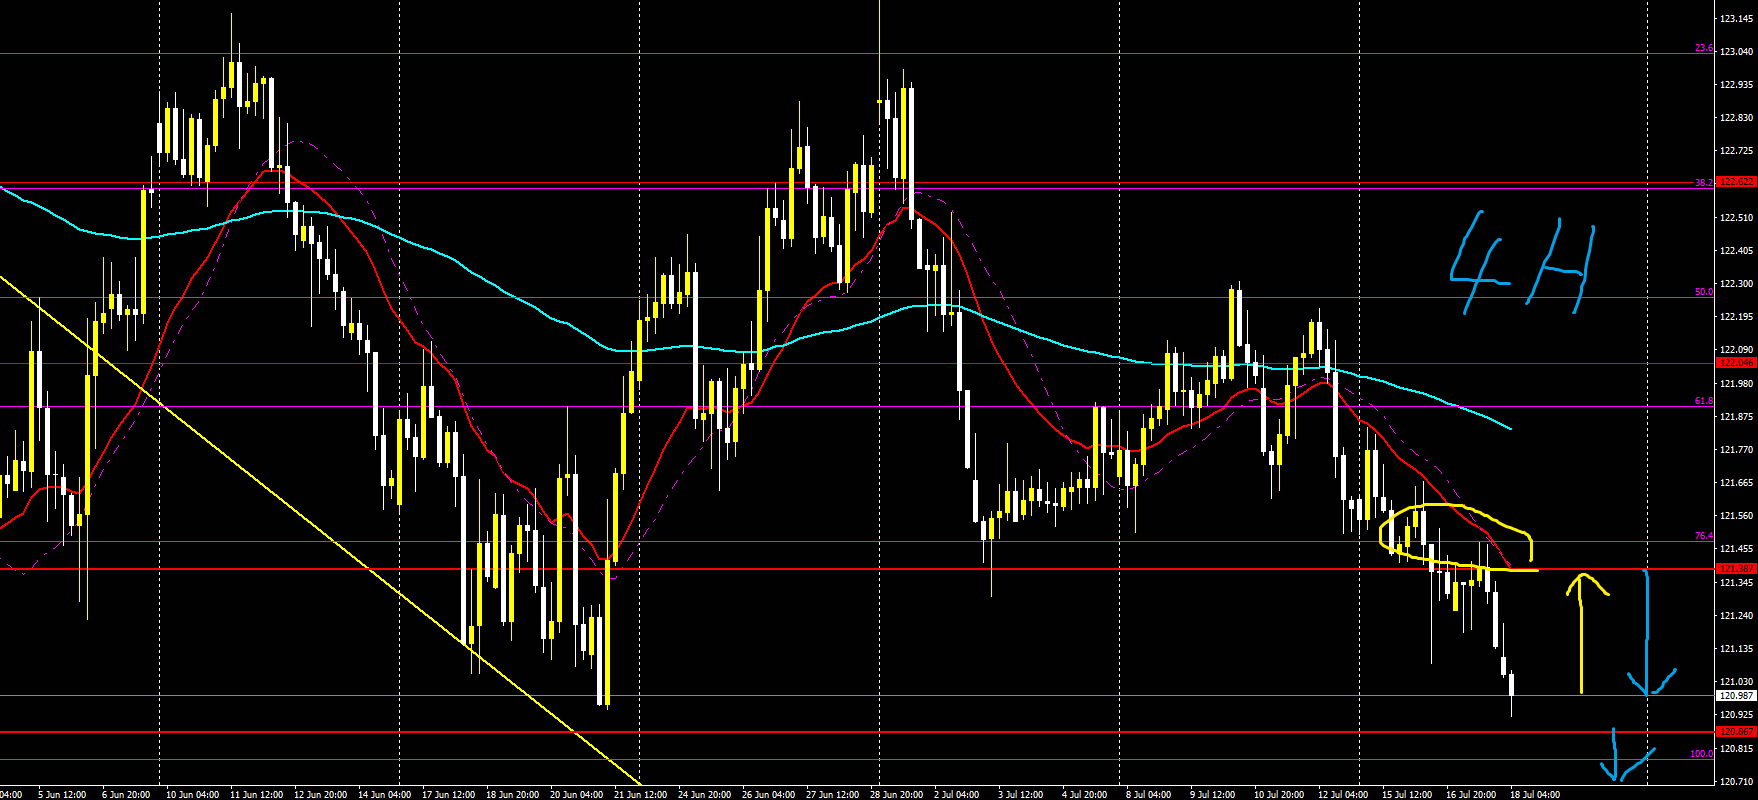
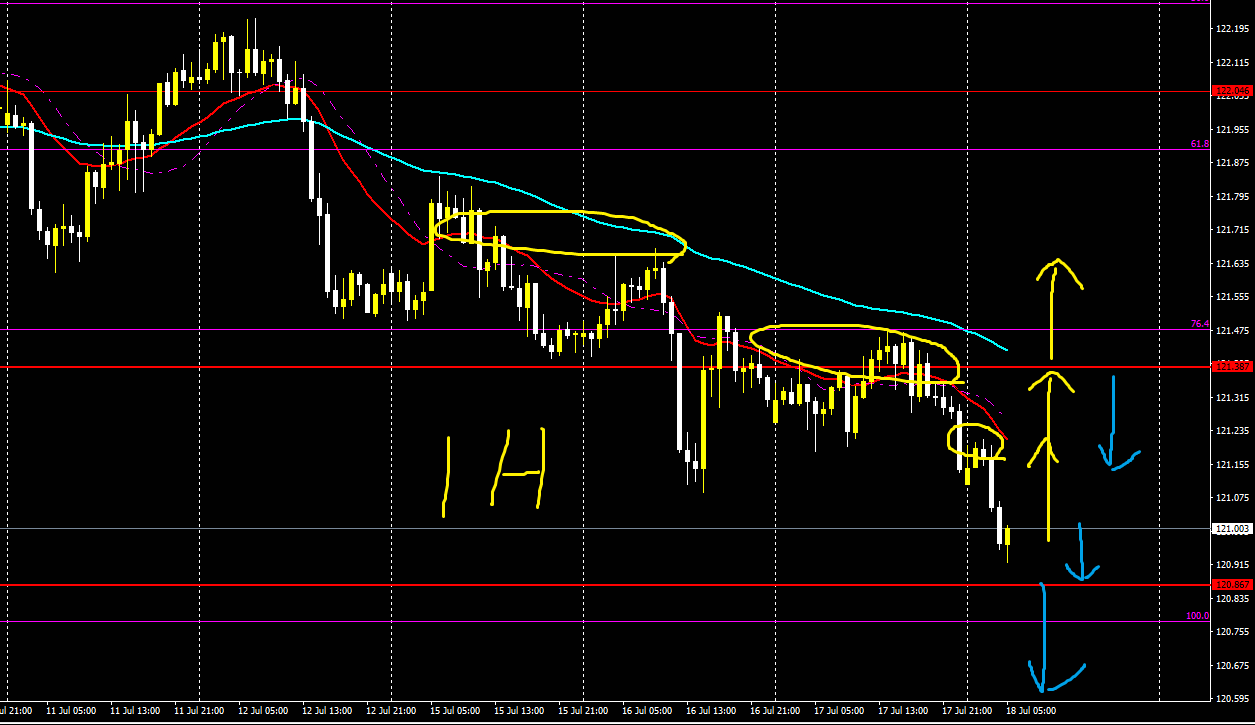
【Dollar/Yen (USDJPY)】
Trading difficulty B–
Long-term outlook is up, short-term also down
In a range
There is a high likelihood of buying entry for now
Buy up to around the 108.1 line
If you break above that, buy up to Fibonacci 76
If a pullback occurs, plan to sell
If there is no buying and it just sells off, aim for around Fibonacci 123
4 hours
1 hour
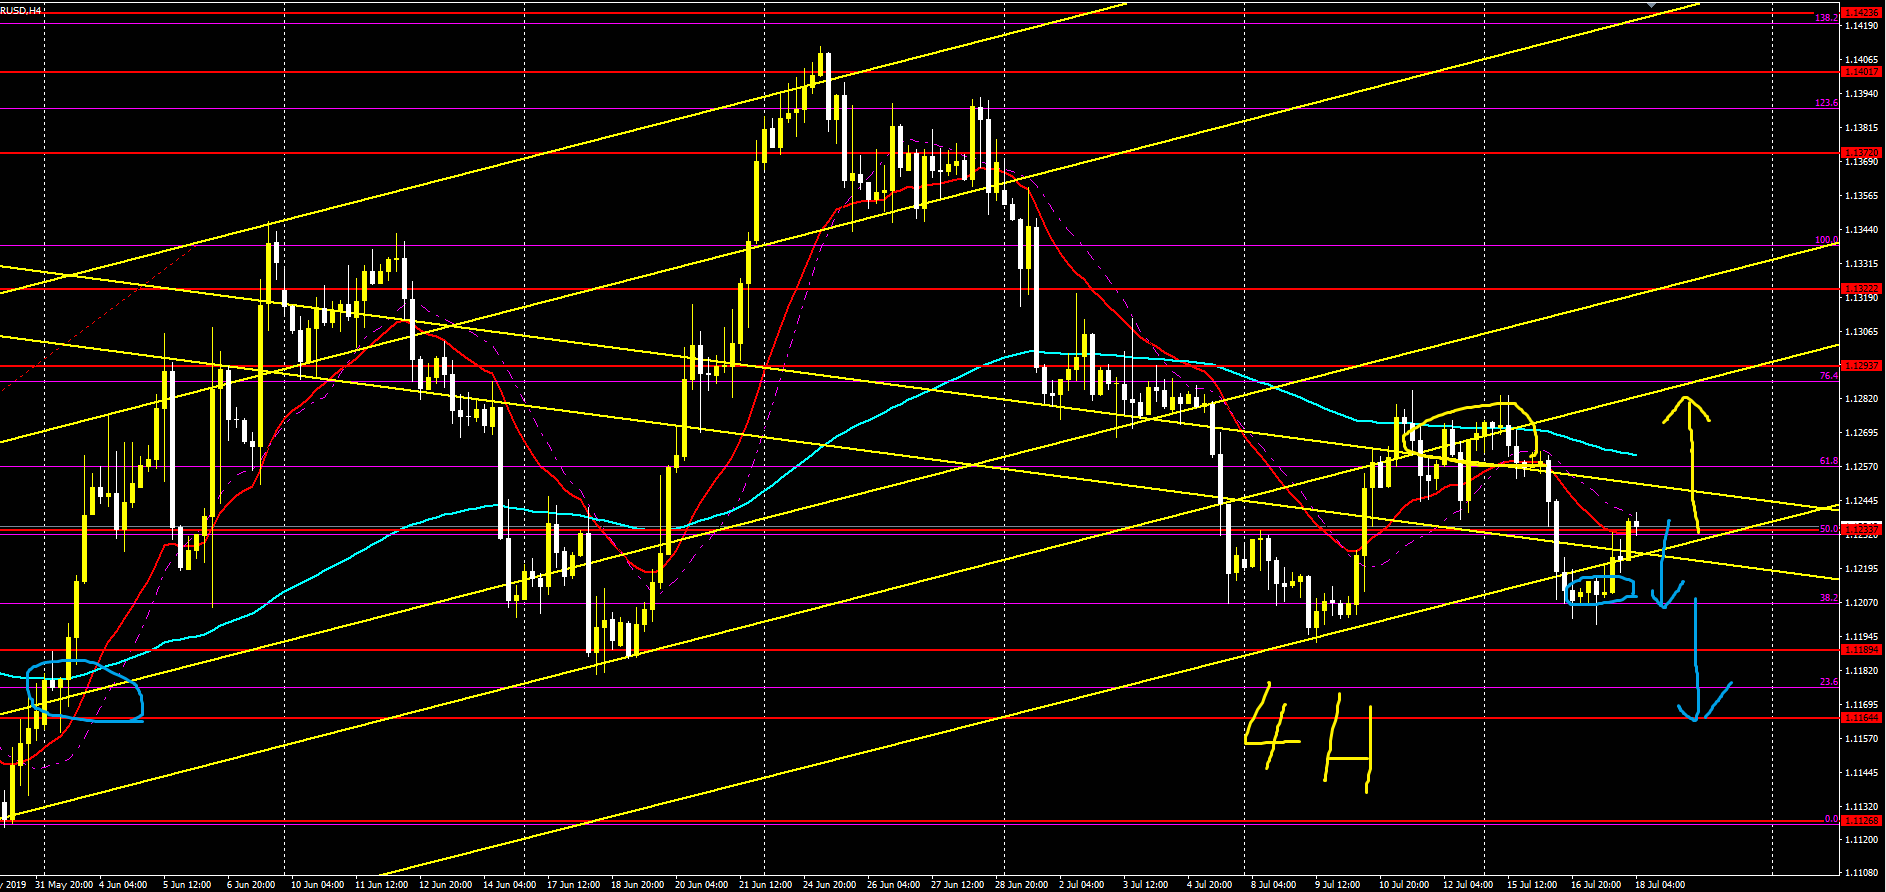
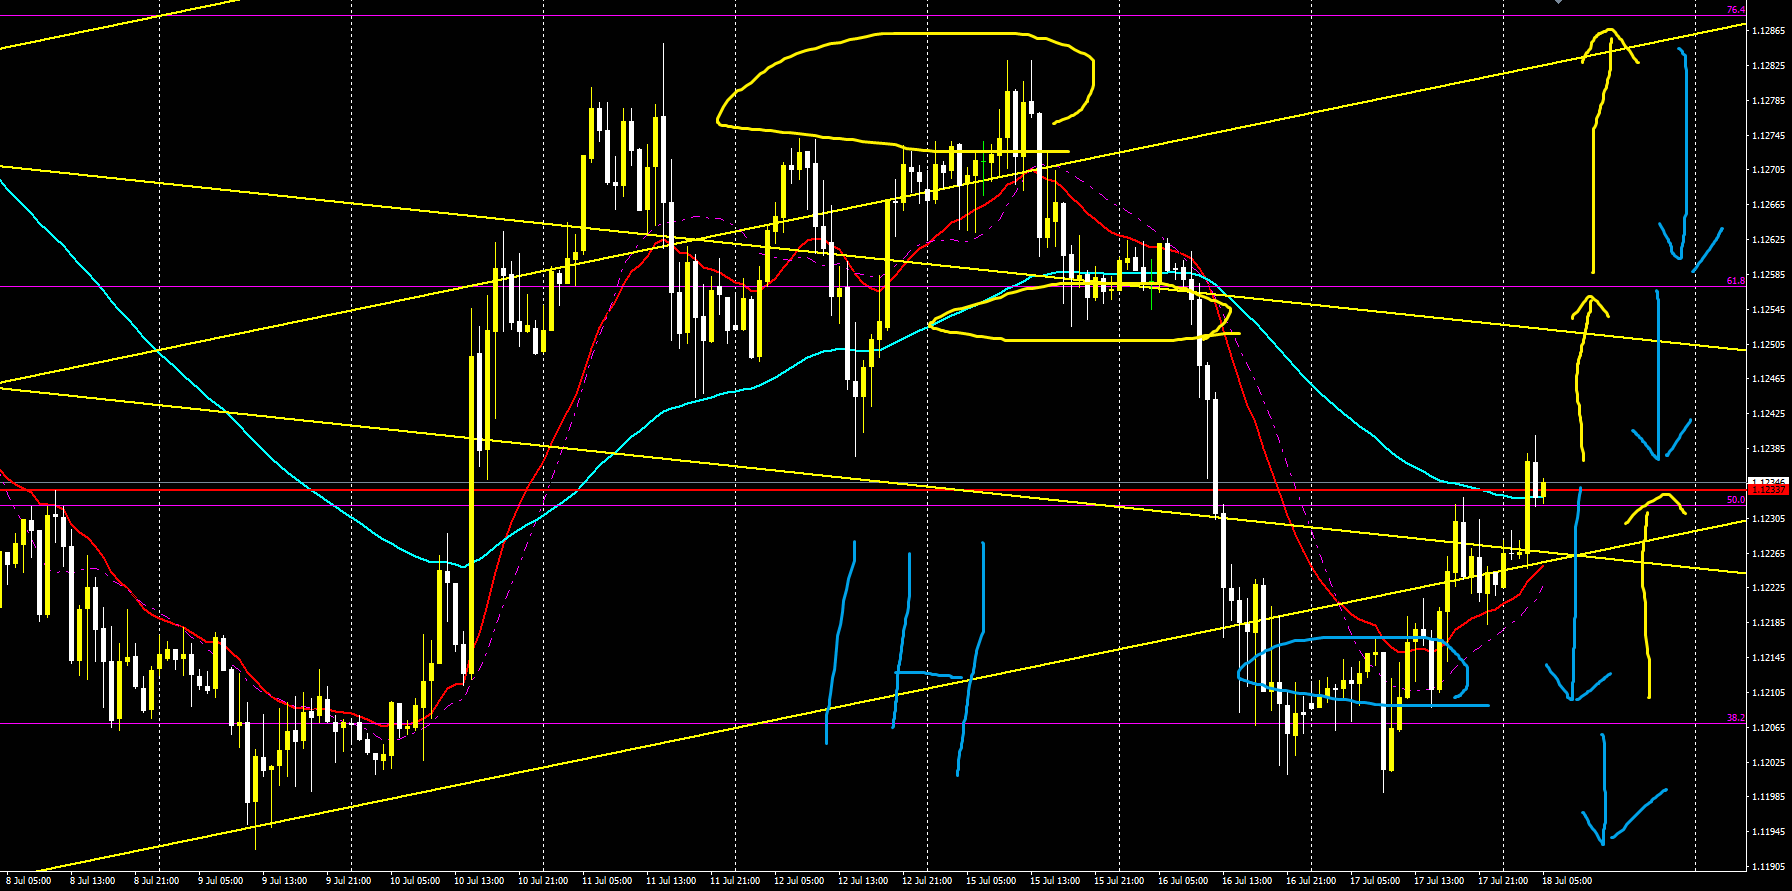
【Euro/Dollar (EURUSD)】
Trading difficulty A–
Long-term outlook up, short-term down
If pullbacks sell, sell around Fibonacci 50 and down to Fibonacci 38
If you break below there, aim for lower lines or Fibonacci 23 and below
If buying occurs, move above Fibonacci 50, then to Fibonacci 61, and break to 76
A return move from 61 can also be considered
4 hours
1 hour
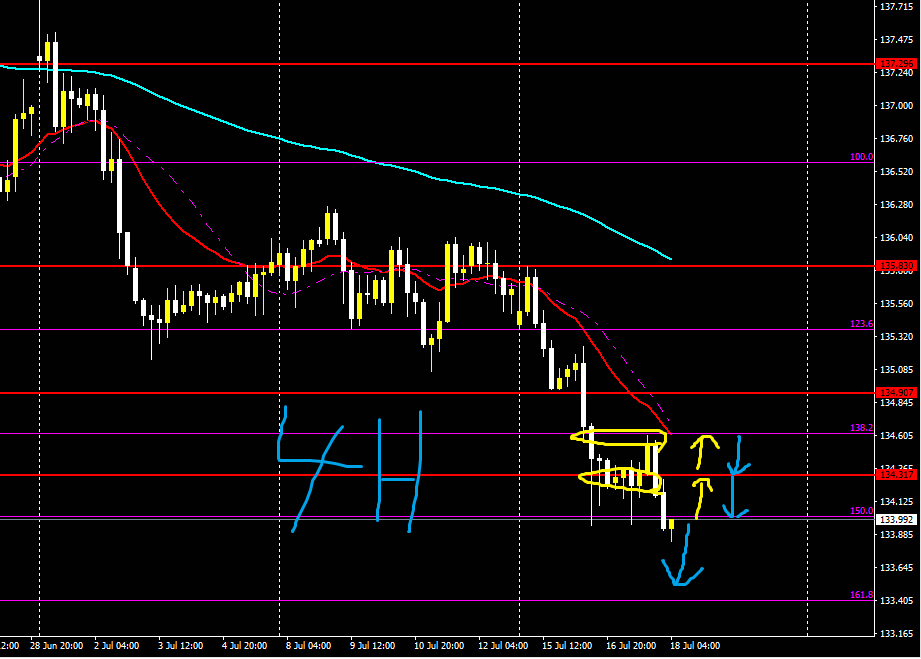
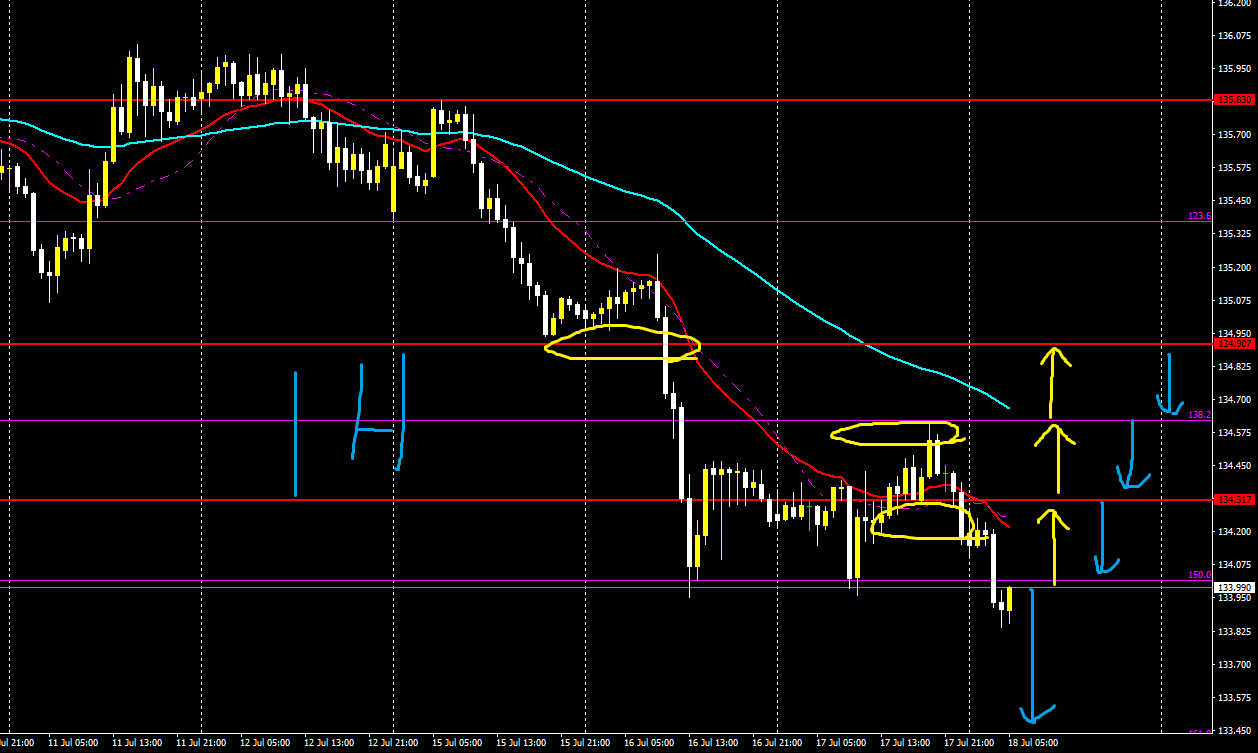
Euro/Yen (EURJPY)】
Trading difficulty B+
Long-term outlook down, short-term also down
There is a possibility of buying entry for now
Buy up to Fibonacci 76 or nearby lines
Consider selling from there on a pullback
If you break above 76, buy up to 61 or in-between around there
4 hours
1 hour
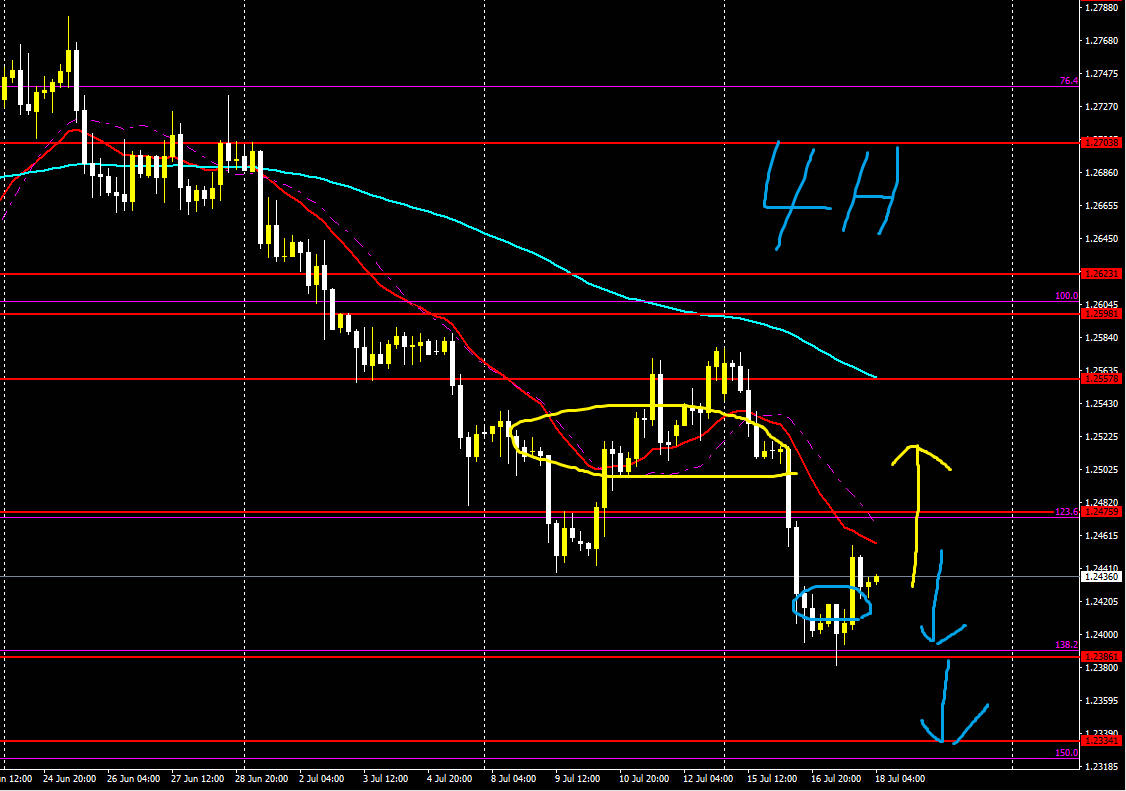
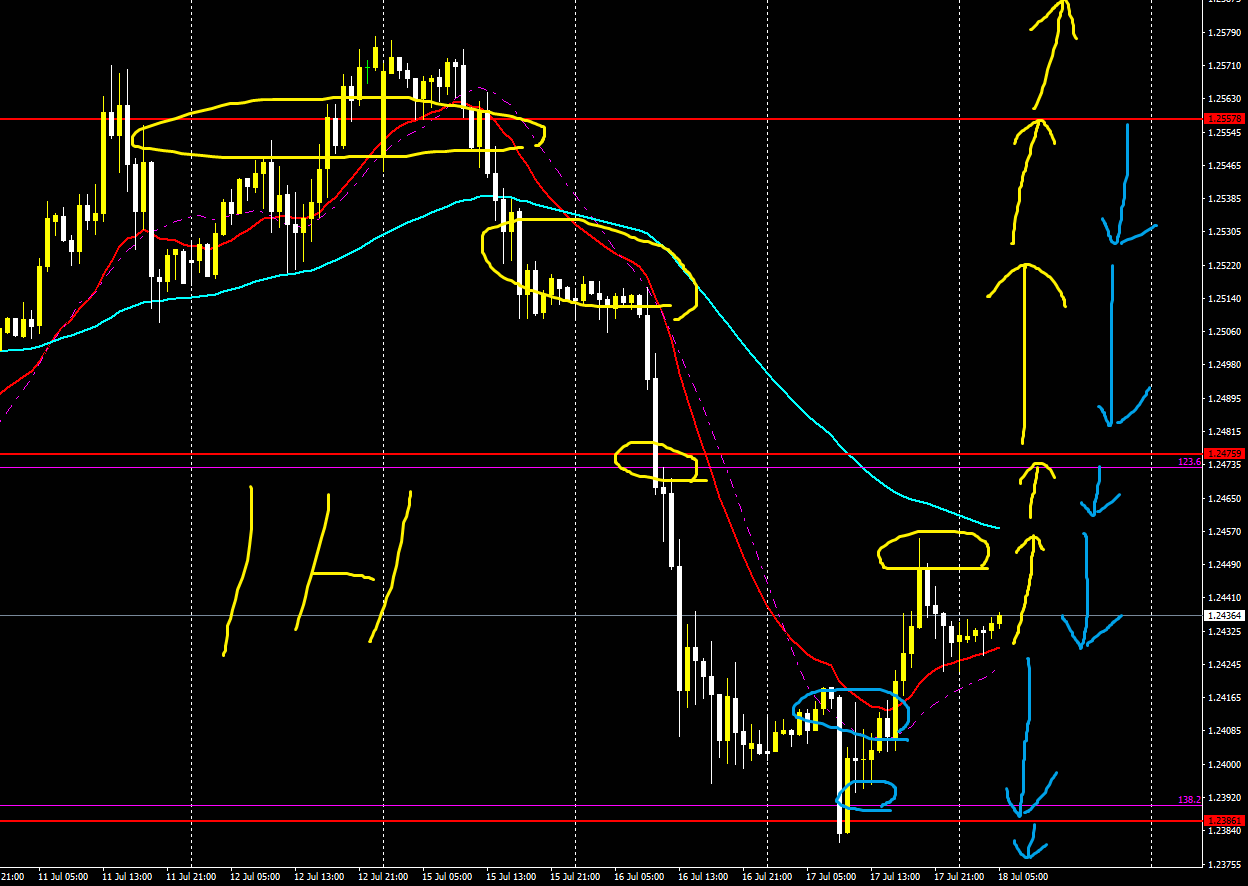
【Pound/Dollar (GBP/USD)】
Trading difficulty A–
Long-term outlook down, short-term also down
Proceed with a pullback selling strategy
First consider selling around Fibonacci 123
If you break above that, buying could come up to around 1.252
Contrarian buying is also acceptable
【Pound/Yen (GBPJPY)】
Trading difficulty A–
Long-term outlook down, short-term also down
Sell on pullbacks or on breakouts
Sell according to the trend
Sometimes the previous market forms a range, so in that case use pullback counter-trend buying
4 hours
1 hour
【Postscript】
The arrows drawn in the image point to the favorable directions
Yellow indicates upward direction
Light blue indicates downward direction
These directions merely indicate relative advantage; they do not guarantee that price will react or rebound at those levels
However, since arrows are drawn near key levels, please use them as a reference for trading
Arrows may become take-profit or stop-loss points
And likewise use lines and Fibonacci for take-profit, stop-loss, and entry point references
Weekly market forecasts and strategies are posted on YouTube, and they are generally accurate
What matters is how to apply them to trading and entries
When the market strategy was correct or incorrect, the method and thinking in trading can differ
And please treat entries as a separate matter


