Learn how to create a trading plan from a currency broker|Episode 29: Dollar-Yen market analysis (22) incorporating the concept of the three-wave pattern [Toshio Asano]
Toshio Asano will fully teach his buying and selling methods and market-view-building know-how backed by his own experience and knowledge in this project. As before, he will continue to read the current and future USD/JPY market and then present the optimal trading plan.
※This article is a reprint and revision of an article from FX攻略.com, September 2019 issue. Please note that the market information written in the text differs from the current market.
Toshio Asano Profile

Asano Toshirō. He has worked at Tokyo Forex Company, a foreign exchange trading intermediary of the TOUKY Short Group, and at EBS (now ICAP), which boasted over 80% global market share in the foreign exchange trading world. He has firsthand experience of historical markets such as the 1985 Plaza Accord, the subsequent era of extreme yen strength, the burst of the bubble, and the euro integration in 2000, through which he honed his market perspective. Later, he founded two FX trading companies and worked as a dealer for a private FX fund. He is currently a writer for the daily blog in the Investment School Group. He is also a strong advocate of easy-to-understand video works that leverage his skill in video editing.
Weekly chart breaks the bottom target and reverses three aspects
There are charts that misinterpret the Ichimaku Kihyo (Ichimoku Kinko Hyo) interpretation, and in the June candle the upper shadow intruded into the Leading Span, with the early-month opening around 108.28 yen becoming the lower bound of the Leading Span, but the correct lower bound is around 109.15 yen on the chart (green horizontal dashed line), so it is confirmed again that it has completely broken below it.
Now, for this month’s chart adjustments, all nearby important levels have turned into resistance, so their color was changed to blue. The main resistance above the weekly Leading Span has become too distant, so the line was thinned, and the lowest price after P has been temporarily labeled Q.
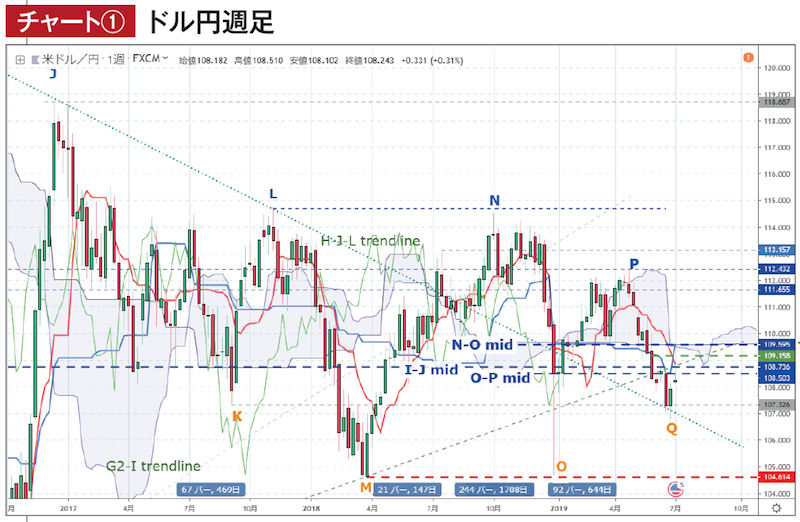
Chart ① Source:USDJPY chart by TradingView
Now, we will continue to analyze the weekly chart (Chart ①). From the first week of July, six candles back, all notable wave-levels have fallen below, and in the last two weeks, excluding the low O, even the second bottom K briefly fell below.
Until last week, the Ichimoku baseline held as a last favorable turn because O contributed to the lack of a rising target value of the bottom, but this week, with O moving away from the weekly target bottom, price rose passively and reversed, resulting in a three-line reversal.
While the baseline’s target high has not moved for a while at P, the conversion line’s target high has already begun to fall, and the target lows of the conversion line and the baseline coincide at Q, so if the price makes a new low, both lines can fall simultaneously in this market. The risk on the downside side does not seem to have diminished.
However, with O (the low) moved outside the baseline’s target, the current baseline no longer reflects the influence of N and O. Nevertheless, the level that rose passively roughly matches the N–O mid, which also aligns with P–Q mid. It remains important to recognize that the market is still in a range centered on N–O mid, with N–O as the maximum amplitude, and until Q is broken below, it is better not to insist too much on a downside view.
Also, if you notice, excluding the lagging span, the other three lines (Tenkan-sen, Kijun-sen, Chikou Span) cluster around the 109.52–109.59 yen level, so if the market approaches this level in the future, the subsequent development will be crucial.