Do not use indicators! What is the first step to master technical analysis?
Hello.
My name is Guava.
Previous article discussed methods to cure a habit of losing.
The reason you can't control your emotions (the habit of losing) is
because you are not confident that your trading method is correct.
Ultimately, the message ends with, “You have to obtain trades you can be confident will win.”
This article will continue with that idea.
In this article, I want to talk more specifically about how you can become confident in your trades.
Mastering Candlestick Analysis
I will start with the conclusion.
To be confident in trading
you absolutely need to understand “candlesticks.”
Because understanding candlesticks forms the foundation of all technical analysis.
To be blunt,
even if you memorize surface uses of indicators and such
without deeper understandingit is almost meaningless.
What those numbers are calculated from, what they mean.
How to use those numbers to trade more advantageously.
If you don’t think about these, you won’t have real technical analysis.So what should you do? Study candlesticks, of course, as it is the most efficient.
Basics of Candlesticks
- “Close price”
- “Open price”
- “High”
- “Low”
- “Volume”
- “Time”
Candlesticks contain these pieces of information. All are important.
Even a single candlestick can reveal a lot of information.
From one candlestick, you can read many things.
What can you learn from candlesticks?
For example, there was a candlestick like this.
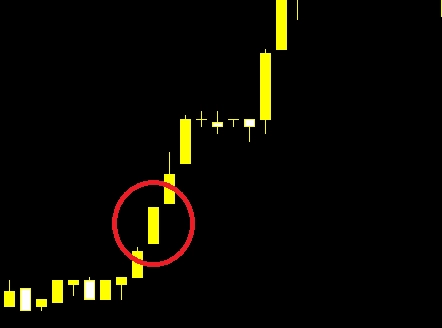
Let’s think about what can be learned from it.
The features are as follows.
・Open and Low are the same
・Close and High are the same
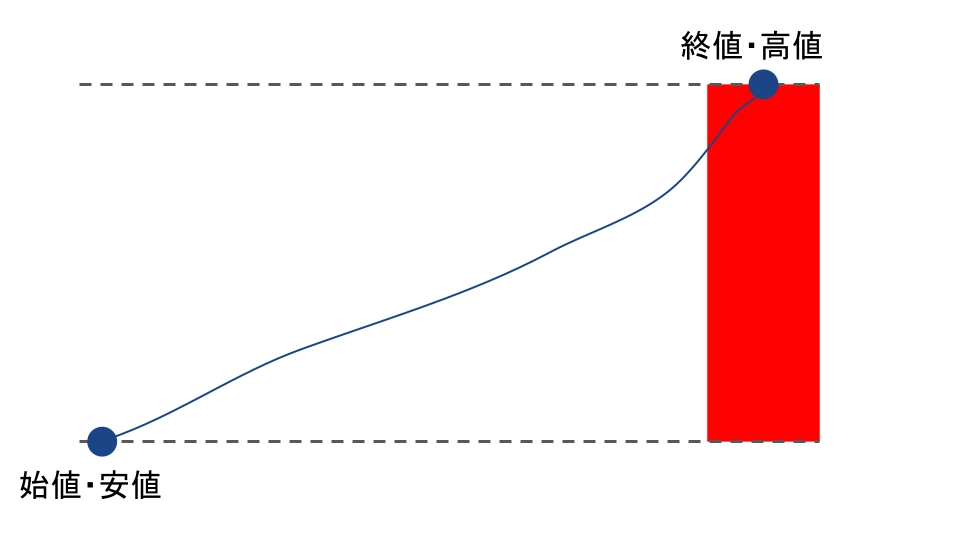
This means, as shown in the diagram,the price kept rising until the candlestick was completed.
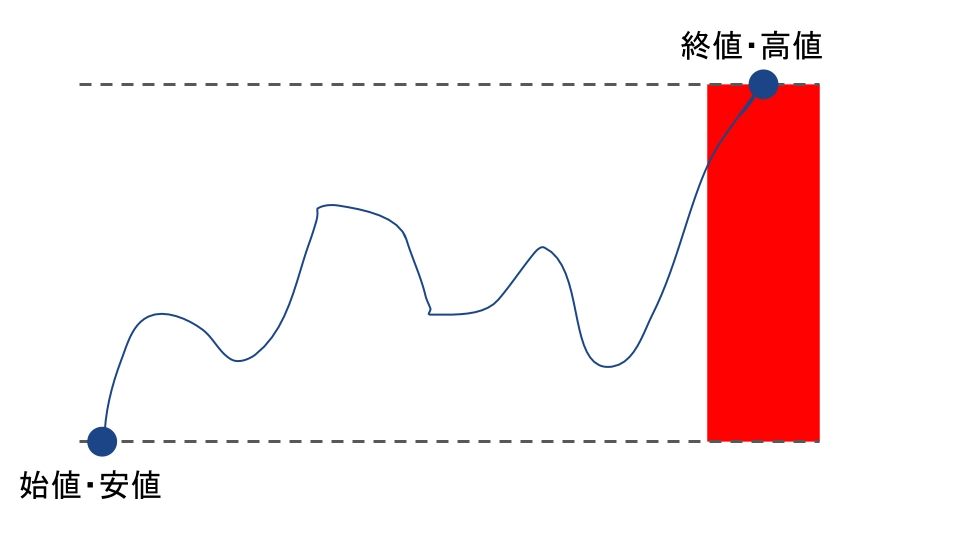
Strictly speaking, it might have looked like this.
However, what is important when looking at candlesticks isto grasp the result roughly.
You don’t need to think much about the detailed sequence that isn’t visible from the result.
So, what can be understood from this result?
Let’s keep it simple.
If the price kept rising until the candlestick completed,
it indicates a strong upward trend.
Generally, a bullish candle is considered a sign of an uptrend for this reason.
Even a single candlestick can indicate an uptrend.
Now, let’s look at another example.
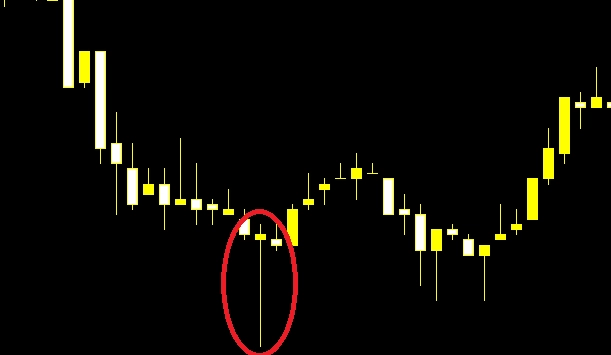
What about a candlestick like this?
Unlike the previous example, it looks complex.
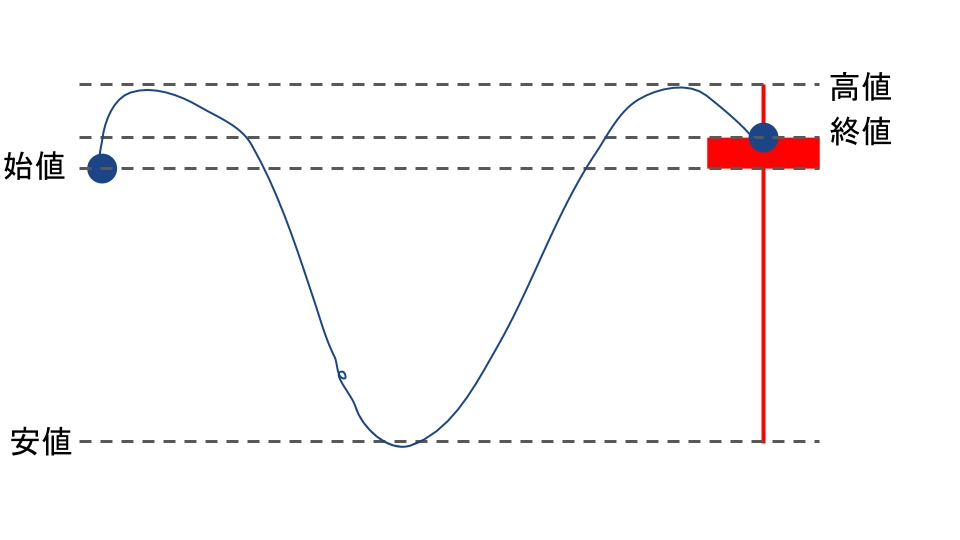
But when you think about it in a diagram, it becomes easy to understand.
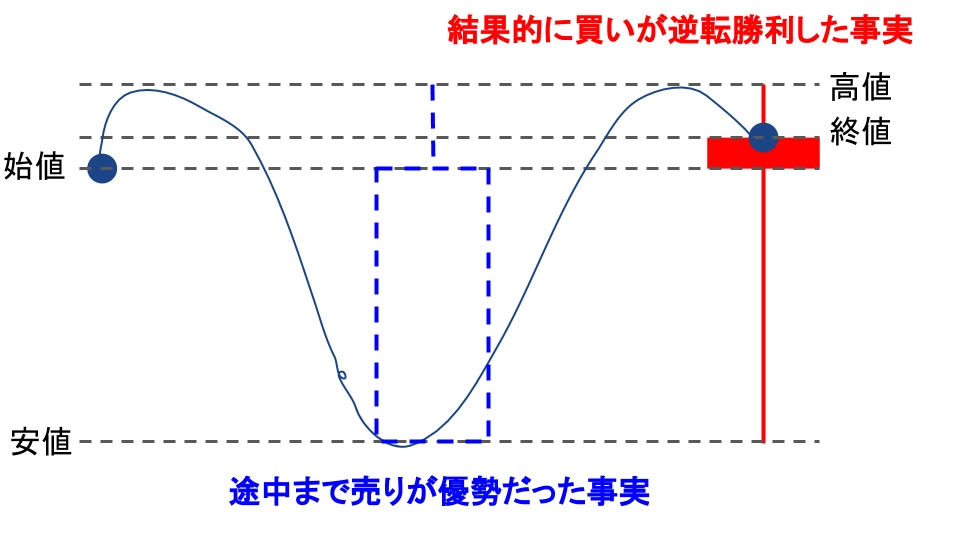
This candlestick indicates that the selling was dominant up to a point, but
as a result, buying overturned and won.
What can be learned from here?
It’s important to keep thinking about it as simply as possible.
The fact that buying overtook selling after selling was dominant means
“the downtrend shifted to an uptrend”.
Generally, this is why a “pin bar” is considered a reversal signal.
How about that?
Even a single candlestick allows for so much analysis.
When you think about it, using indicators right away becomes difficult and complex,
and you can understand how complicated the analysis is.
In short, many people aretrying to do things beyond their understanding.
To put it plainly,they raise the hurdle for themselves.
So, start by looking at one candlestick and
roughly understanding its meaning.
It’s modest, but I believe this is the best shortcut.
So, do we not need indicators?
If you’ve read this far, you might think that as long as you understand candlesticks,
indicators are unnecessary.
Well, honestly, that’s true to an extent...
If you understand candlesticks, you’ll understand the meaning of indicator formulas.
And if you have indicator formulas in your head,
you can compute and analyze from candlesticks without showing indicators explicitly.
However, indicators are still convenient.
They allow you to grasp market conditions visually, so analysis speed will improve.
What I wanted to emphasize here is
that candlesticks are the most important.
Indicators are just tools to help analyze the market efficiently
and should be viewed as auxiliary tools, which is the aim of this article.
In Conclusion
That is all for now.
I would be glad if even one reader found this helpful.
In the next article, I plan to continue from candlestick analysis.
Lastly, a brief promotion: we are currently offering a new indicator we developed for free.
↓↓
https://www.gogojungle.co.jp/tools/indicators/19469
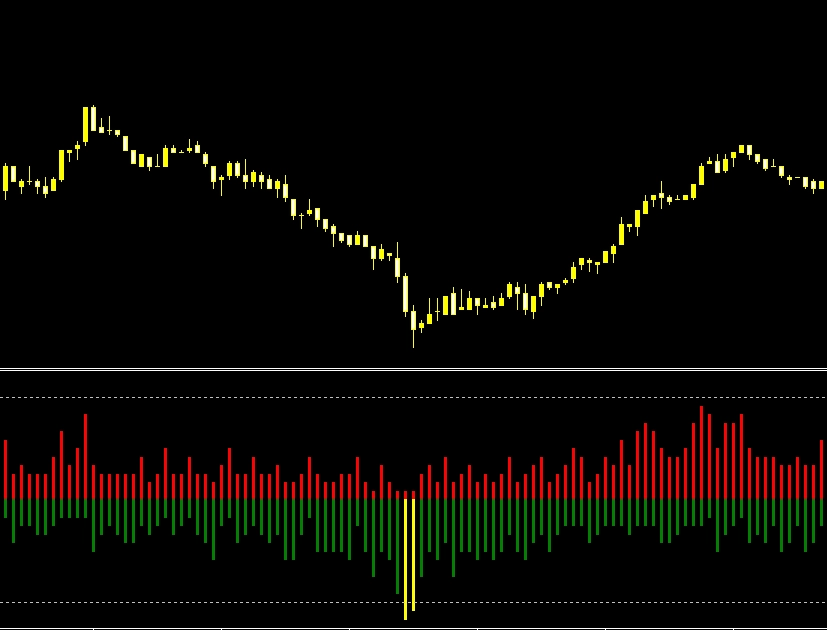
It is a simple oscillator-type indicator that is easy for beginners to use.
Usage instructions and backtests are also published, so if you’re curious, please check it out!
Thank you for reading to the end.