Gold rise likely to reach $1500 as well [Ryuuji Sato]
Ryuuji Sato Profile

Sato Ryuuji. Born 1968. After graduating from a U.S. university in 1993, he joined Genesis Co., Ltd. (later Oval Next Co., Ltd.), a provider of macroeconomic and financial/investment information, after working at a marketing company. He writes analyst reports on macroeconomic analysis, currency, commodities, and stock markets, and is involved in trading. In 2010, he founded “H-Square Co., Ltd.”, writes analyst reports and plans/publications such as “FOREX NOTE Currency Handbook,” and serves as a radio host related to investments. Individual trader. International Federation of Technical Analysts – Certified Technical Analyst. Main caster of Radio Japan’s “The Money Doisato’s Market Forecast” (Mondays 15:00–).
Official site:Ryuji Sato Blog
*This article is a reprint/re-edit of articles from FX攻略.com September 2019 issue. Please note that the market information written in the body is different from the current market.
From Bottoming Out to an Upward Phase
Gold is gaining momentum. Gold rose to $1,410.74, a high not seen since September 2013, on June 21. In our May issue (written in February), we noted that the $1,400 range was within view, and it has already surpassed that level. It also looks likely that gold could reach $1,500 for the first time since April 2013. This time, as gold moves into an upward phase aiming for the milestone of $1,500, let’s take a look.
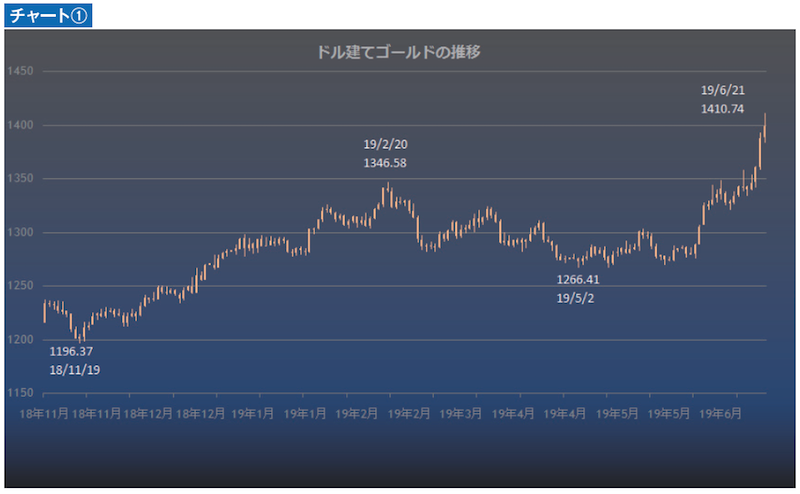
First, here is the price movement of gold over the past six months (see Chart 1). The market began to tighten around the end of last year, and in early 2019 gold traded near $1,300 for a while, then on January 25 broke above the $1,300 threshold and by February 20 rose to $1,346.58. The background to this price movement includes Federal Reserve Chair Jerome Powell’s remarks at the start of the year that “monetary authorities are patient, and prepared to adjust monetary policy promptly if necessary,” suggesting a pause in the previous tightening cycle.
However, optimism about U.S.-China trade tensions then spread, and investment funds flowed into the stock market, causing gold to gradually lose upside, dropping to the $1,266 area by April 23. May was dominated by range trading around $1,266–$1,300, but the turning point occurred at the end of May when gold suddenly broke above $1,300.
Around this time, an inverted yield curve appeared between the U.S. three-month and 10-year Treasuries, President Trump announced tariffs on Mexico, and retaliatory tariffs on China were also imposed. The stock market wavered and money flowed into safe assets, including gold. When the Fed’s FOMC signaled a rate cut on June 19, buying accelerated and gold rose to the $1,410 range.