Mercator Projection [Koh Mori]
Mori Akira Profile
Economist. Affiliated with a think tank (United States). Specializes in exchange rate policy, monetary policy, macroeconomic policy, and financial regulation. Interacts with market participants, financial authorities, and policymakers to analyze exchange rate trends from multiple perspectives.
*This article is a reprint and edited version of an article from FX Prospecting.com, September 2019. Please note that the market information described in the text may differ from the current market.
Recently, while wandering through a university library, I made a very happy discovery. I learned that there are many old world maps stored in the archives. Enthusiastically, I spent a few hours gazing at those maps and letting my thoughts wander about this and that. In particular, unfinished maps from the Age of Exploration and maps from the period when Germany was divided into east and west were very interesting.
As readers may know, the “Earth” is a sphere, and it is impossible to simultaneously and accurately represent the four elements of “area,” “angles,” “distance,” and “direction” on a flat plane.
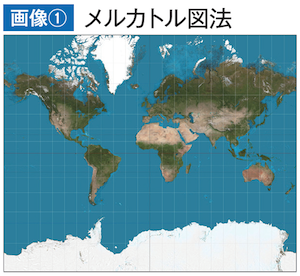
Therefore, the flat maps we usually see are those based on the Mercator projection devised by Gerardus Mercator of Belgium (Image ①). This map was extremely valuable during the Age of Exploration. Because during sea travel using a compass, this map could determine routes that were rhumb lines (loxodromes) by simply connecting two points with a straight line. However, its major drawback is that it causes large distortions in “distance” and “area” (countries located at high latitudes appear much larger on the map).