

Forecast of future market trends, strategies and opportunity currencies (from 7/12)
Hello, this is OnePiP Trade (@onepipst)
From 7/12, I would like to outline market forecasts, plan strategies, and look for entry points
I base horizontal lines and trend lines on the daily chart
I also tweet about profits and other useful things,so pleasefollow Twitter.
Table of contents
- USD/JPY (Dollar-Yen)
- EUR/USD (Euro-Dollar)
- EUR/JPY (Euro-Yen)
- GBP/USD (Pound-Dollar)
- GBP/JPY (Pound-Yen)
- Afterword
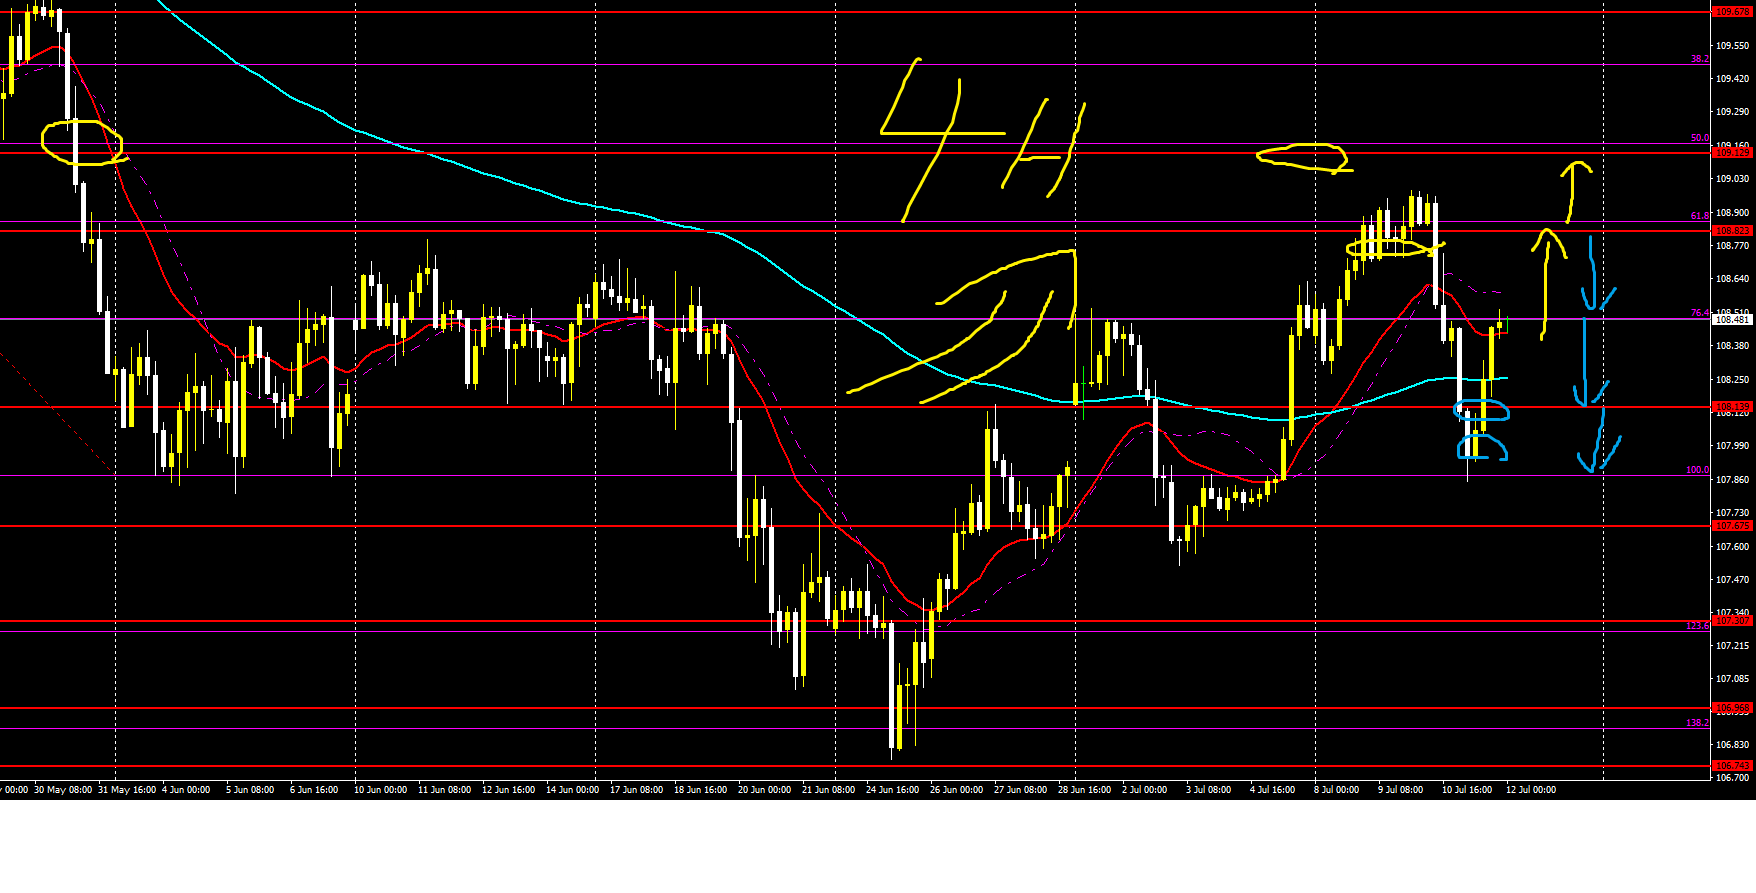
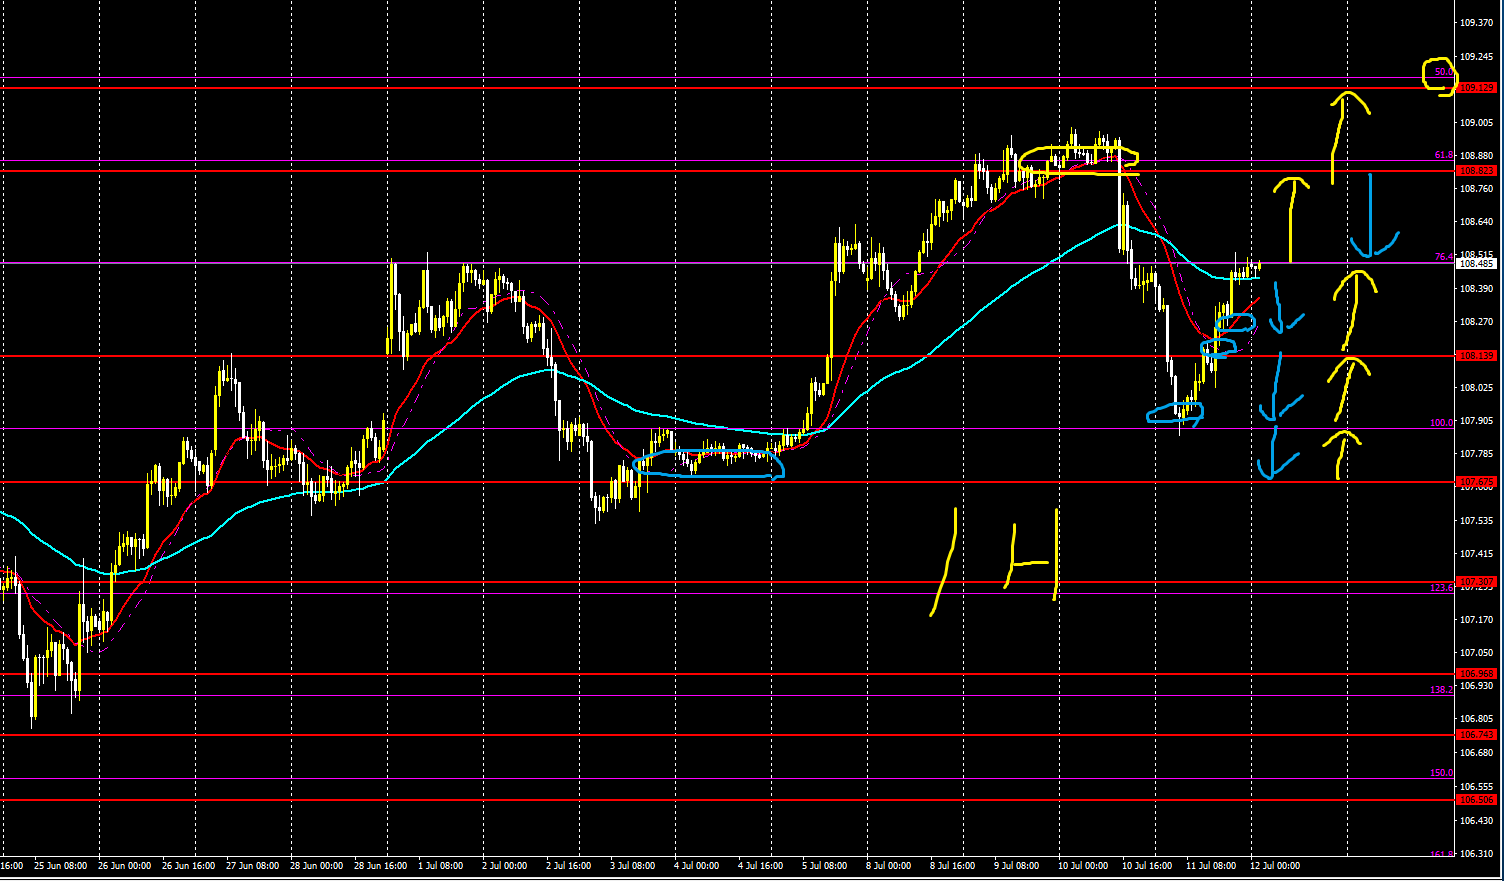
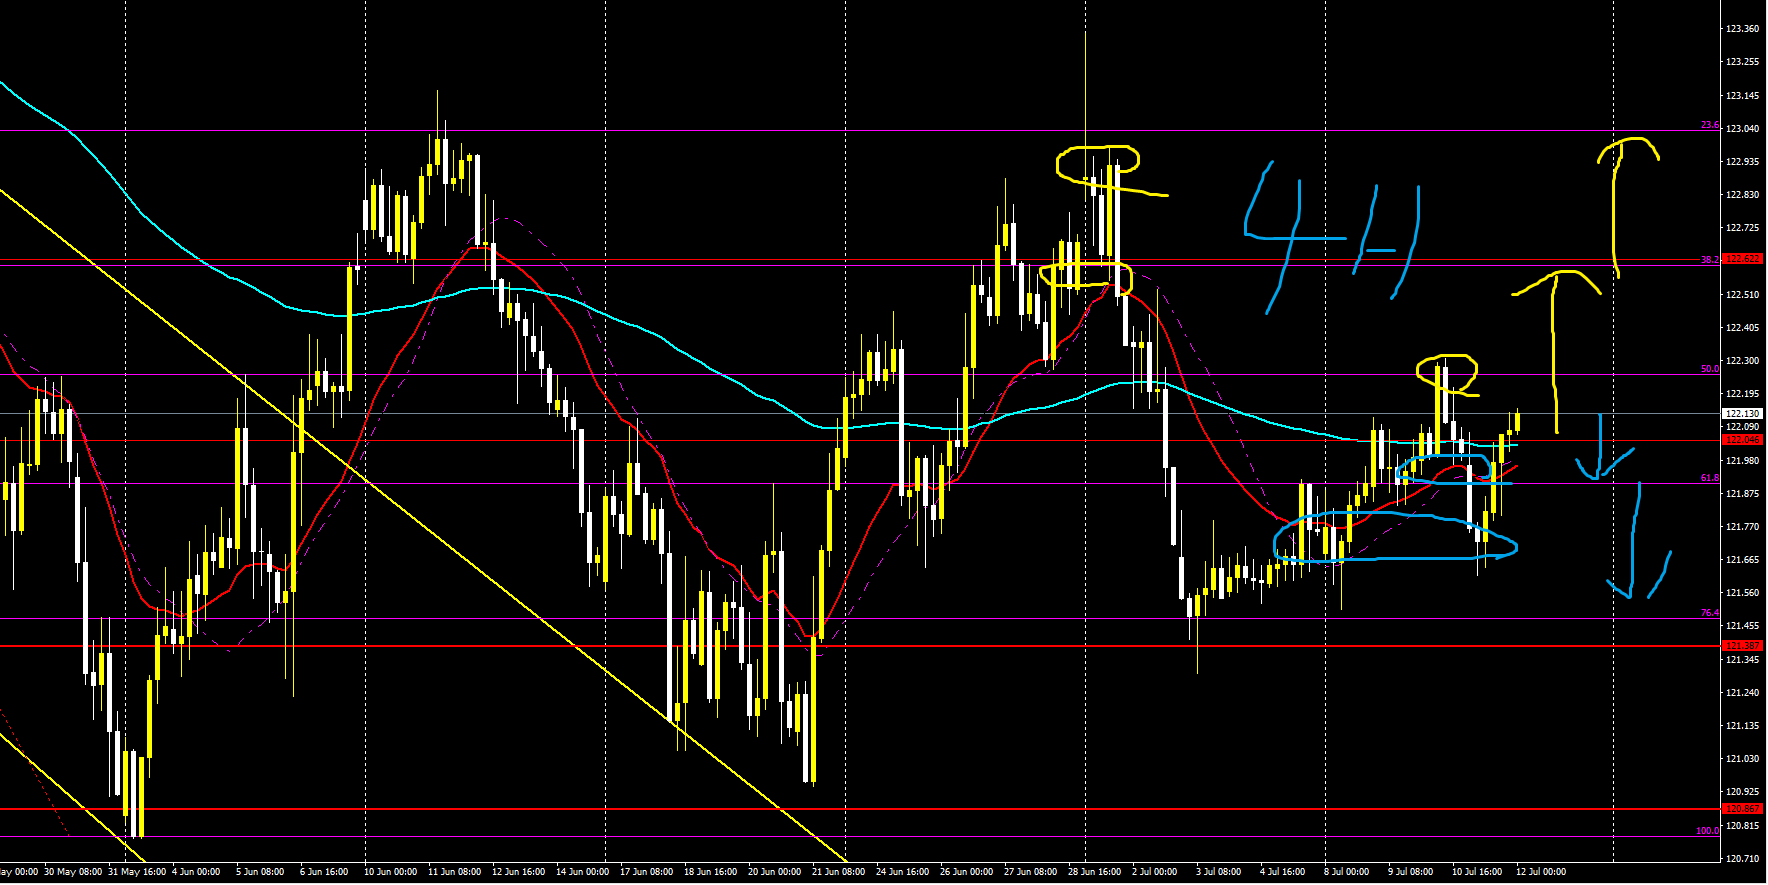
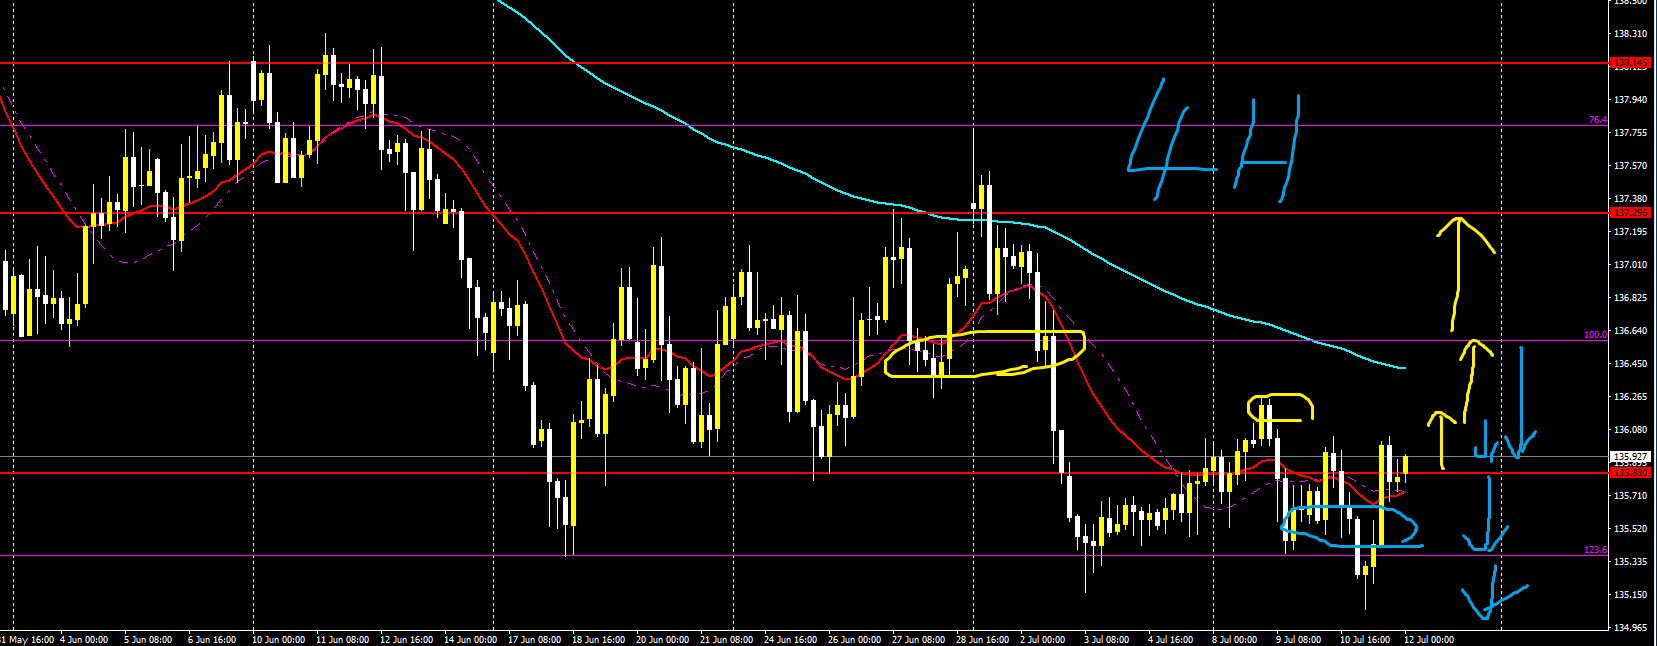
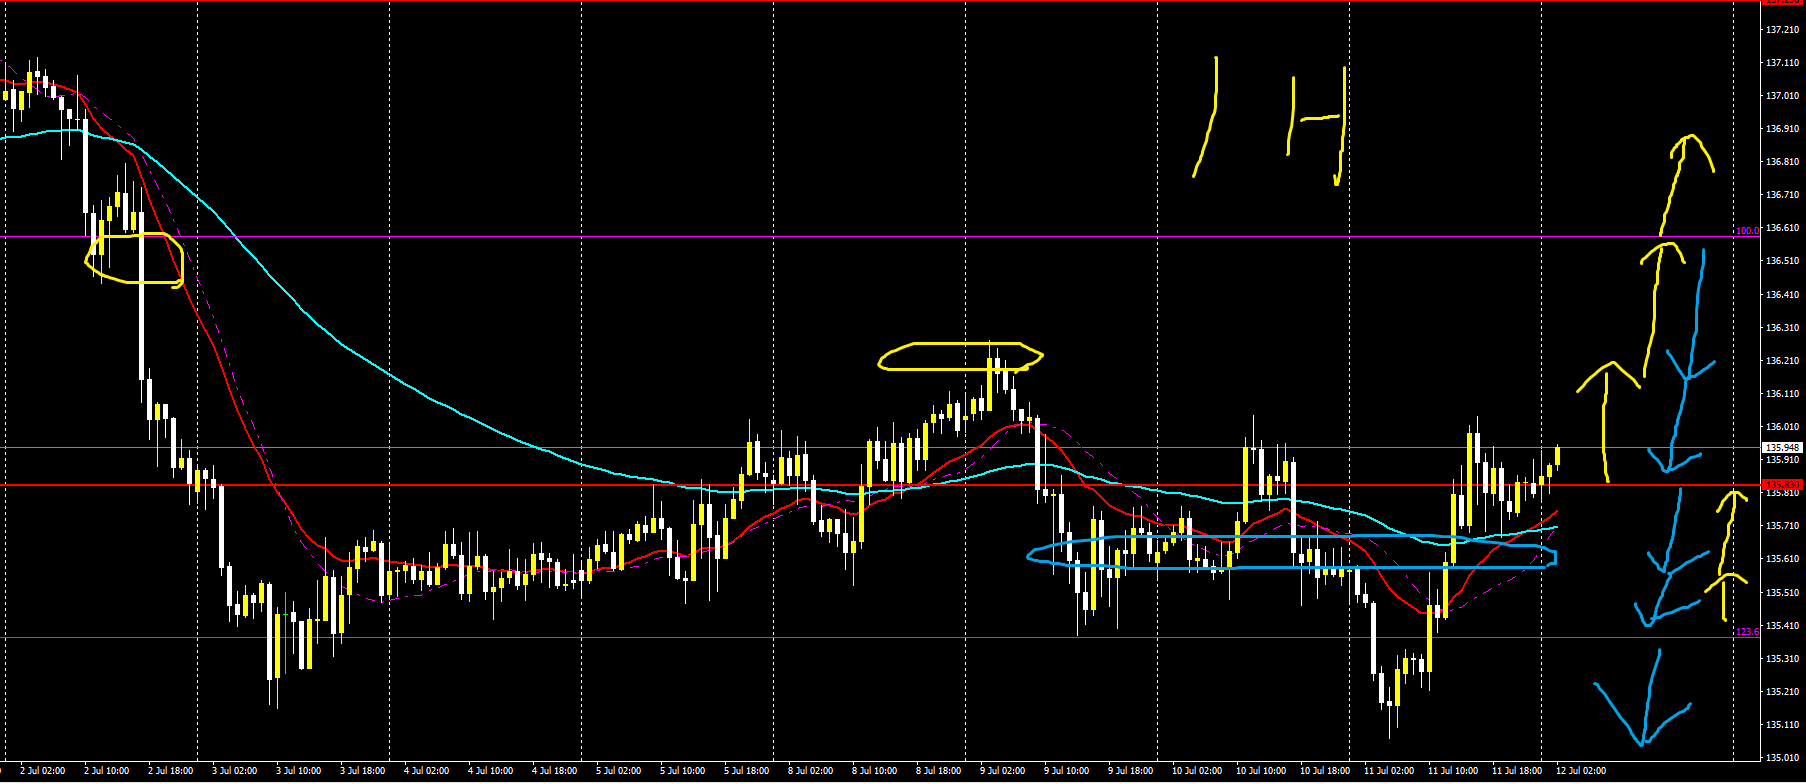
【USDJPY】
Trading difficulty: B+
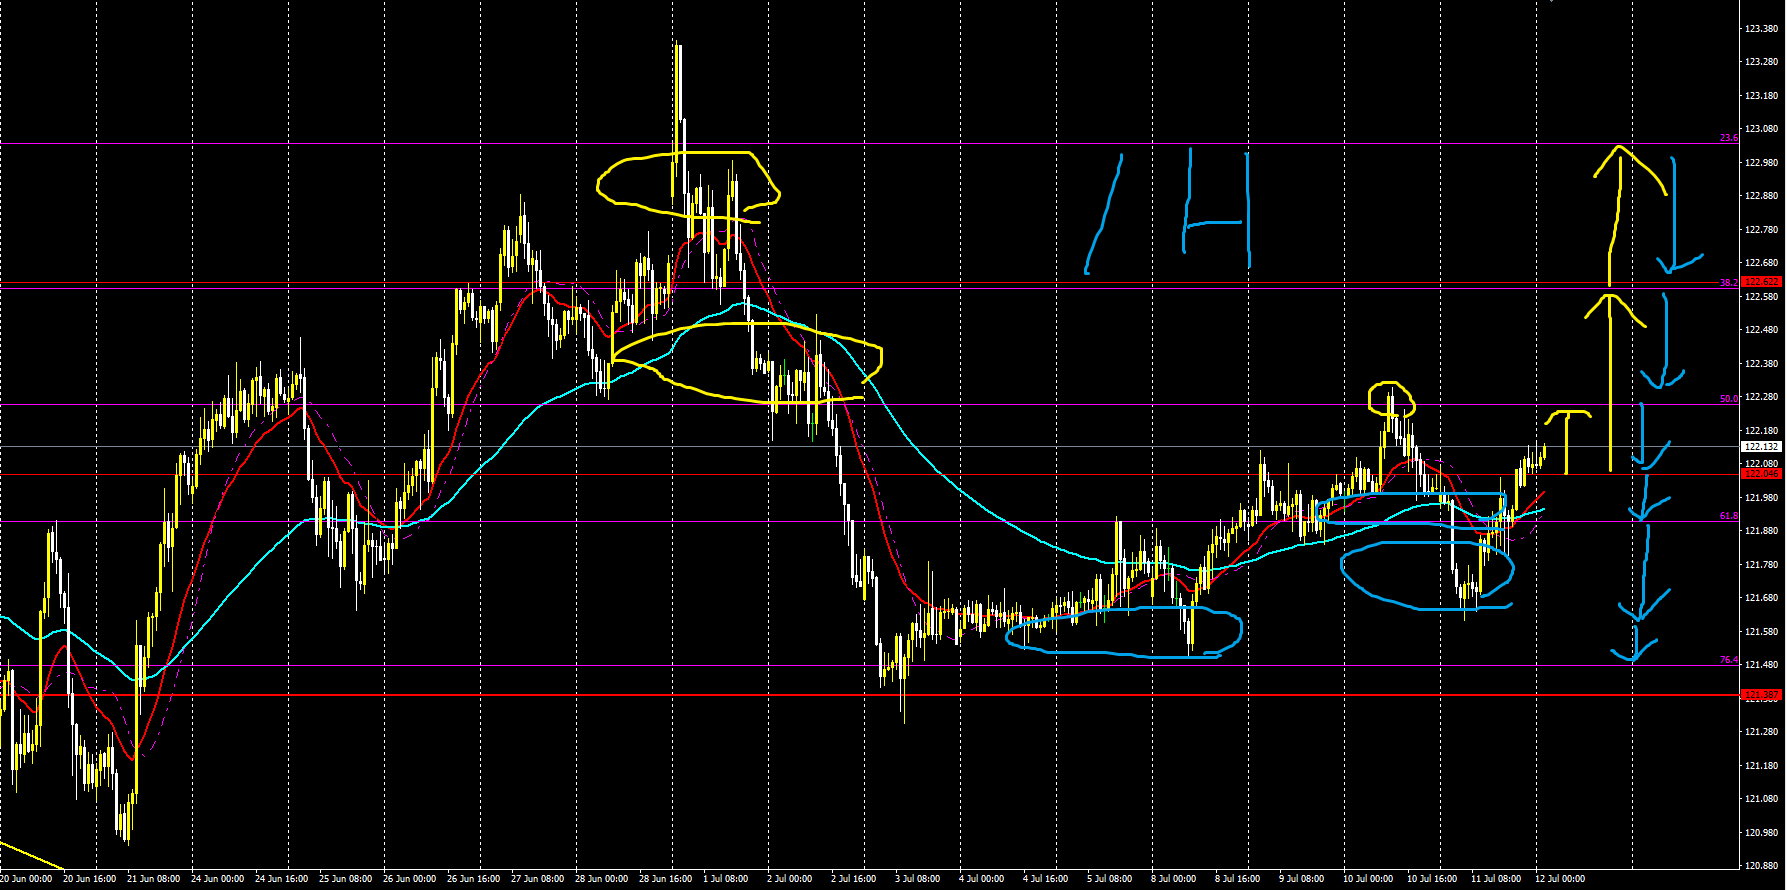
Long-term outlook is up, short-term is also up
It has moved above the short-term MA and there is a high possibility of continuing to rise
If so, look to buy up toward around the recent high near Fibonacci 61 or 50
Or consider selling from around Fibonacci 76, and selling toward the lines below or Fibonacci 100
4 hours
1 hour
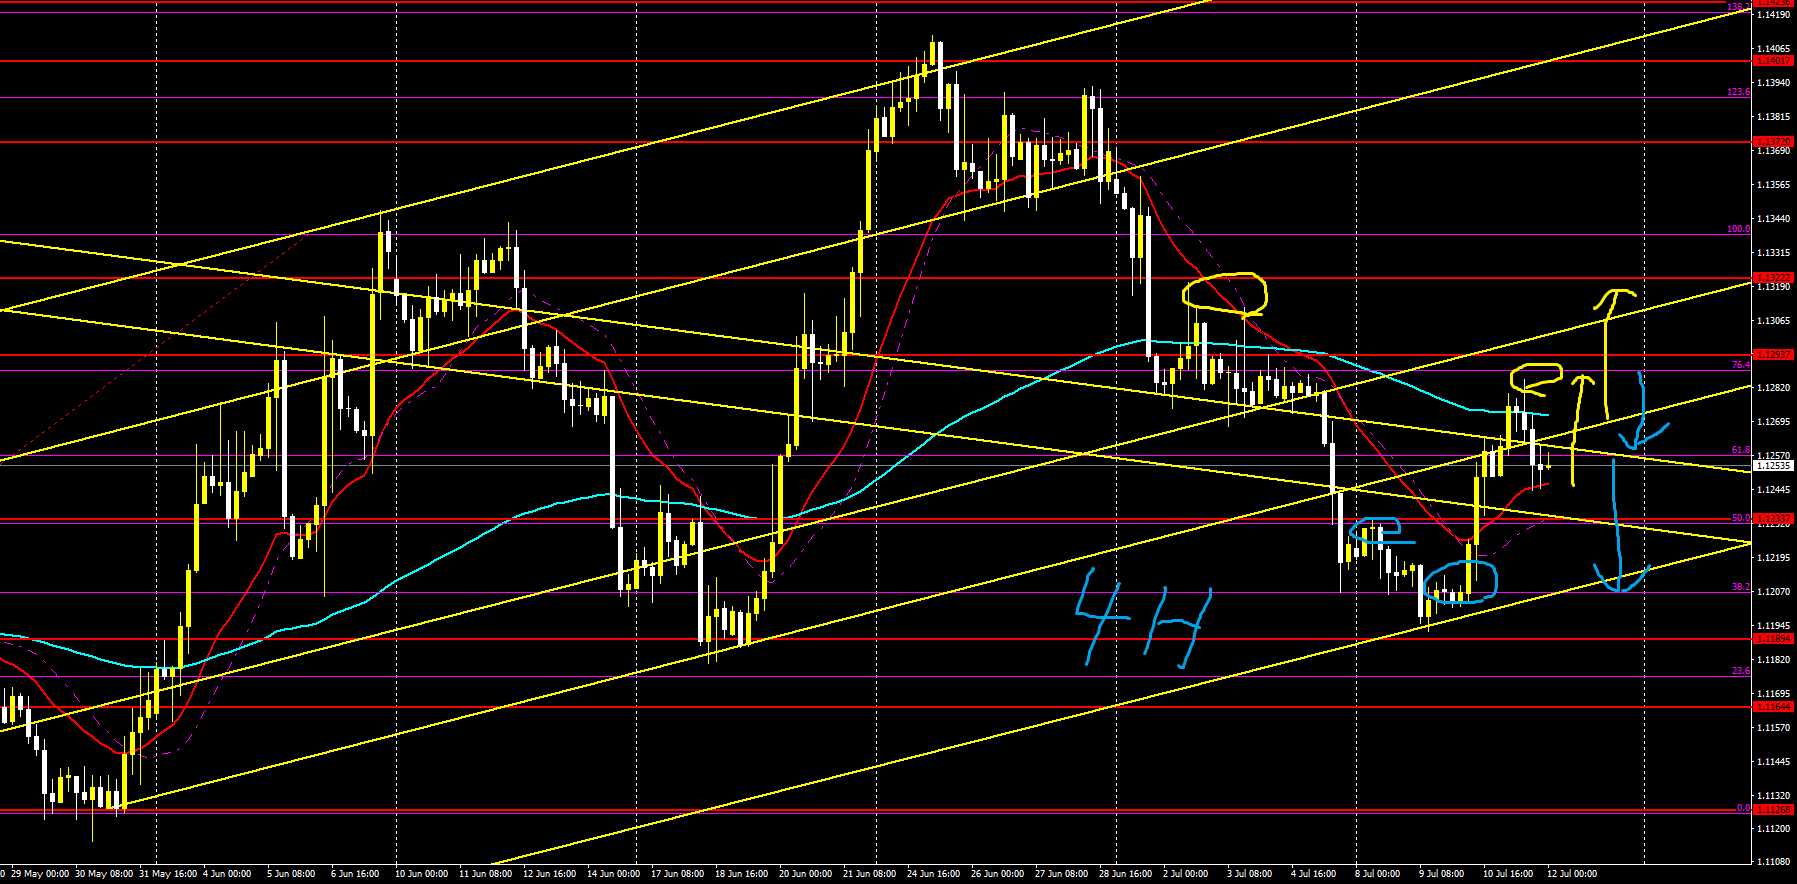
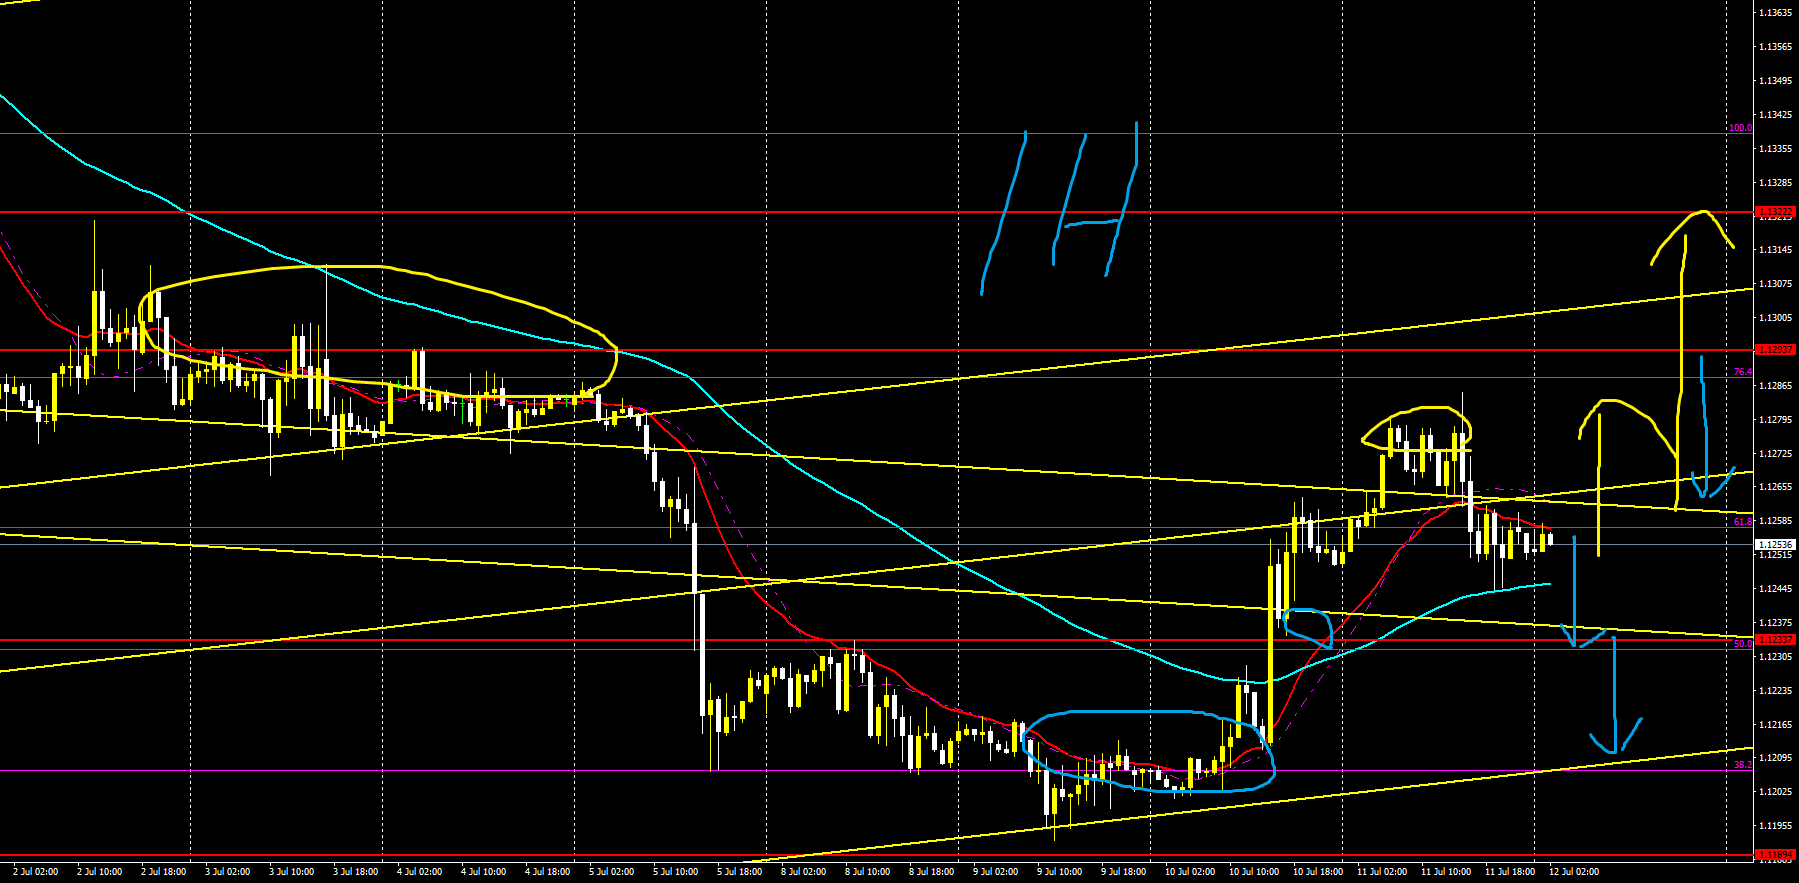
【EURUSD】
Trading difficulty: B+
Long-term outlook up, short-term down
It is positioned above the short-term MA
Approach with buys toward around Fibonacci 76, or sells toward Fibonacci 38
There may be a buy impulse first, so pushing toward around Fibonacci 50 could be good
4 hours
1 hour
EURJPY】
Trading difficulty: B+
Long-term outlook down, short-term also down
Range-bound
Since it is above the short-term MA, there may be a buy, but this could be a rebound leading to a sell, so
caution is needed
Follow the arrows and lines to buy or sell
If there is buying up to around Fibonacci 38 or 50, it may be sold back, so consider selling on the retrace
If it does not rise and breaks below the MA, you can consider selling
4 hours
1 hour
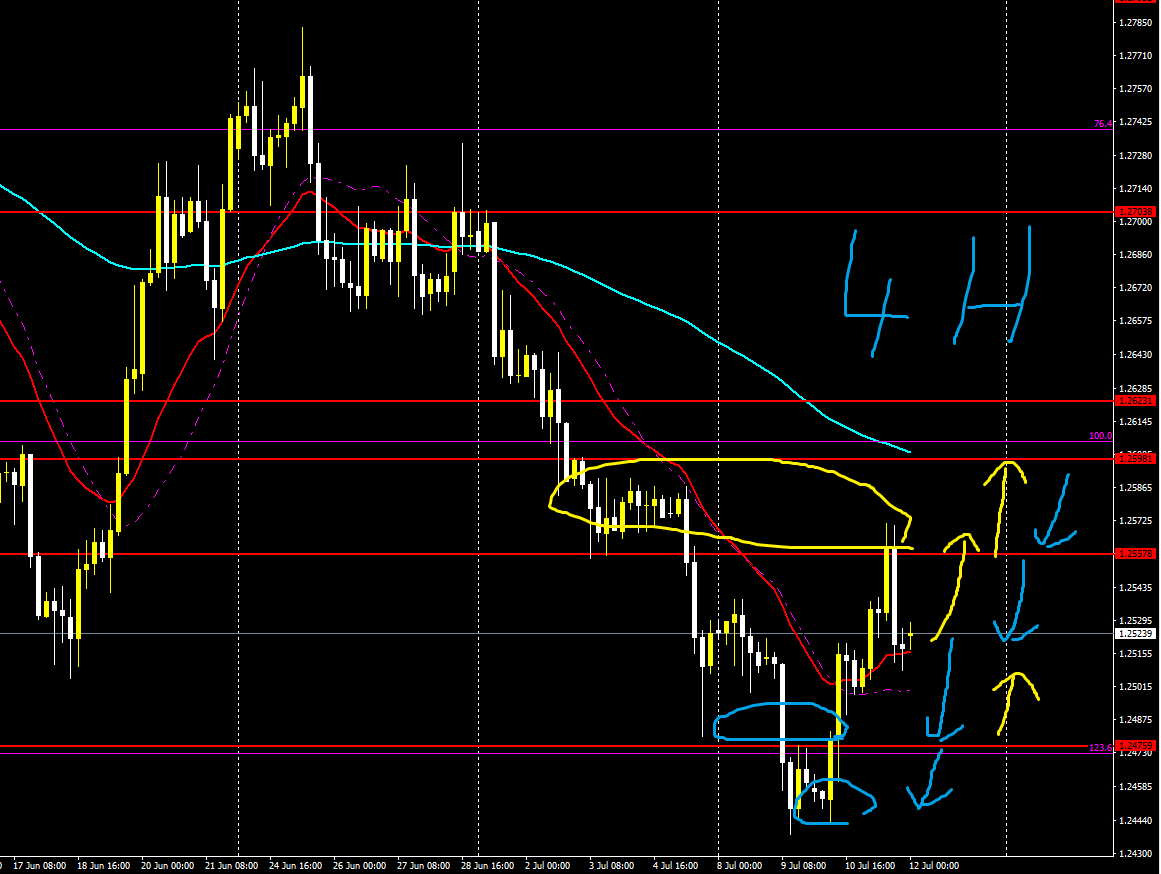
【GBPUSD】
Trading difficulty: A−
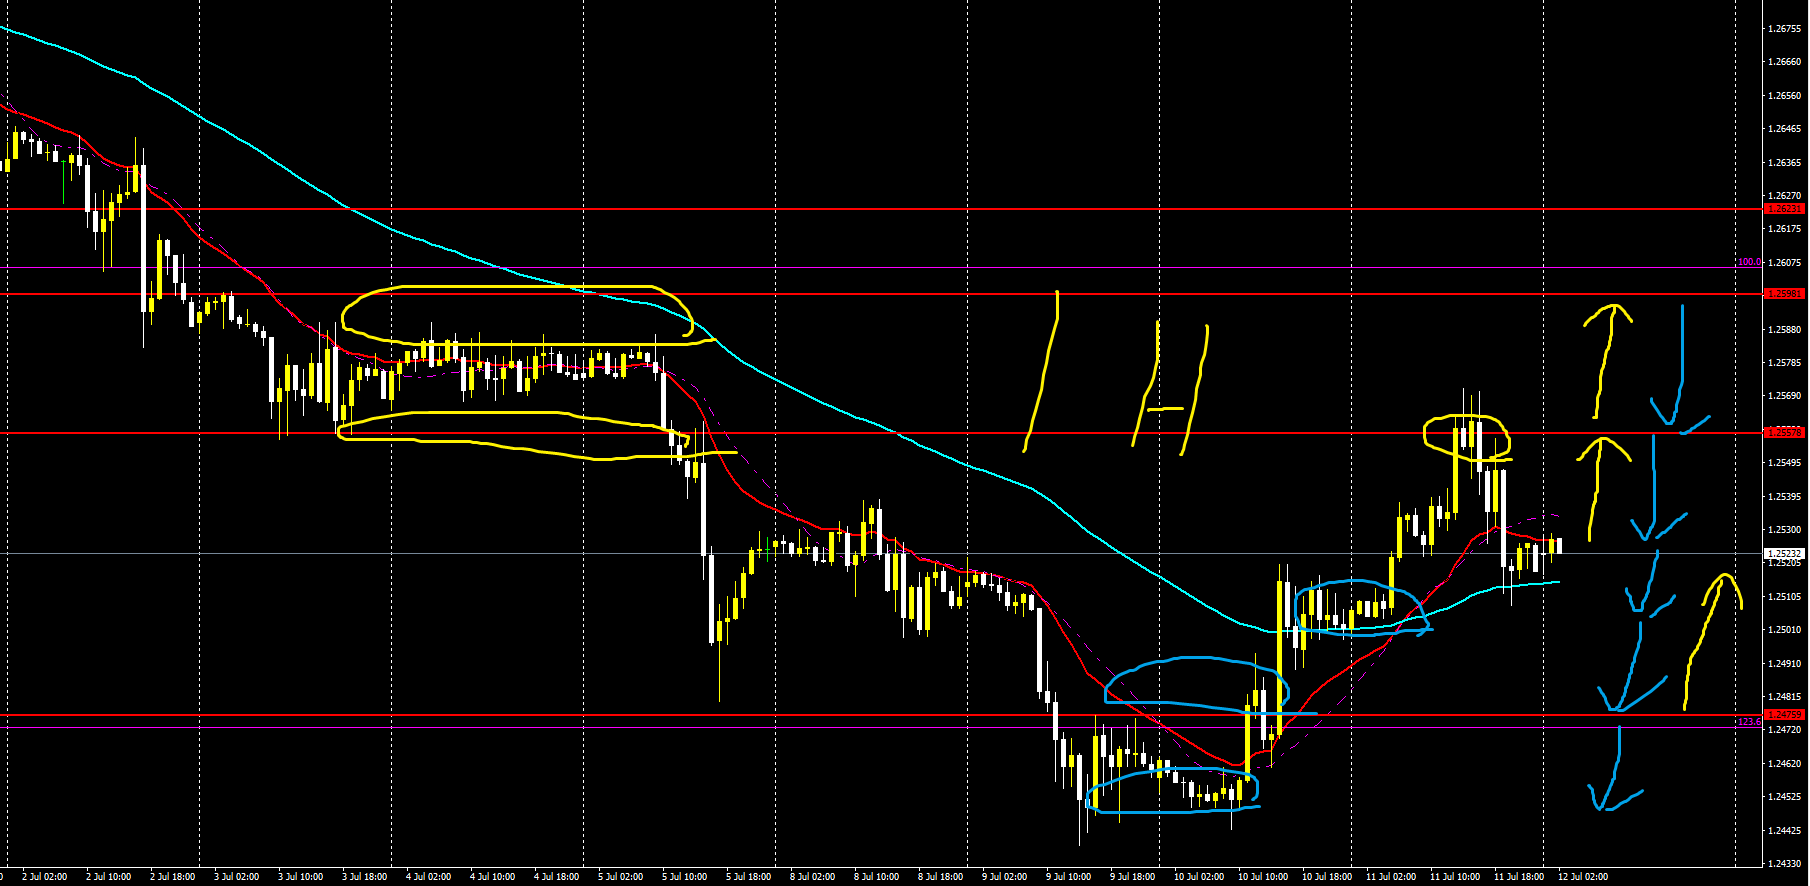
Long-term down, short-term down
Whether the down move continues, or there is a rebound toward the upper line or Fibonacci 100 or nearby lines, and buy opportunities
Then a retrace sell
If it breaks below the MA, consider selling
If it rebounds at Fibonacci 123, a contrarian buy could be good
4 hours
1 hour
【GBPJPY】
Trading difficulty: B−
Long-term down, short-term down
Range-bound
Buy toward around Fibonacci 100, or sell toward Fibonacci 123
This is a range trade
On the lower timeframes, there is a trend, so trading with that trend is also good
Rely on the MA as well
4 hours
1 hour
【Afterword】
The arrows drawn in the image indicate the advantageous direction
Yellow means upward
Light blue means downward
It is not guaranteed that the rate will react or rebound exactly in that direction
However, the arrows are drawn near important levels, so please use them as trading references
The arrows may become take-profit or stop-loss points
And likewise lines and Fibonacci can be used as take-profit, stop-loss, or entry reference
Weekly market outlook and strategy are published on YouTube, and they tend to be accurate
What matters is how you apply them to your trading and entries
When market strategy was correct or incorrect, your trading approach and thinking may differ
And please consider entries as a separate matter


