

Future market outlook, strategy and opportunity currencies (from 7/11~)
Hello, this is OnePiP Trading(@onepipst)
From 7/11 onwards, I will forecast the market, form strategies, and look for entry points
I also tweet about profits and other useful informationso pleasefollow on Twitter.
Table of Contents
- Dollar/Yen (USD/JPY)
- Euro/Dollar (EUR/USD)
- Euro/Yen (EUR/JPY)
- Pound/Dollar (GBP/USD)
- Pound/Yen (GBP/JPY)
- Afterword
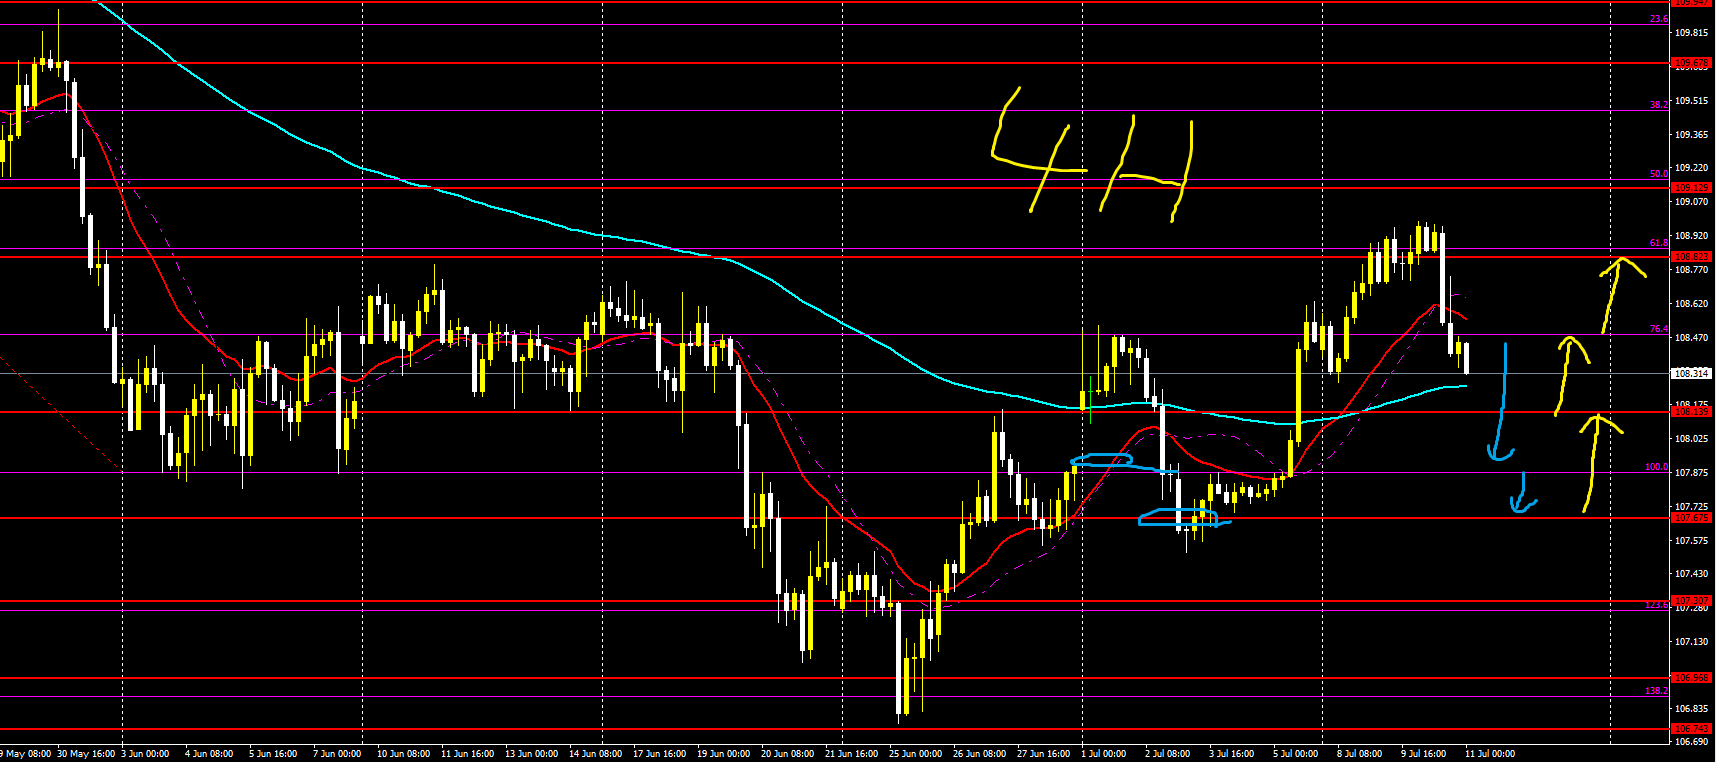
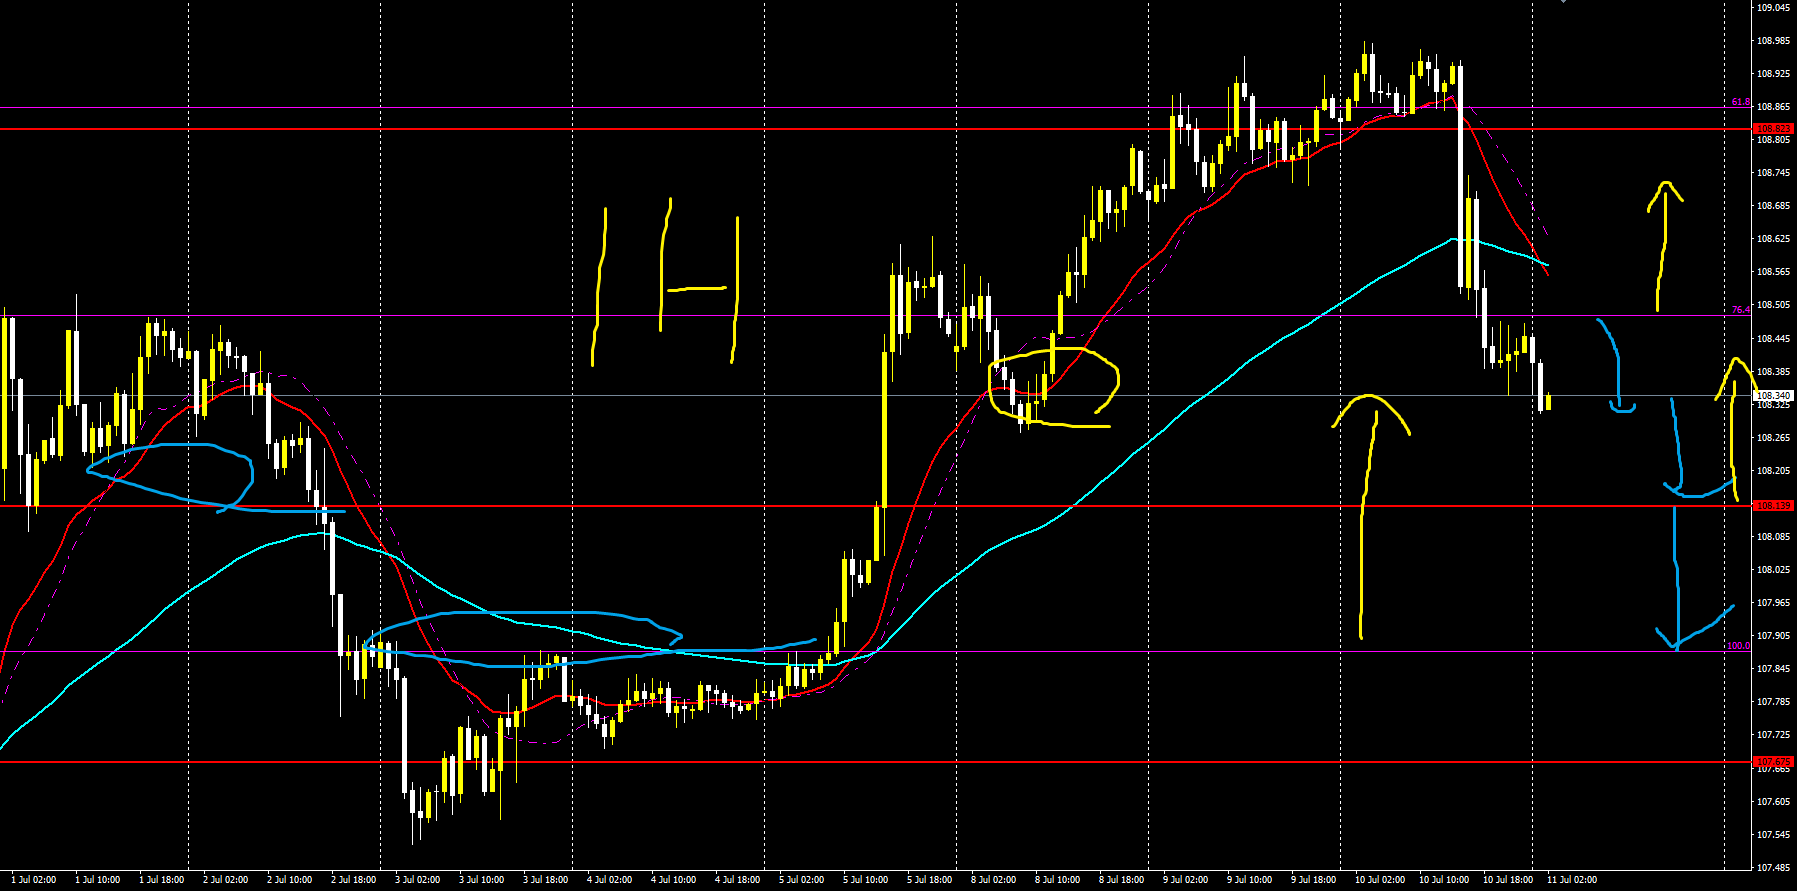
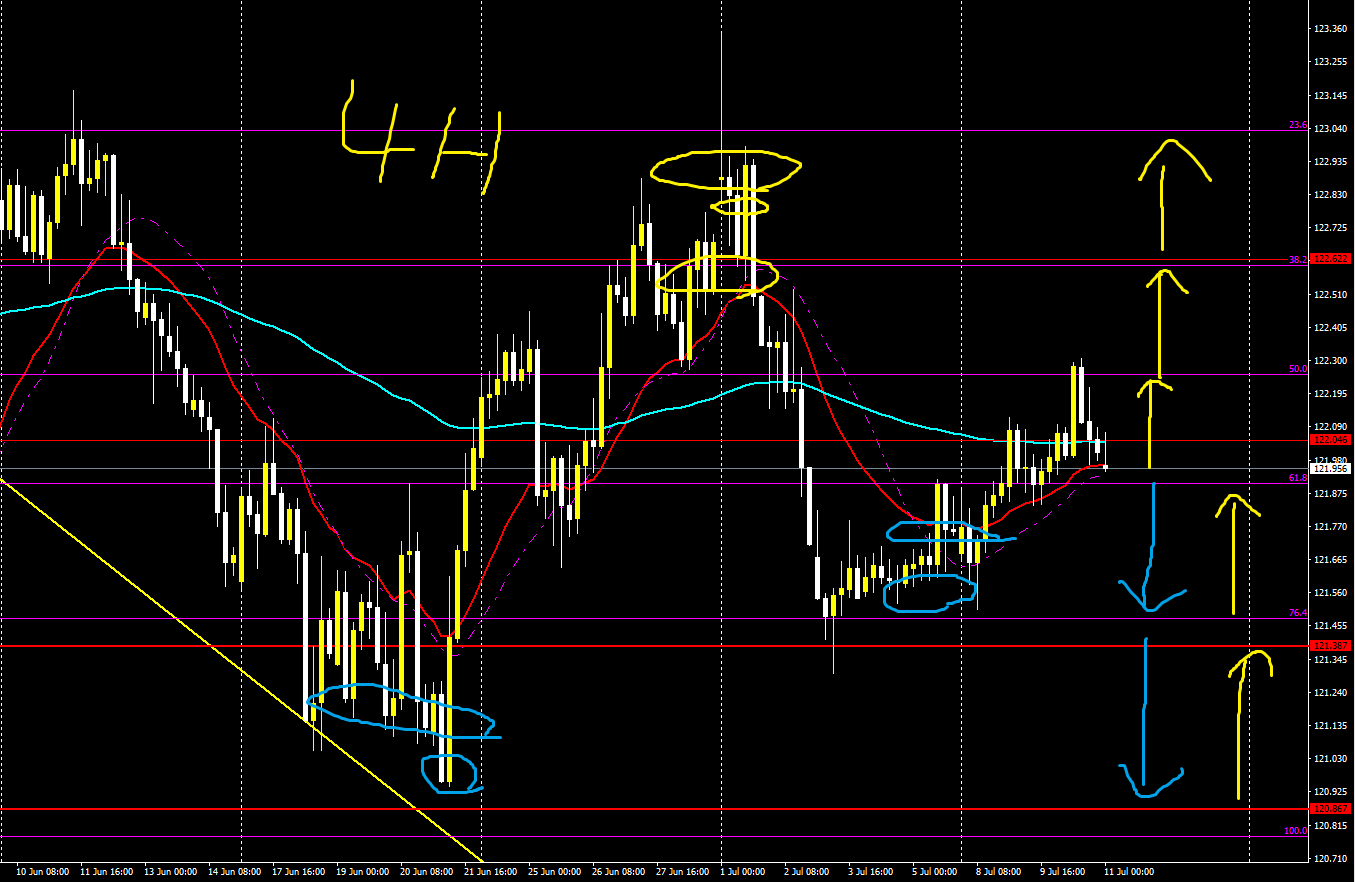
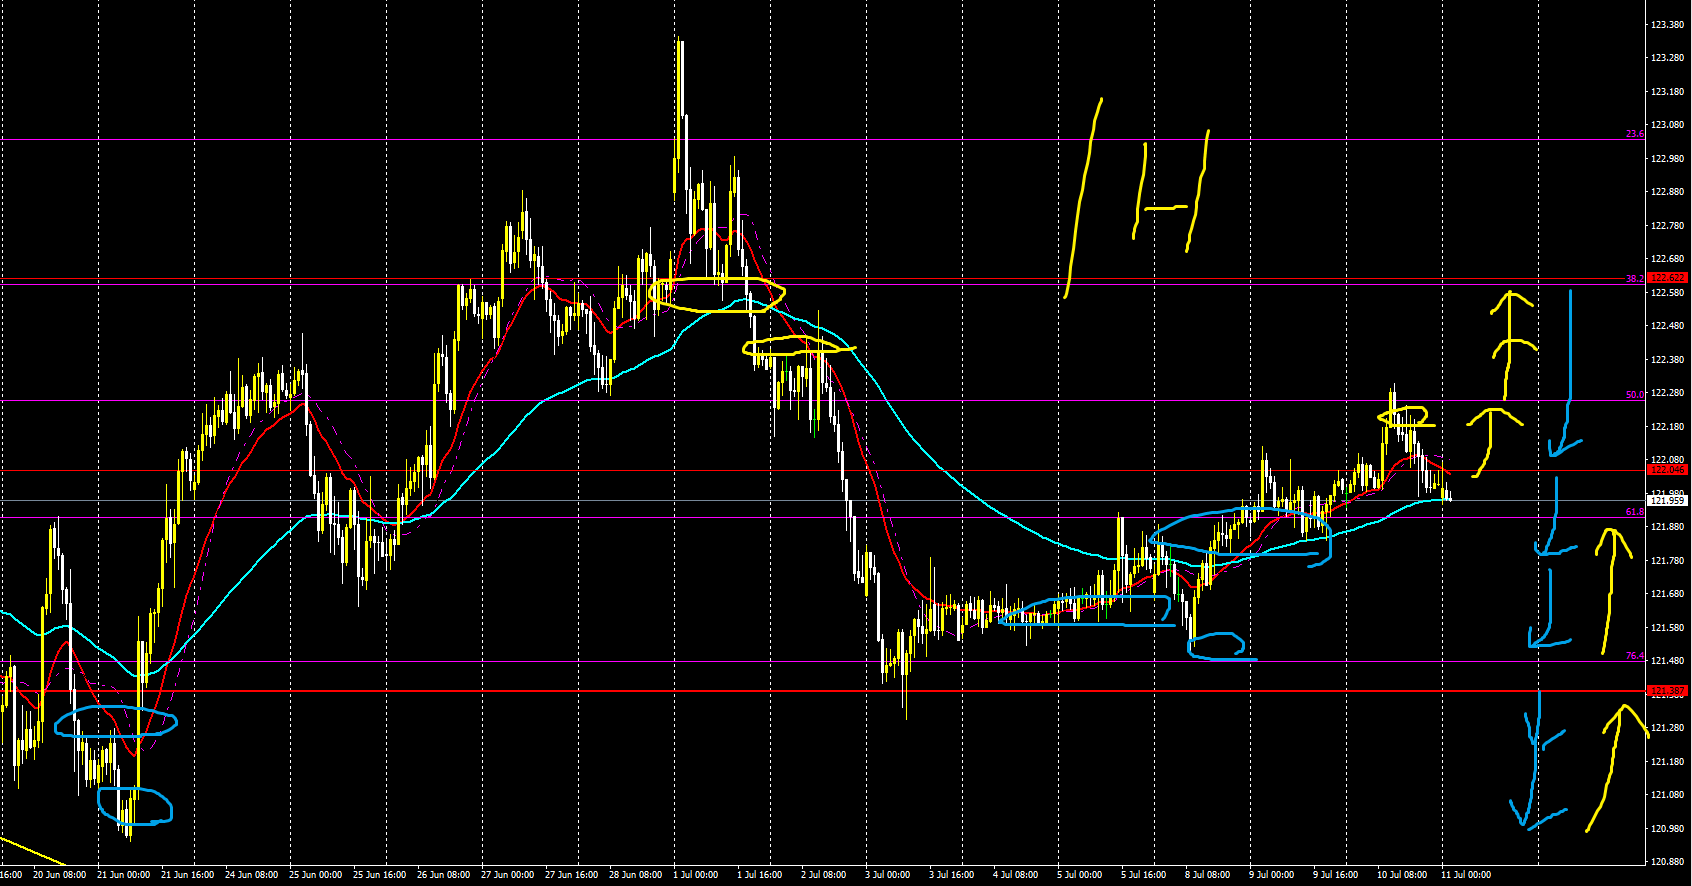
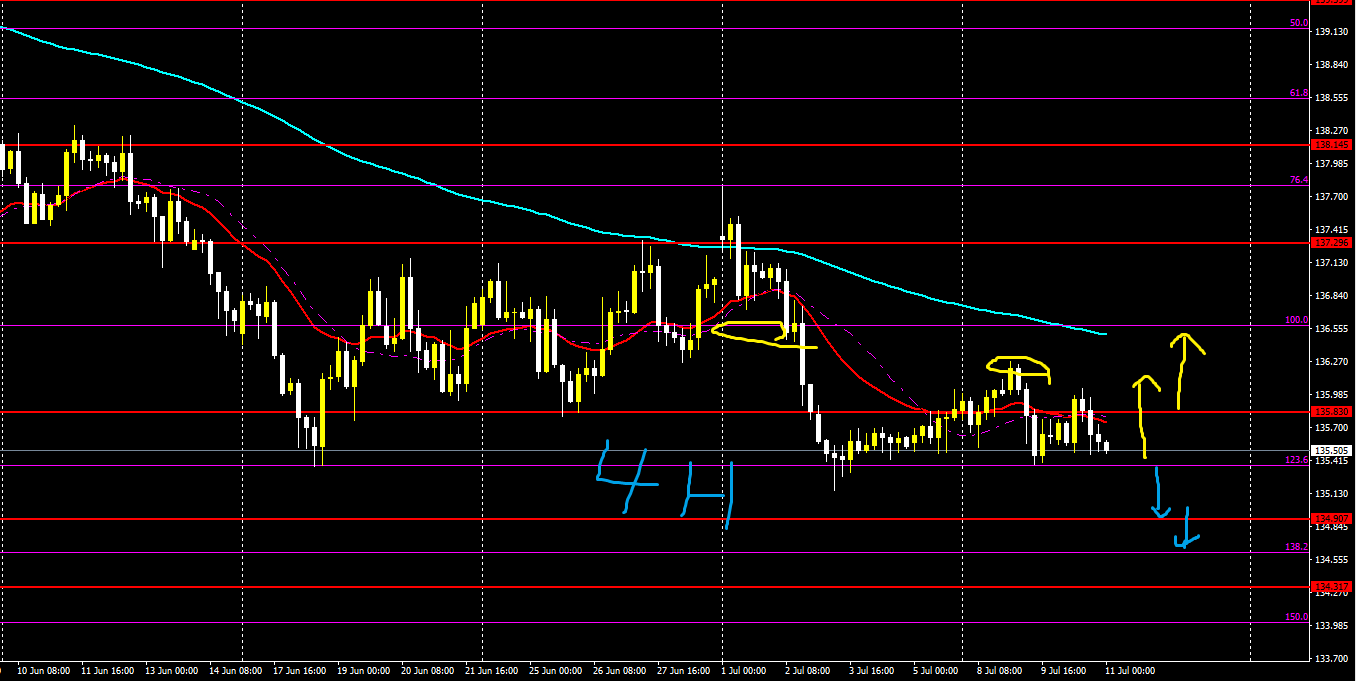
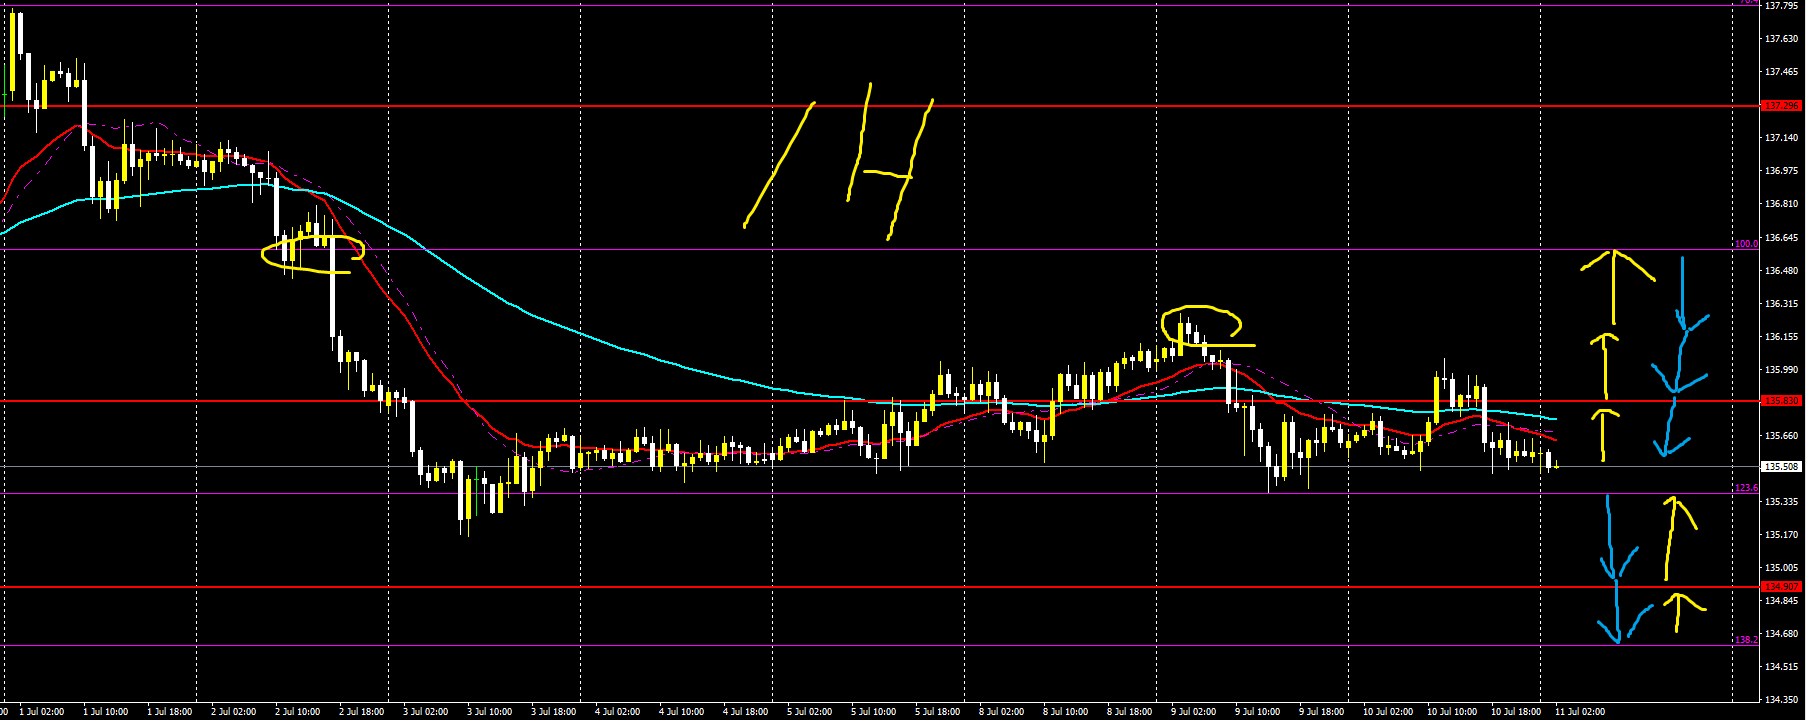
【Dollar/Yen (USDJPY)】
Trading difficulty B+
Long-term outlook is down, short-term is up
It has broken below the short-term moving average, suggesting further selling may occur on the 4-hour chart
If that happens, up to around the Fibonacci 100 zone
Support may be found at the daily chart MA or the levels below it, leading to buying
If so, consider buying toward Fibonacci 76, 61, or the most recent highs
4 hours
1 hour
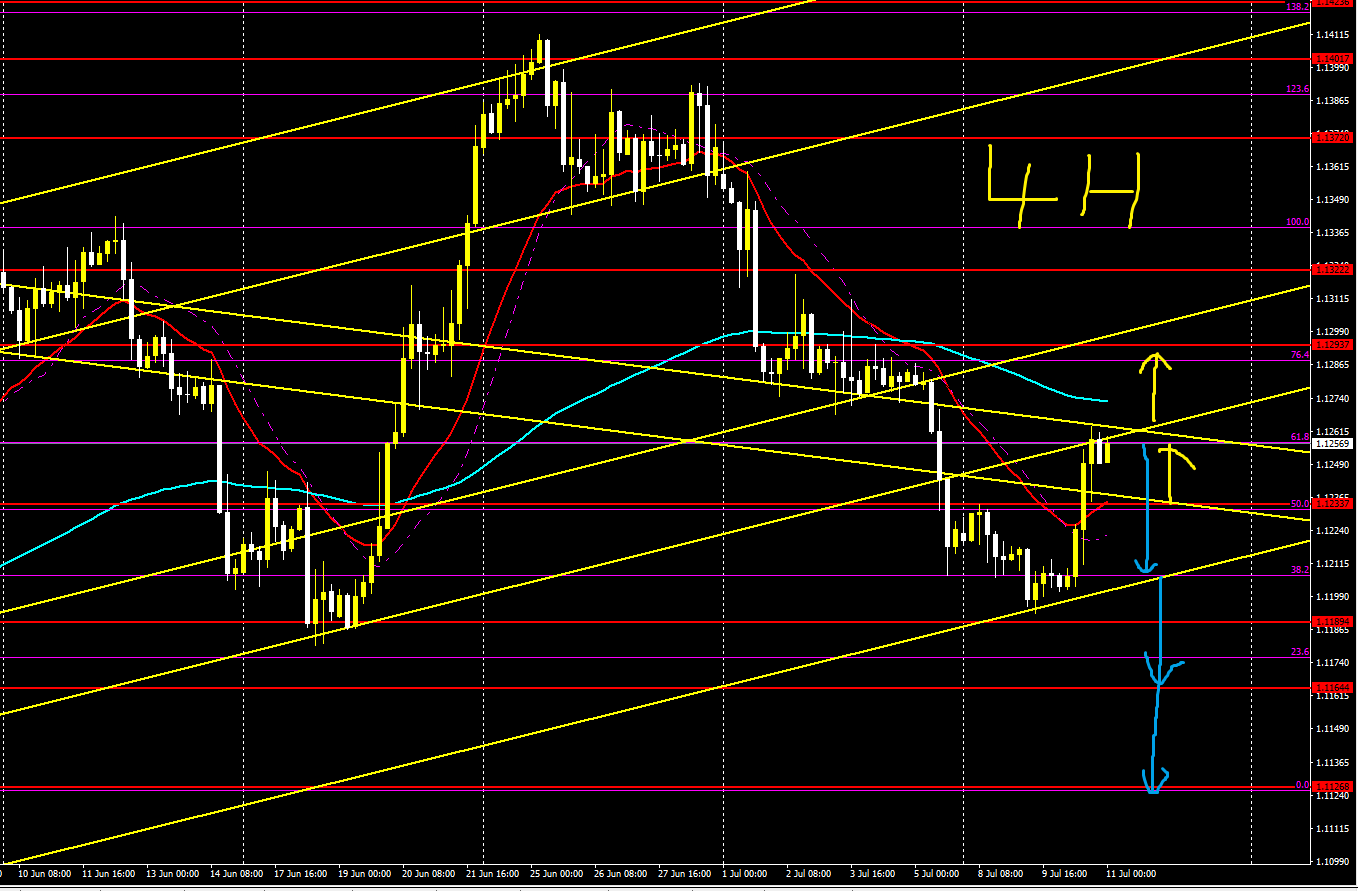
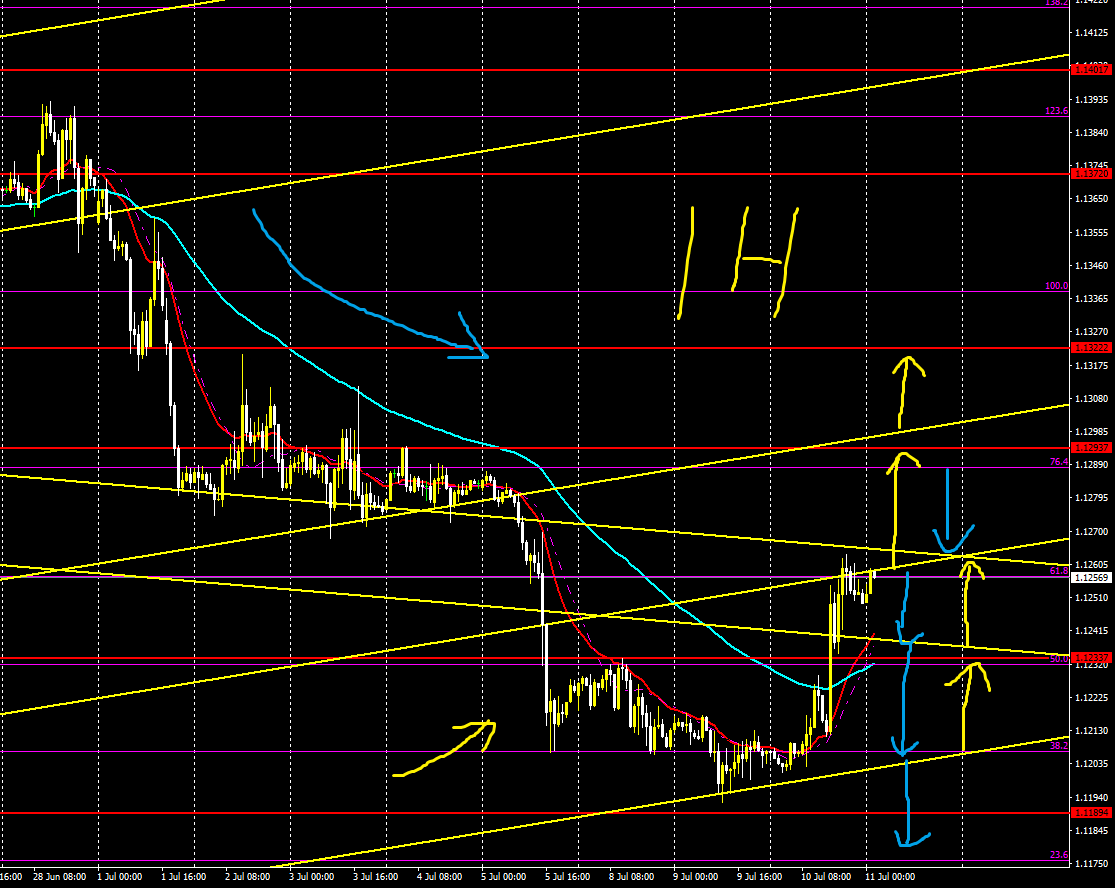
【Euro/Dollar (EURUSD)】
Trading difficulty A−
Long-term is up, short-term is down
Currently positioned above the short-term moving average
Selling may occur, targeting Fibonacci 50 and 38
If the recent low is breached, aim for Fibonacci 23 and lower levels
Buying near Fibonacci 76
4 hours
1 hour
Euro/Yen (EURJPY)】
Trading difficulty B+
Long-term outlook is down, short-term also down
In a range
Decide whether it will break above Fibonacci 50 or 61
If it buys up to 50 and then breaks below 61, you may consider selling on lower timeframes
4 hours
1 hour
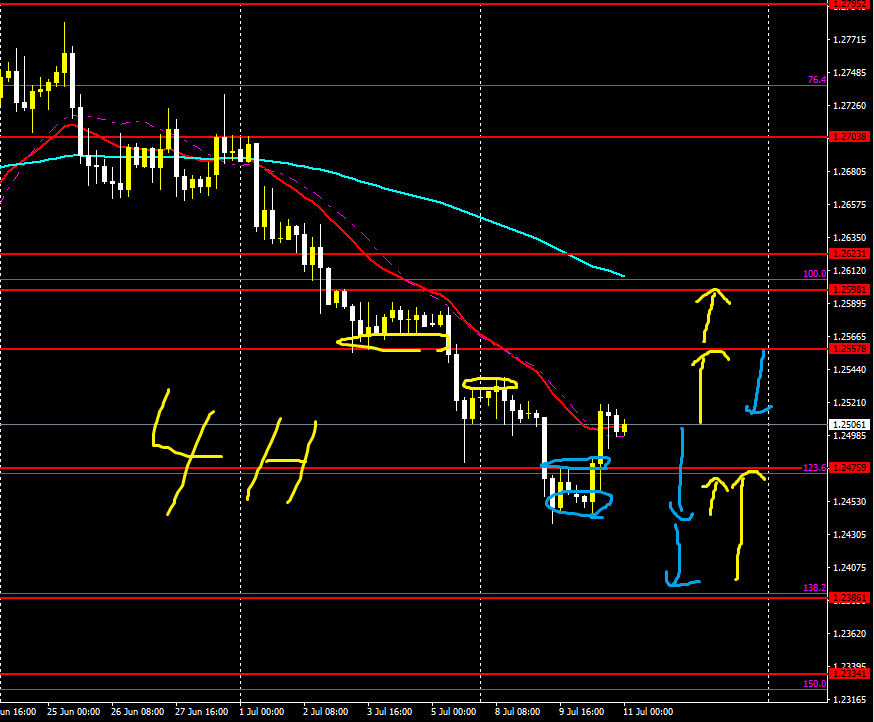
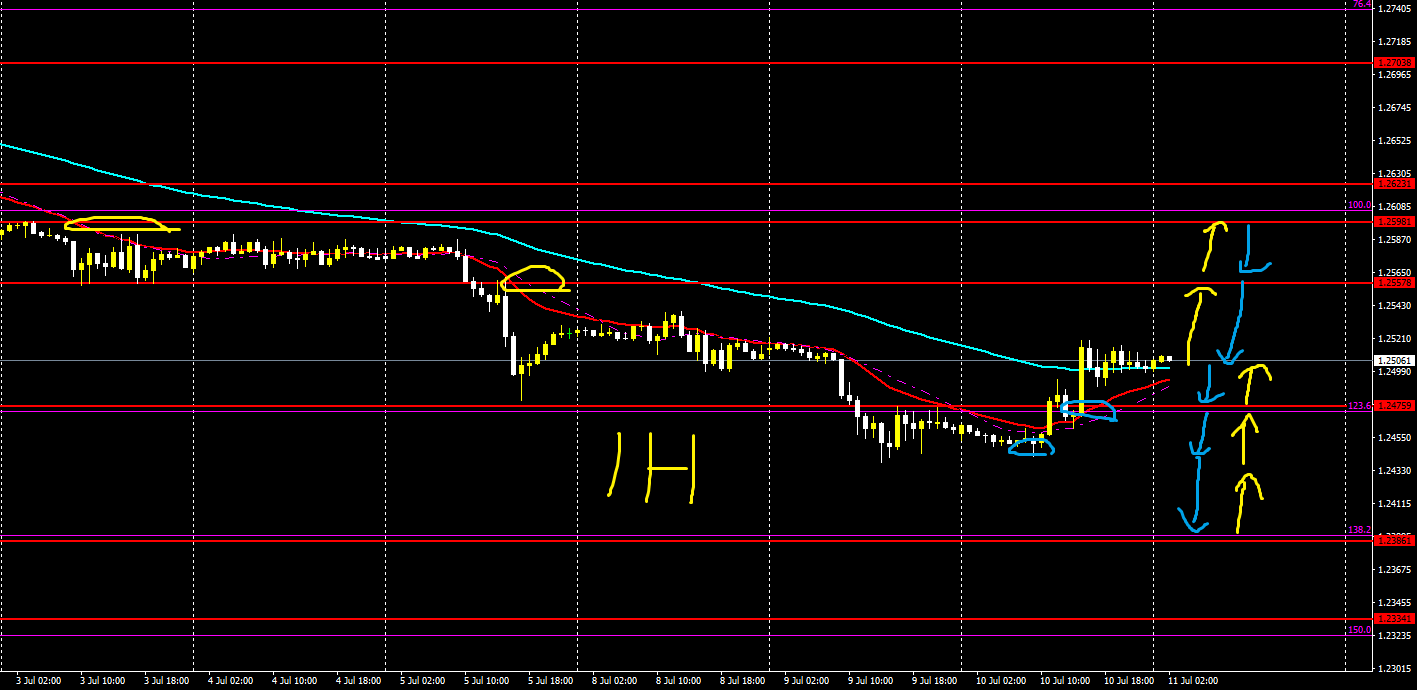
【Pound/Dollar (GBP/USD)】
Trading difficulty A−
Long-term is down, short-term also down
Currently near strong support, so buying potential exists
Appears forming a double or triple bottom
Around the January flash crash levels
However, it has become a mean-reversion market
Rely on moving averages, Fibonacci levels, and price lines for breakout or pullback trading
4 hours
1 hour
【Pound/Yen (GBPJPY)】
Trading difficulty B−
Long-term is down, short-term also down
Want to sell, but be wary of potential buying
If selling, look toward Fibonacci 138 or 150 vicinity
Buying toward recent highs or Fibonacci 100
Reference both with arrows
4 hours
1 hour
【Afterword】
The arrows drawn in the image indicate the dominant direction
Yellow indicates up direction
Light blue indicates down direction
However, it only indicates relative advantage in that direction; it does not guarantee a reaction or bounce at that rate
Nevertheless, since arrows are drawn near key levels, please use them as参考 for trading
The arrows may become take-profit or stop-loss points
And please refer to lines and Fibonacci for take-profit, stop-loss, and entry points as well
Weekly market forecasts and strategies are broadcast on YouTube, and they are usually fairly accurate
What matters is how you apply them to trading and entries
When market strategies align or don’t, your trading methods and thinking will differ
And please treat entries as a separate matter


