Understanding "RSI" by Iwamoto Max: Part 4 [Max Iwamoto]
Profile of Max Iwamoto

Keisuke Iwamoto. As the nickname “Certification of a technical analyst with a middle school education,” he is a rare no-education in the analyst industry. Even in an era where educational background remains highly valued, he daily battles in the FX market, which has nothing to do with such background. With the feeling of “now that anyone can easily start FX, I want you to acquire the skills to continue winning steadily,” he serves as a writer for series and as a seminar lecturer.
*This article is a reprint/edit of a FX攻略.com article from November 2018. The market information stated in the main text may differ from the current market, so please note this.
Focusing solely on RSI to catch buying/selling timing
In this final installment, we will explain trading signals that are not widely known, such as “failed swing” and “chart formations.”
First, the failed swing. Swing generally means swinging a bat or golf club, but in the market world, a swing refers to a wave or move formed over a certain period of time. A sequence of movements like “rise followed by fall” or “fall followed by rise” is called a swing.
A failed swing, on the other hand, is when you enter based on RSI movements rather than charts. Specifically, it is when RSI fails to make a new high as price rises, or RSI fails to make a new low as price falls (Figure ①).
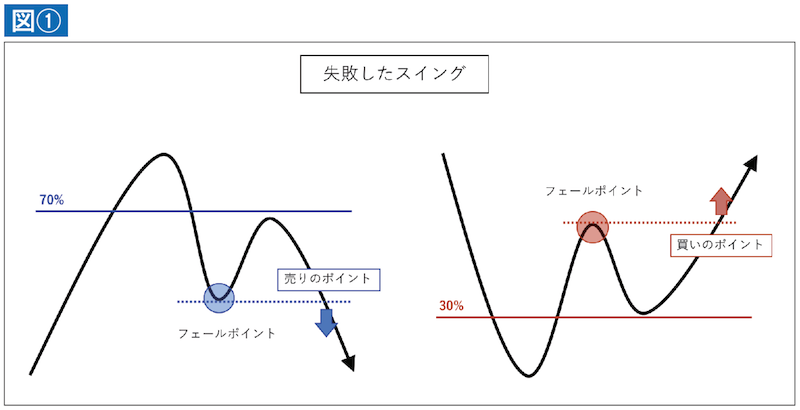
A sell signal occurs when RSI breaks above the 70% line, then pulls back and rises again but fails to make a new high, forming a failure point. The entry timing is when RSI breaks below the latest nearby low level. Conversely, a buy signal occurs when RSI breaks below the 30% line, rises again but fails to make a new low, and rebounds. The entry timing is when RSI breaks above the latest nearby high level.
The key point is that a failed swing must exceed the 70% line or drop below the 30% line before it is confirmed. On this point, the developer W. D. G. (Wilder) also states in his book that “a failed swing confirmed after breaking the pivotal levels (30% and 70%) is a strong signal that the market will reverse.”
Now, let's look at actual chart examples.