

Future market outlook, strategies and opportunity currencies (from 7/9)
Hello, this is OnePi Streak (@onepipst)
From 7/9, I plan to forecast market trends, outline strategies, and look for entry points
I also tweet about profits and other useful things,so pleasefollow Twitter.
Table of contents
- USD/JPY (Dollar-Yen)
- EUR/USD (Euro-Dollar)
- EUR/JPY (Euro-Yen)
- GBP/USD (Pound-Dollar)
- GBP/JPY (Pound-Yen)
- Afterword
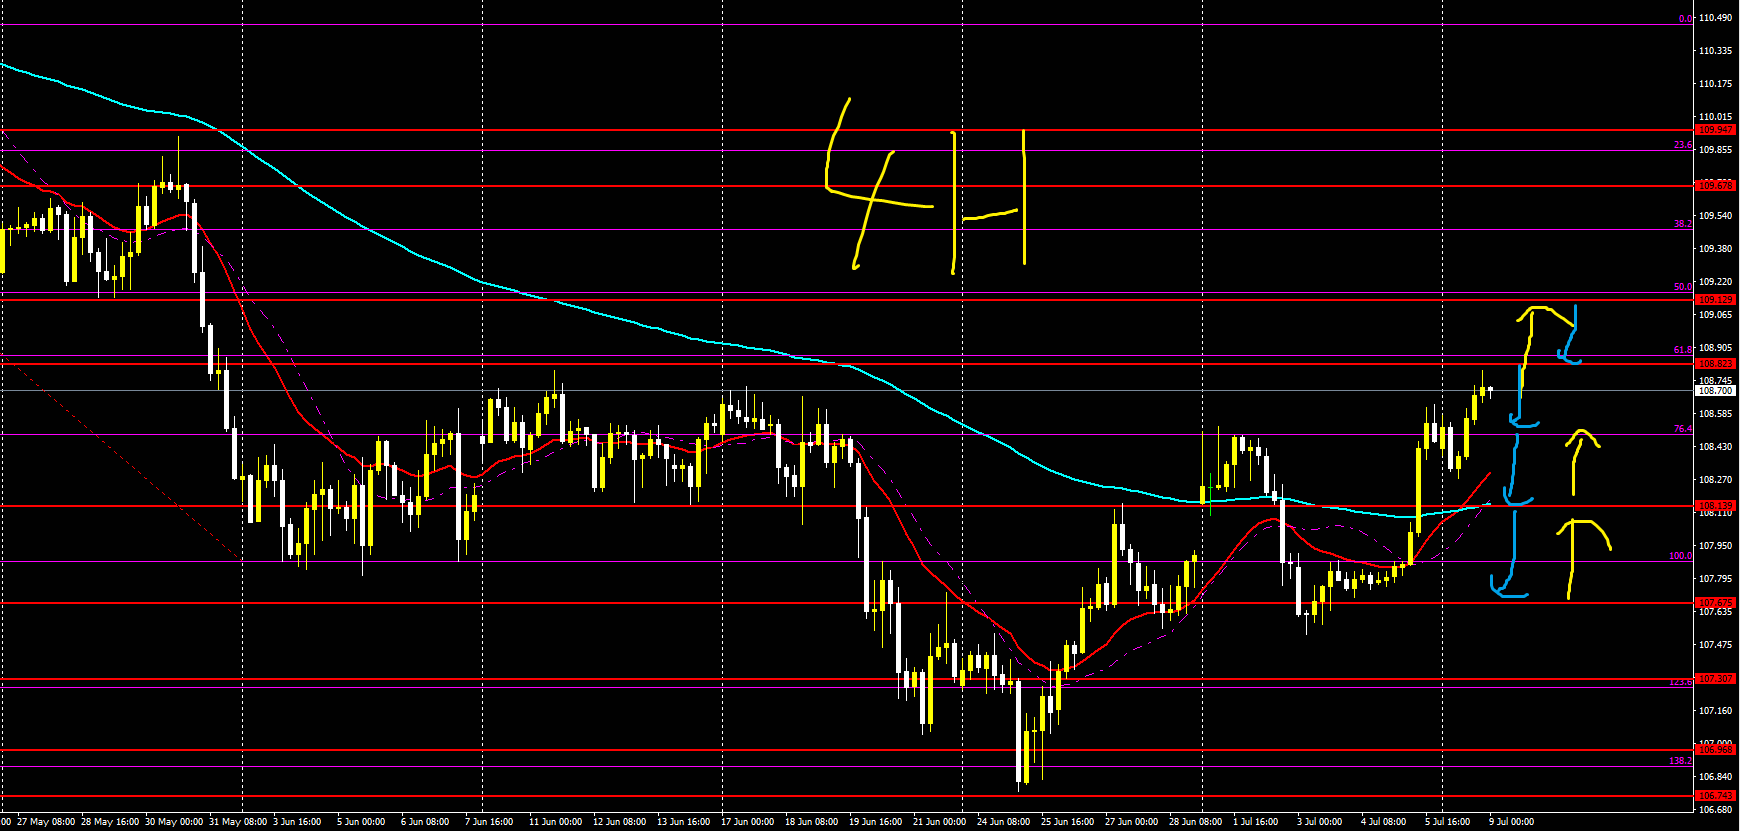
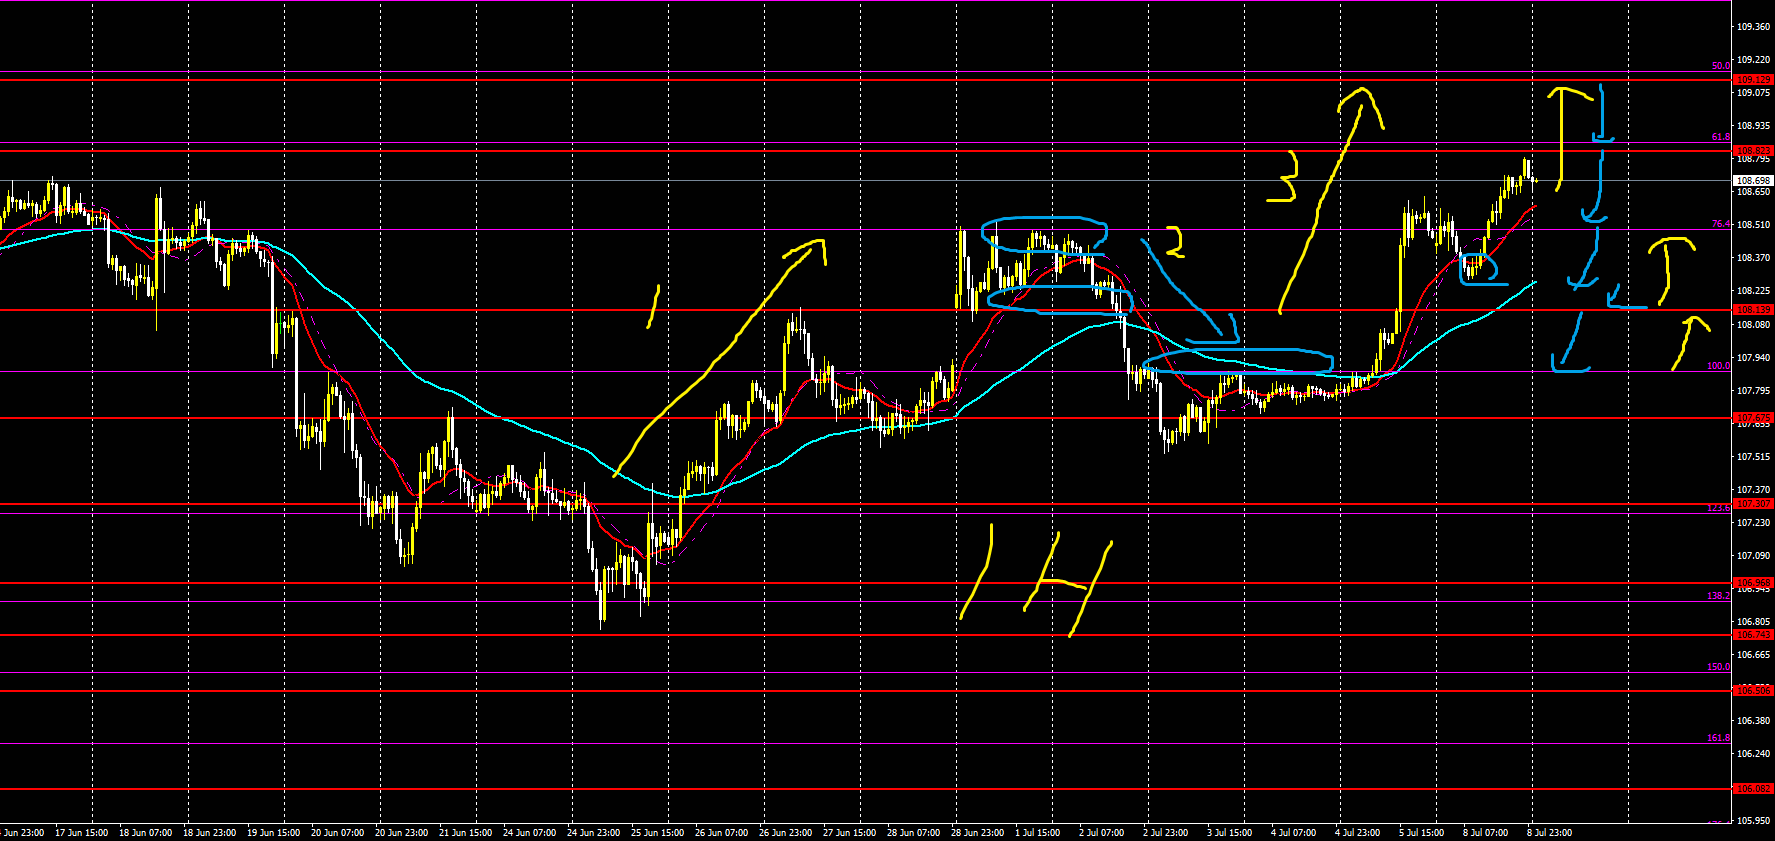
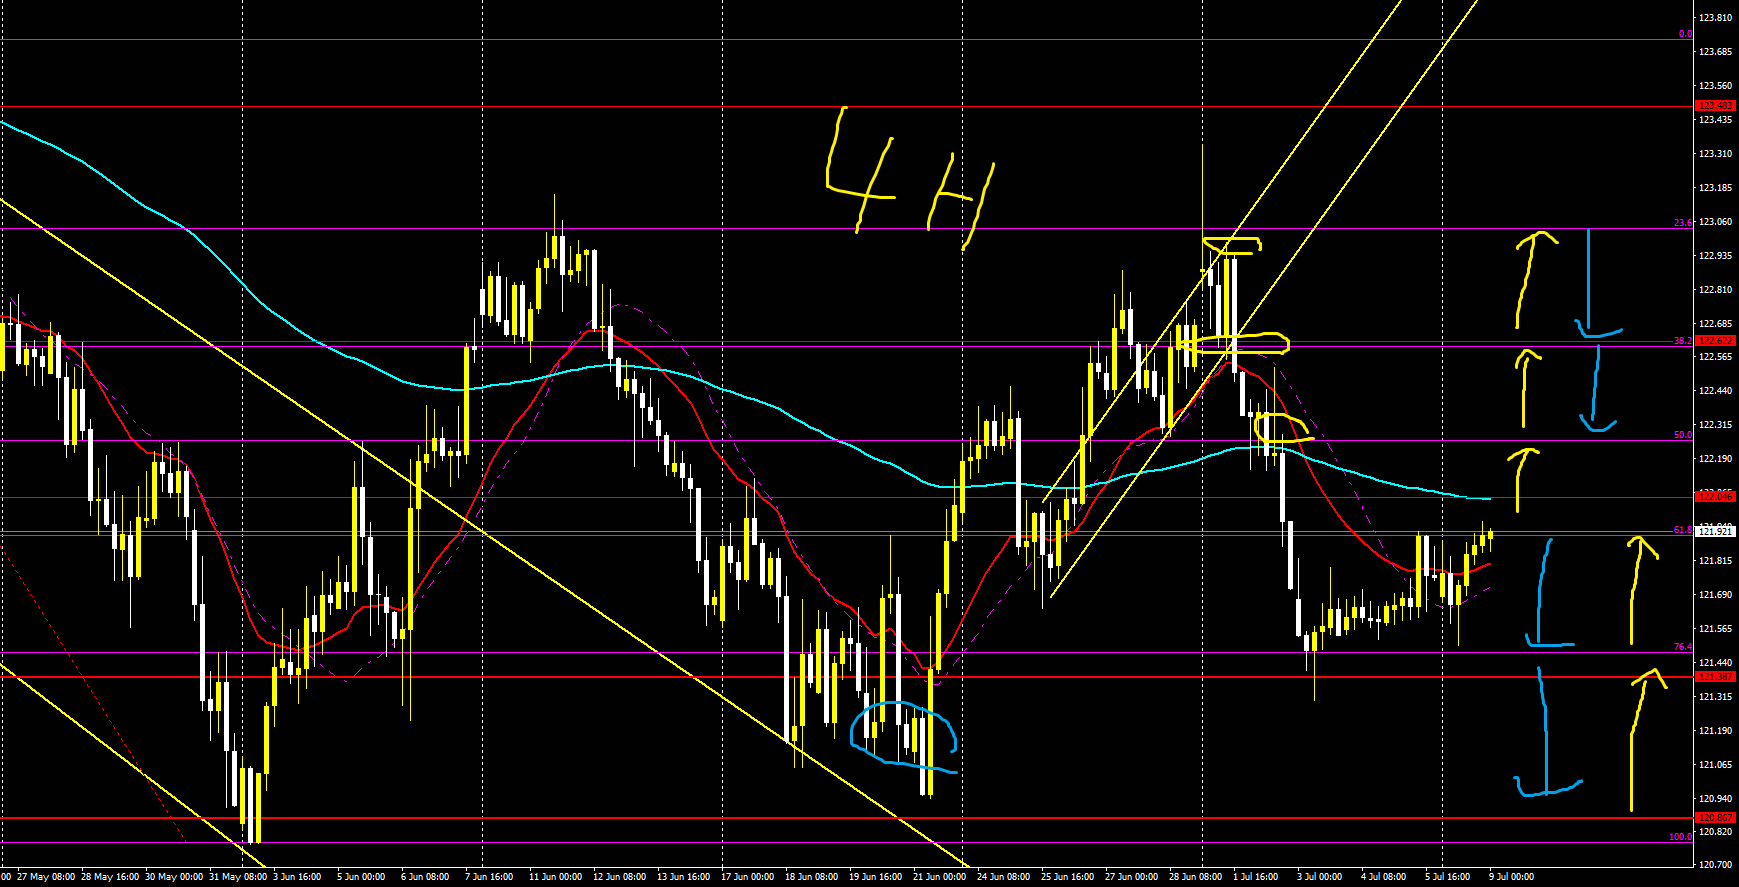
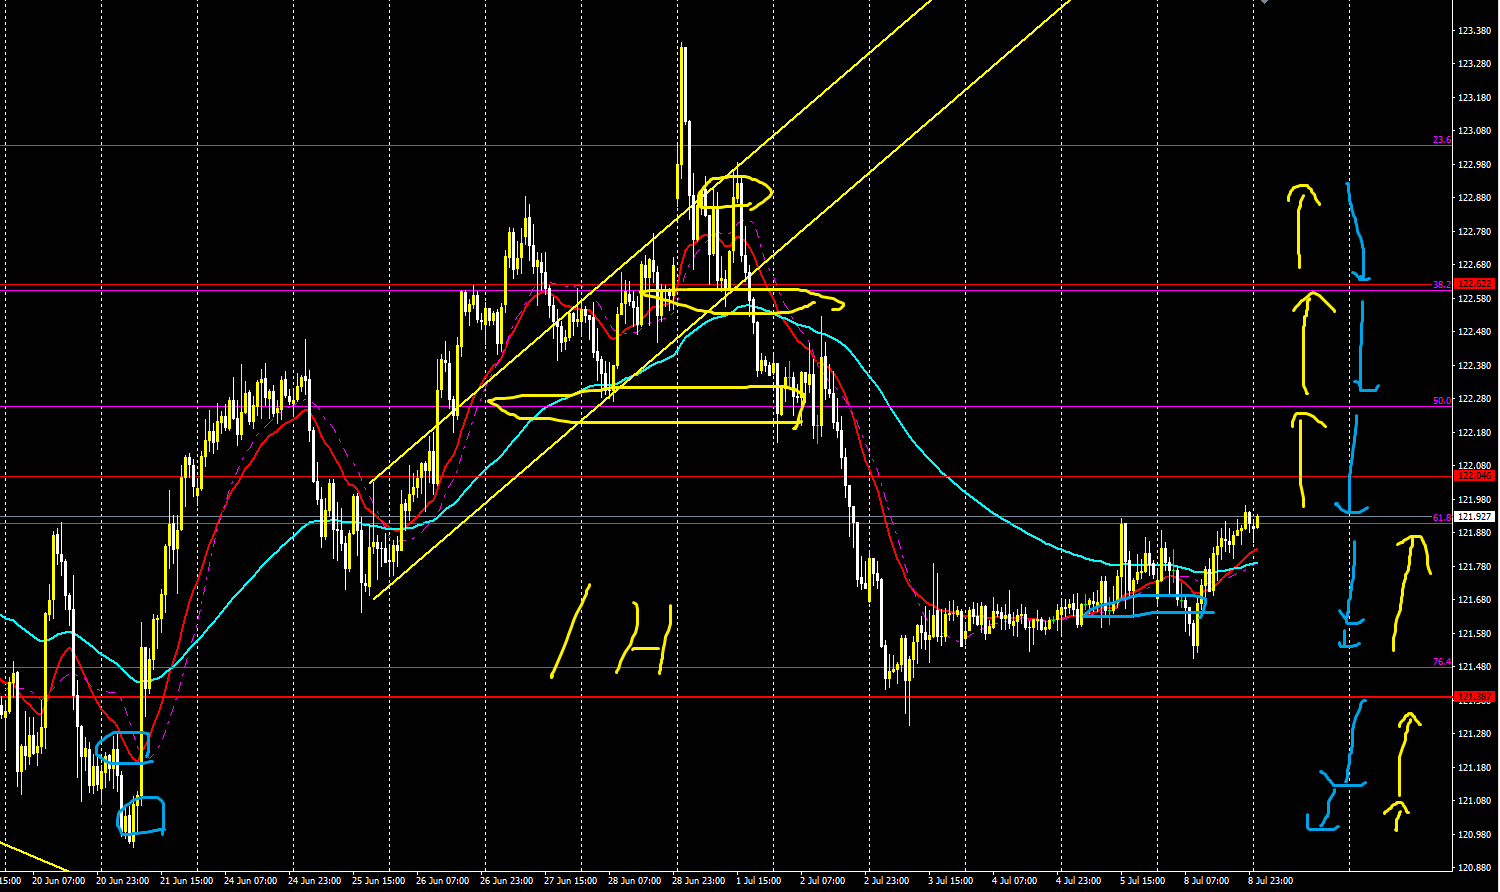
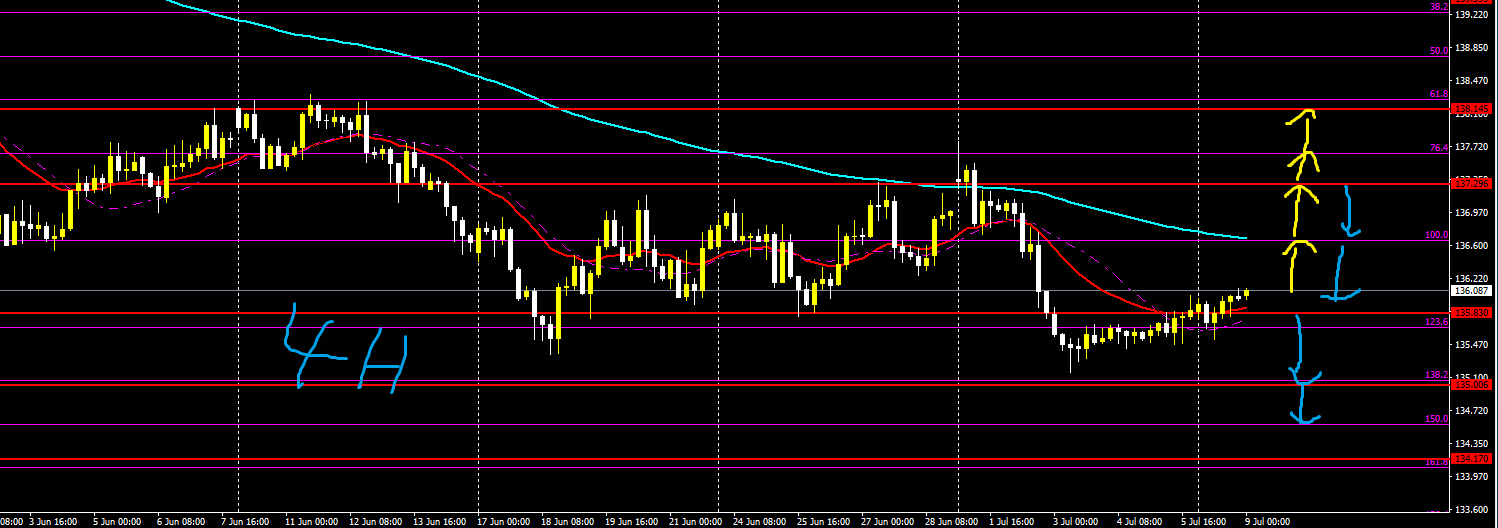
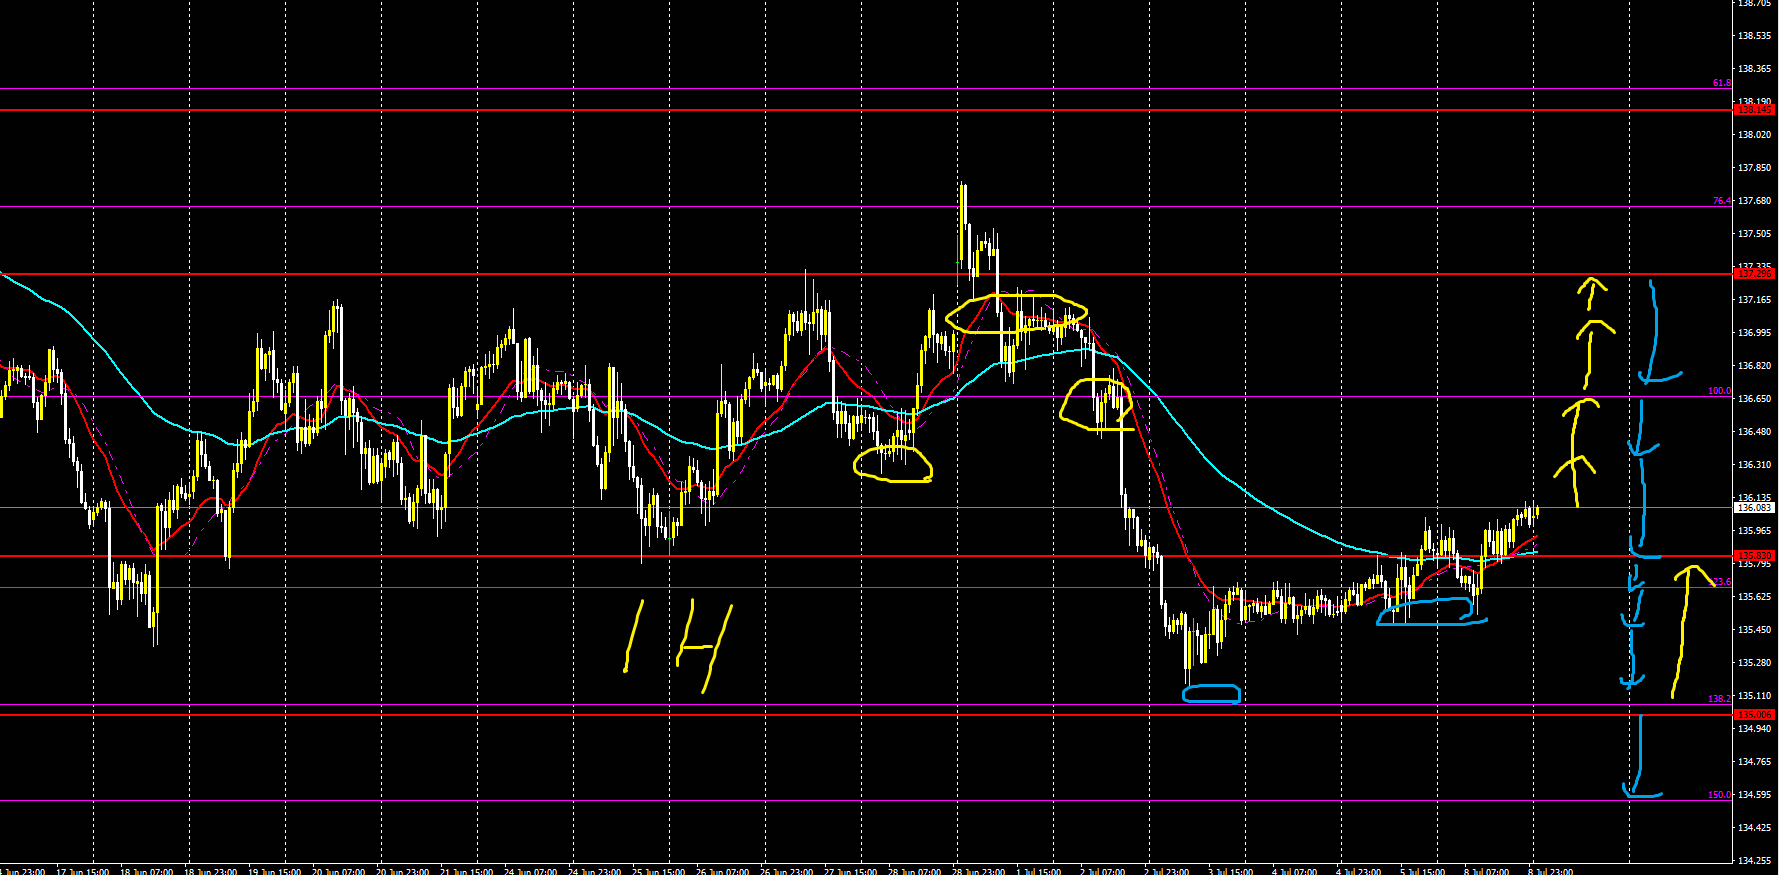
【USD/JPY】
Trade difficulty A-
Long-term outlook is down, short-term is up
Currently rebounding near the Fibonacci 61, there may be selling pressure
Since this is a move to pull back, we should attack with sells at that time
Watch the Fibonacci 76 and the lines below, or the Grand Velma (MA) line
If it presses, we should win
It’s also possible it rises without a pullback
Target is Fibonacci 50
4 hours
1 hour
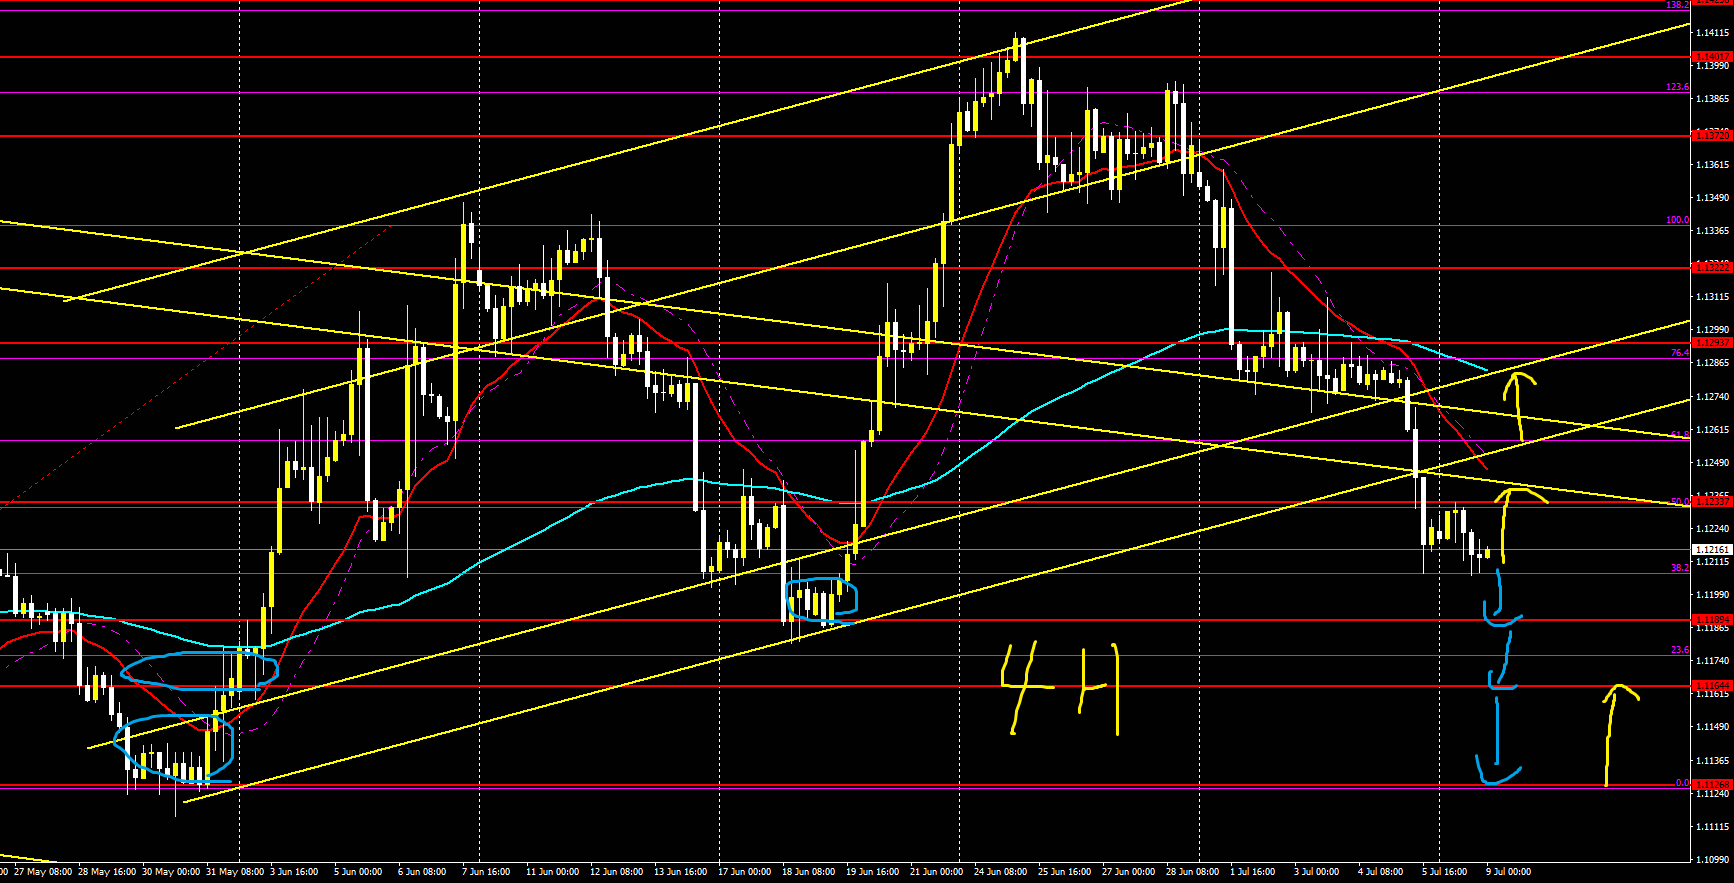
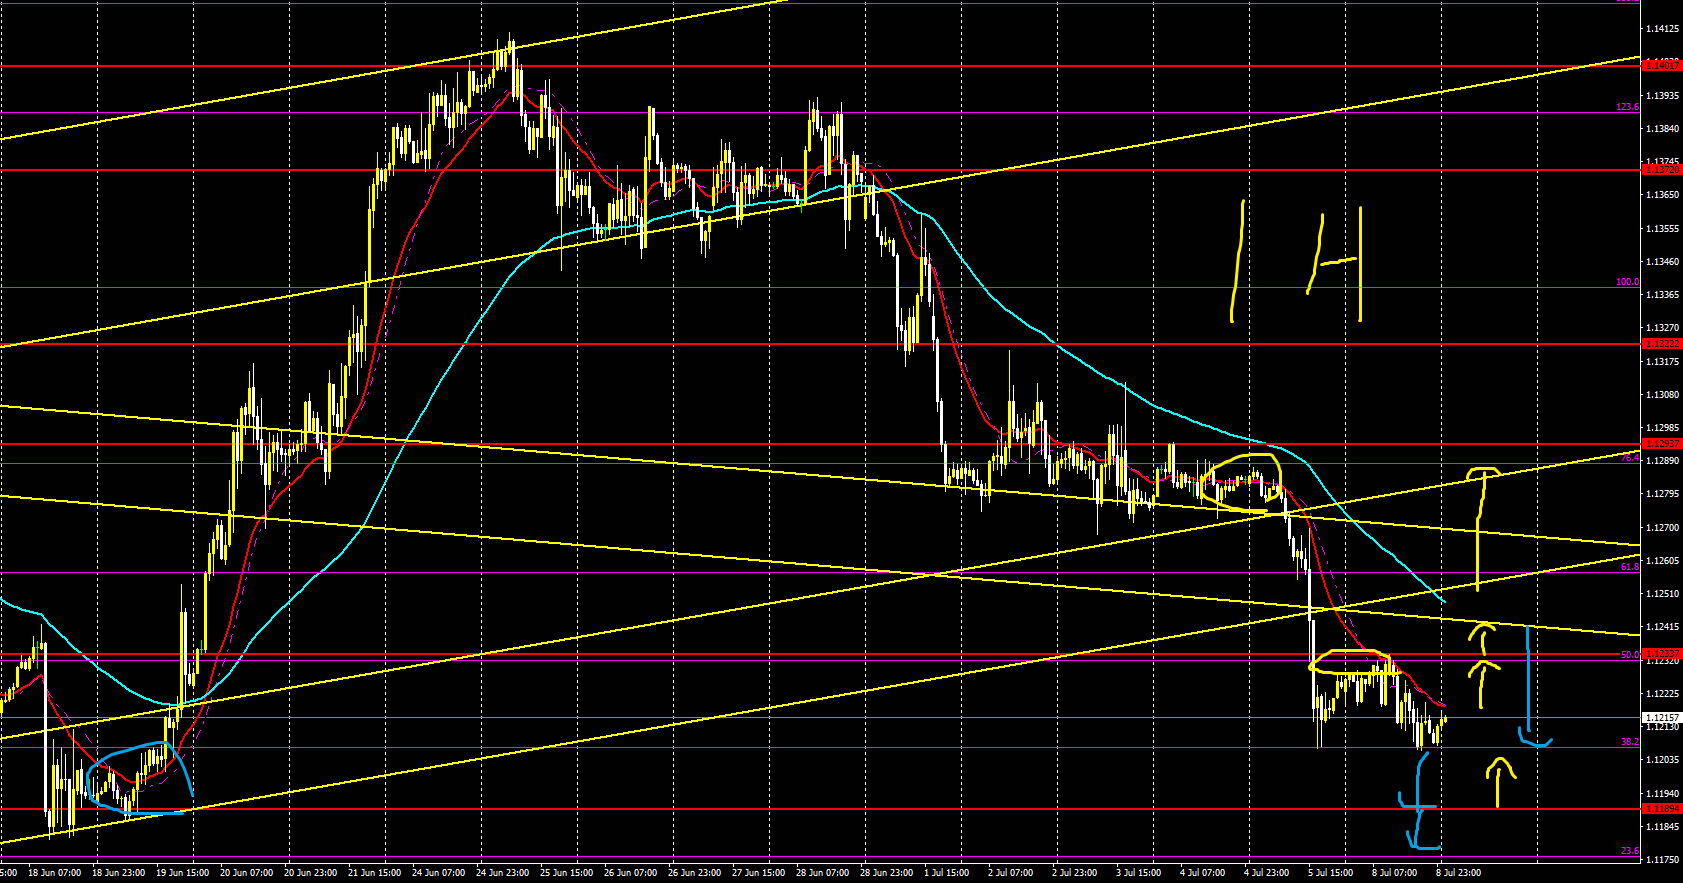
【EUR/USD】
Trade difficulty A-
Long-term outlook is up, short-term is down
Range-bound
Whether this range breaks to the downside or retraces upward
If selling, follow Fib levels and lines
Safe just above 0 for the maximum loss
When it retraces, anticipate Fibonacci 61 or 76
If positioned above MA, it may be safe to take profits
4 hours
1 hour
EUR/JPY】
Trade difficulty B+
Long-term outlook is down, short-term also down
Strategy: buy up to Fibonacci 50, sell up to Fibonacci 76
If it continues to rise, buying up to Fibonacci 50 could be good
From there, selling may come in
If buying does not come in, and you sell, target half of Fibonacci 76 or up to 76
4 hours
1 hour
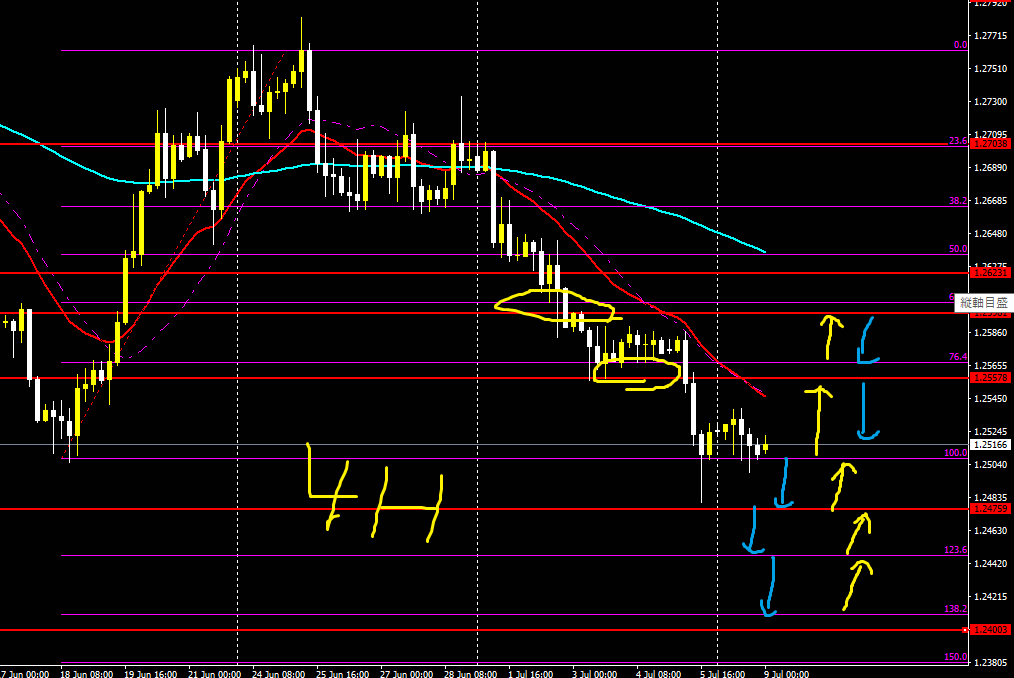
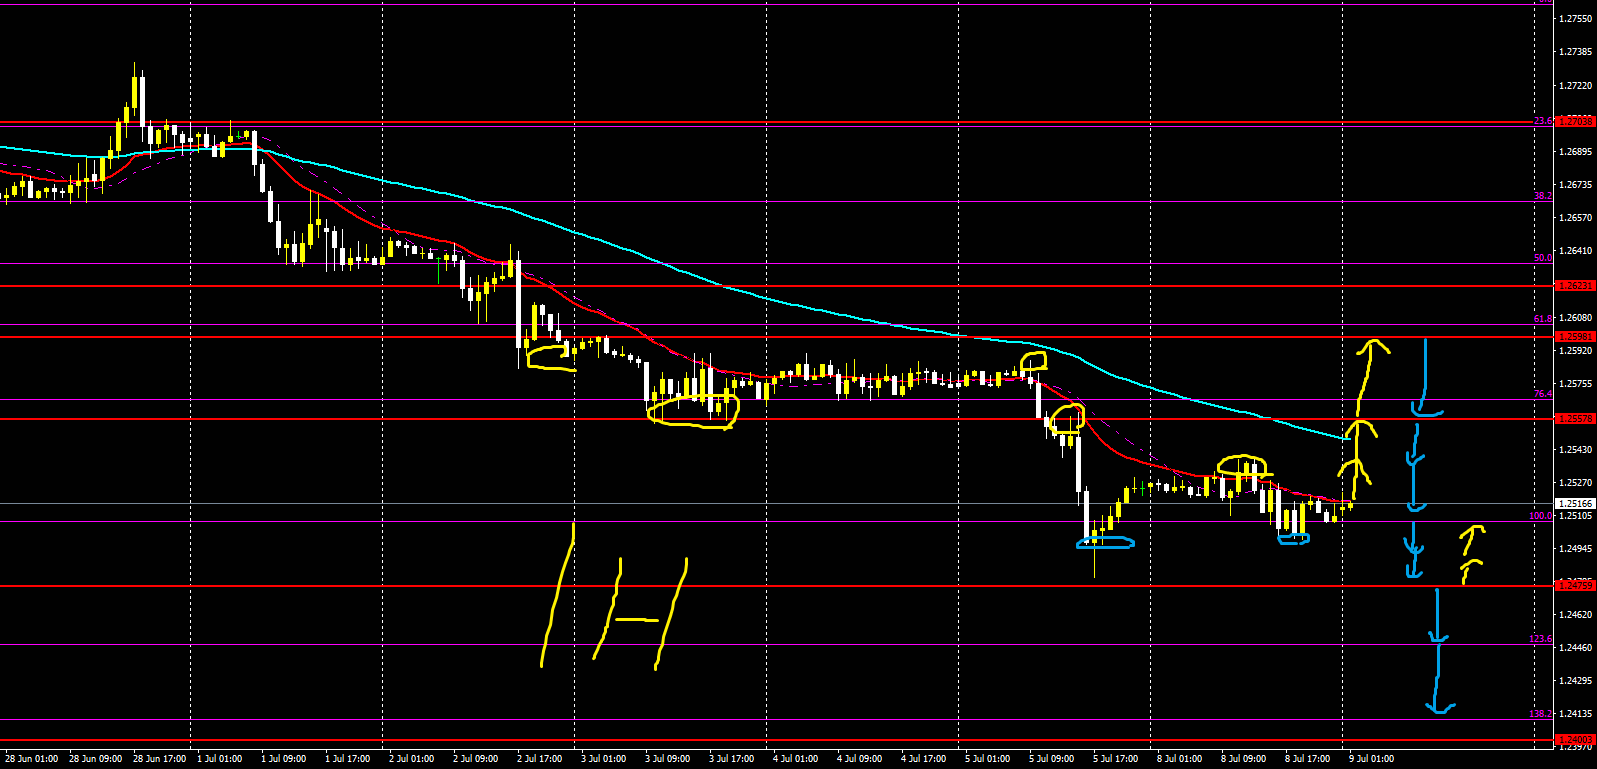
【GBP/USD】
Trade difficulty B+
Long-term outlook is down, short-term also down
Currently near strong support, so buying pressure may come
It might be good to buy using lines or Fibonacci as reference
For now, Fibonacci
Consider selling on rallies or with a support break
This is safer with a trend-following approach
4 hours
1 hour
【GBP/JPY】
Trade difficulty A-
Long-term outlook is down, short-term also down
If retracements occur within the Fibonacci 120–100 range, trade within that range
There may be buying near 100
Watch return selling and MA relationships for trades
4 hours
1 hour
【Afterword】
The arrows drawn in the image indicate the dominant direction
Yellow is upward
Light blue is downward
But that only indicates there is an edge in that direction; it does not guarantee the rate will react or rebound exactly there
However, since arrows are drawn near key levels, please use them as a reference for trading
Arrows may become profit-taking or stop-loss points
And lines and Fibonacci can similarly serve as reference for profit-taking, stop-loss, and entry points
Weekly market forecasts and strategies are usually accurate on YouTube
What matters is how you apply them to trading and entries
When market strategies are correct, it may differ in how you trade or think
And please consider each entry as a separate thing


