Learn how to create buy/sell plans from a currency exchange broker | The 20th installment: incorporating the concept of three waves into USD/JPY market analysis (13) [Toshiro Asano]
Mr. Toshiro Asano shares a sales and purchase method and market view-building know-how backed by his own experience and knowledge in this book project. As before, he will continue to interpret the recent and future USD/JPY market and then present the optimal trading plan.
※This article is a reprint and revised edition of an article from FX攻略.com December 2018 issue. Please note that the market information written in the text may differ from the current market.
Toshiro Asano Profile

Asano Toshiro. He has worked at Tokyo Forex Co., Ltd., a foreign exchange brokerage within the Tōyō Short (Tokyo Short?) Group, and at EBS (now ICAP), a world leader with over 80% market share in foreign exchange trading, among others. He experienced historical markets firsthand, including the Plaza Accord of 1985, the subsequent era of strong yen, the bubble burst, and the euro introduction in 2000, to develop his market sense. He later founded two FX brokers and worked as a dealer for a private FX fund. Currently, he writes on the daily blog of the Investment School Group. He is also a strong advocate of easy-to-understand video works that leverage his skilled video editing.
Weekly Analysis Clearly Suggests an Uptrend
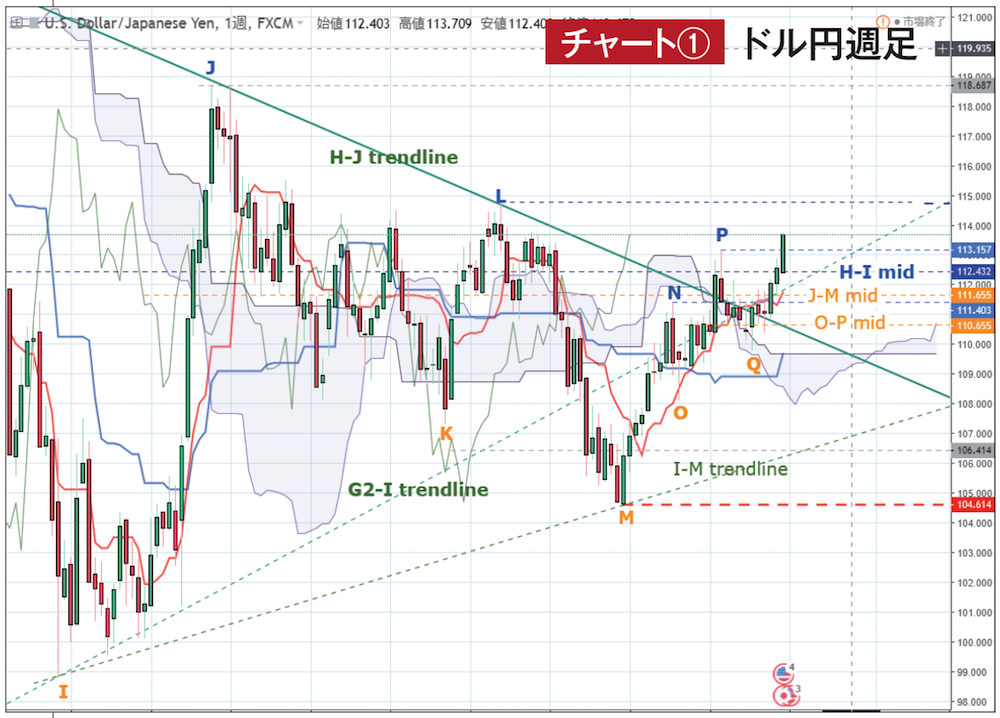
Chart ① Source:USDJPY chart according to TradingView
Before starting weekly analysis, I will first report the chart changes for this month (Chart ①). First, the time for the three waves M-N-O-P has elapsed, and we are now in a stage focusing on the three-wave pullbacks after P, so I added the lower point Q and will anticipate three waves M-P-Q-R or O-P-Q-R (in both cases, R is provisional) accordingly.
N and O have fulfilled their roles for now and should move from P to Q, but as mentioned above, since we need to view the three waves starting from O, we will keep them a little longer. Also, I removed I-Jmid, L-Mmid, and the downward trendlines, but given the current market can be viewed as a rising market starting from the low M, there is little point in looking at supports below unless we fall below the leading spread.
Now, since last issue (except for the week that formed a simultaneous line), the price has been rising from the low of Q with higher highs and higher lows, surpassing the important and heavy resistance at H-Imid of 112.43 yen, and last week closed with a bullish candlestick with no shadows, above that level, surpassing the recent high P and the year-to-date high. Once P is surpassed, both the transformation line and the standard line can actively rise, and the standard line will continue to move higher weekly until the targeted low moves to O, so the direction clearly indicates an uptrend.
Furthermore, while it took six weeks for the P-Q decline, the rise from Q to surpass P occurred in the same six weeks, so in the near term, the uphill trend is clearly dominant. With the time for M-N-O-P having elapsed, in the near term we will pursue the three waves O-P-Q-R and M-P-Q-R, but both still have plenty of time left, and the potential is strong.
The only concern—the decline after J—has not yet been definitively negated, as mentioned several times, but in fact, the time from J-K-L to M, which is the maximum time for the three-wave pattern J-K-L and the time after L, will be the same this week. Therefore, from now on we can focus on sideway movement or rise without assuming further declines. However, this timing is a major turning point, so there is a possibility of a heavy reaction for now.
From a consolidation perspective, in the near term we will see movement between L and M, and if you look only at this, the pace of the rise is indeed slower than the decline. Yet when viewed as a major upward wave I-J-M-R, there is time from M to up to I-M, so there may be no need for a sharp surge.