

Future market strategy (from 7/5)
Hello, this is One Piece Trade (@onepipst)
From 7/5, I would like to set up a market outlook and strategy and search for entry points
There is an employment statistics release tonight, so please pay attention and trade!!
I also tweet about profits and other useful things,so pleasefollow Twitter.
Table of contents
- USD/JPY (Dollar/Yen)
- EUR/USD (Euro/Dollar)
- EUR/JPY (Euro/Yen)
- GBP/USD (Pound/Dollar)
- GBP/JPY (Pound/Yen)
- Afterword
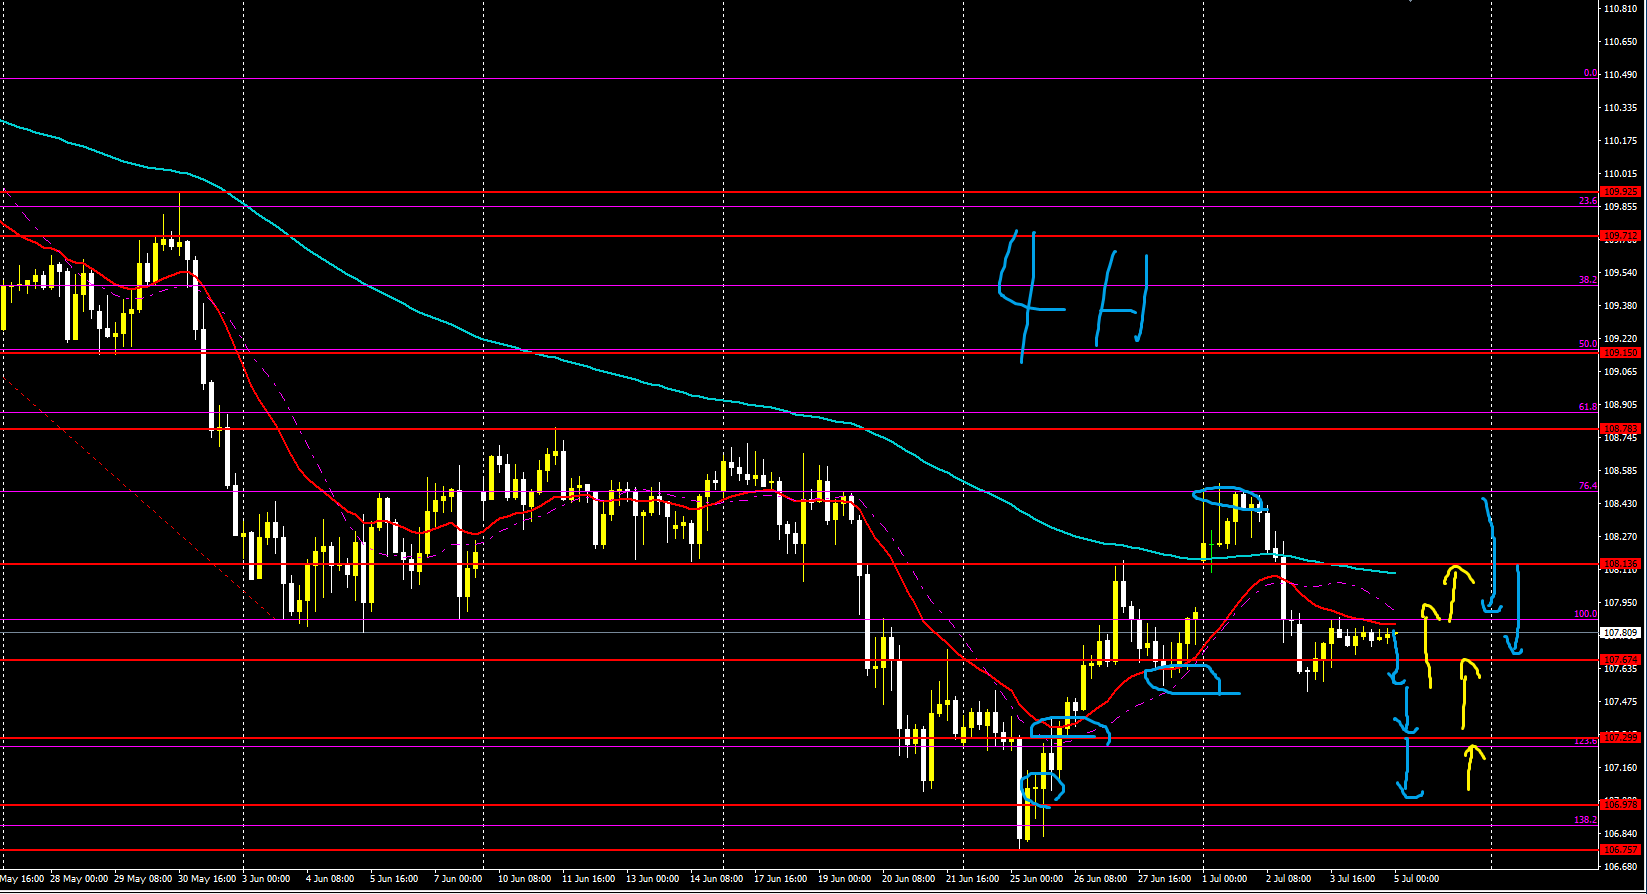
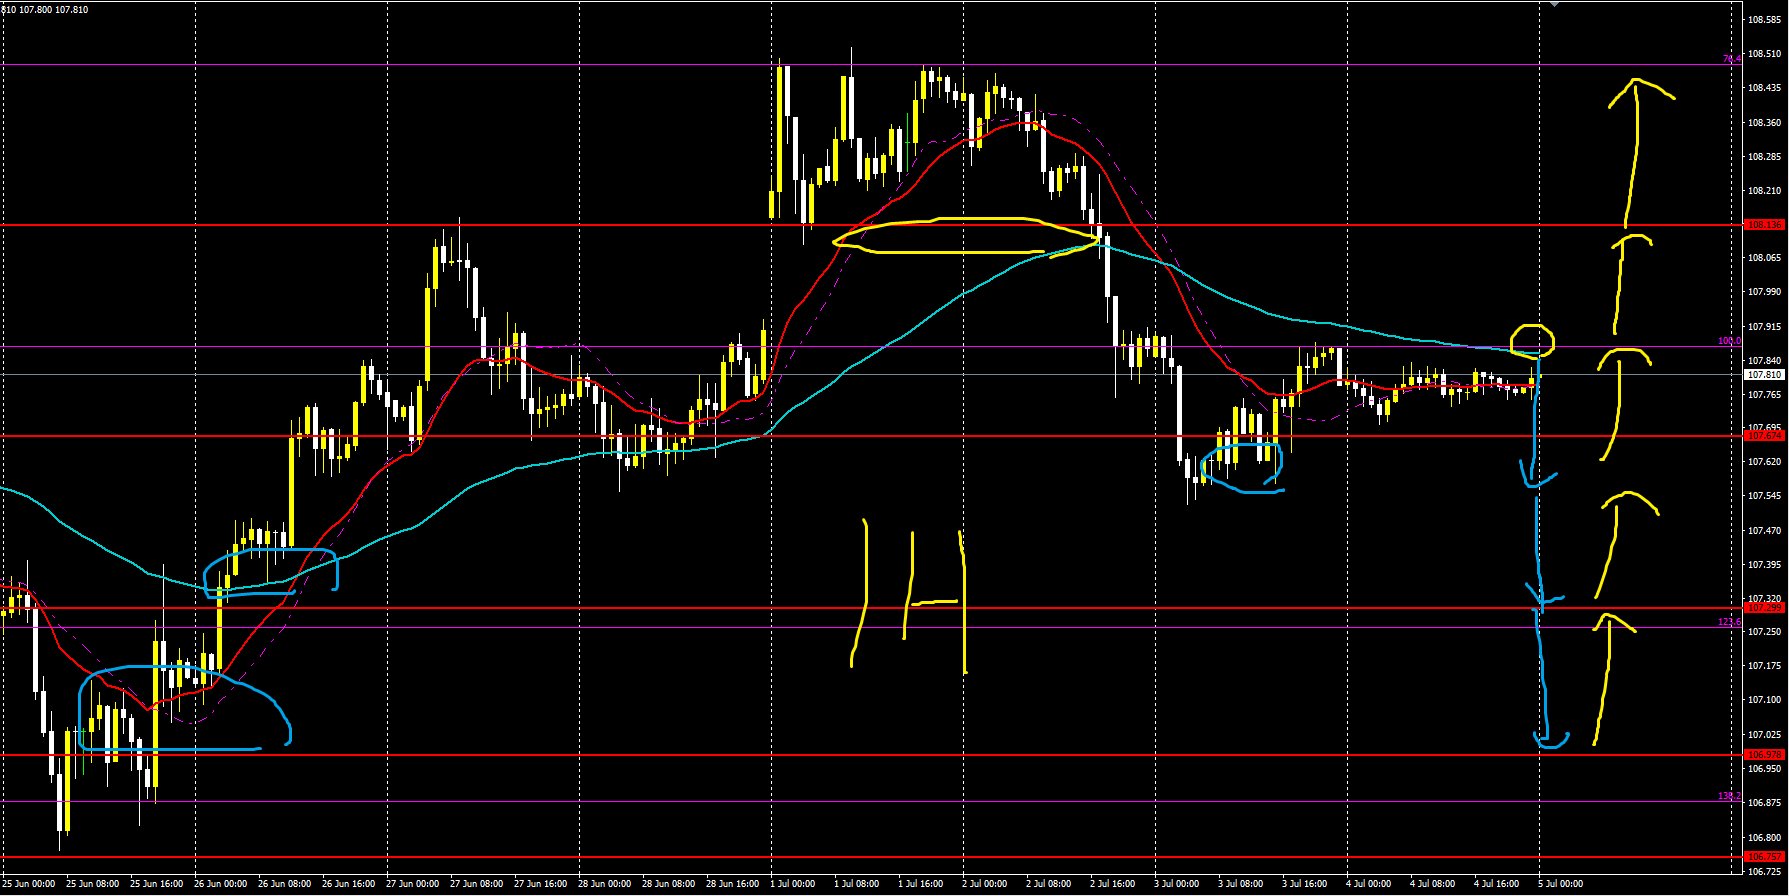
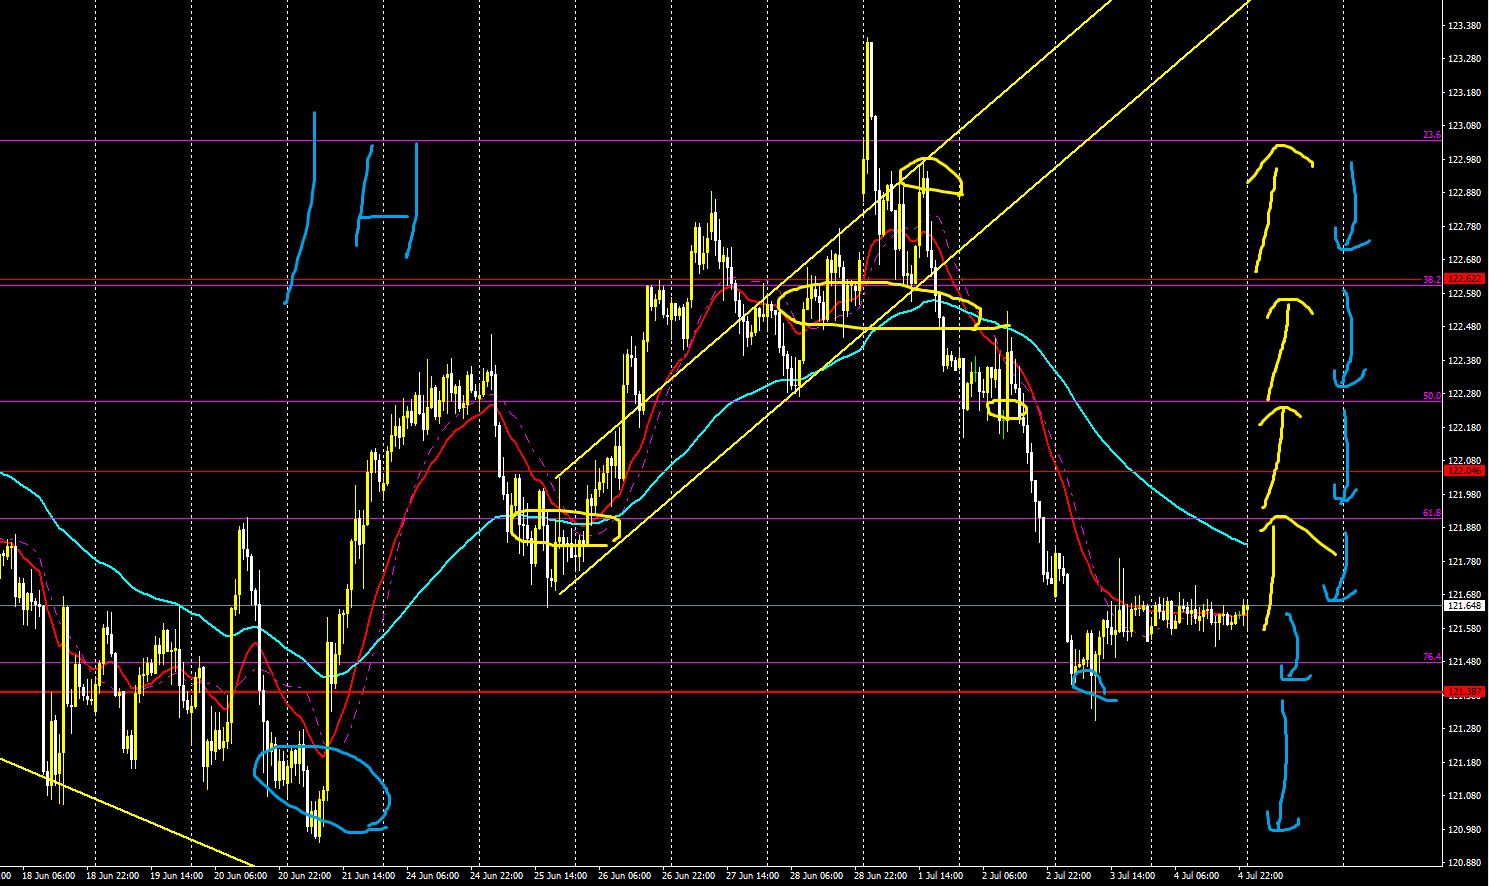
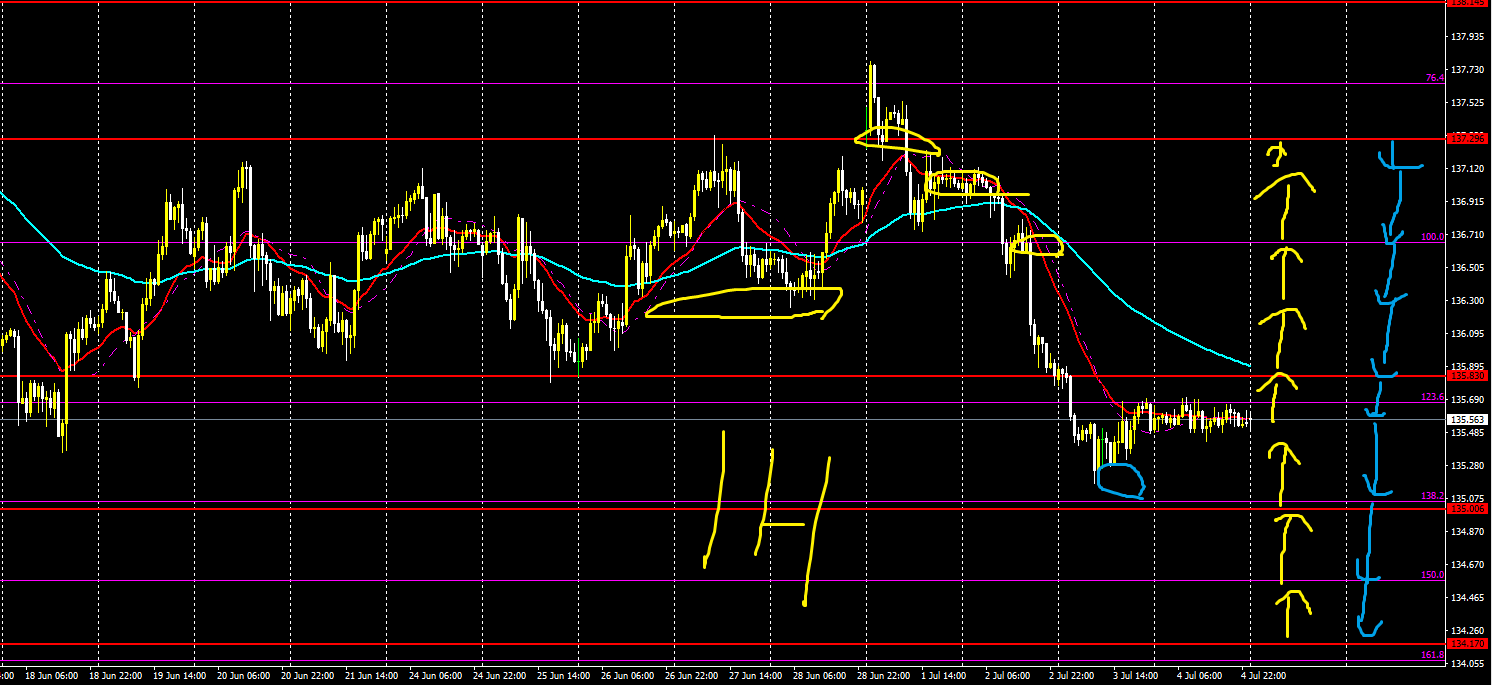
【USDJPY】
Trading difficulty A–
Long-term outlook: down, short-term: up
Currently in a range
From around the Fibonacci 100 level, it could move to either direction up to the upper/lower lines
From the employment statistics, it may swing up and down; if it continues to move below the MA, selling around Fibonacci 123 could come in
4 hours
1 hour
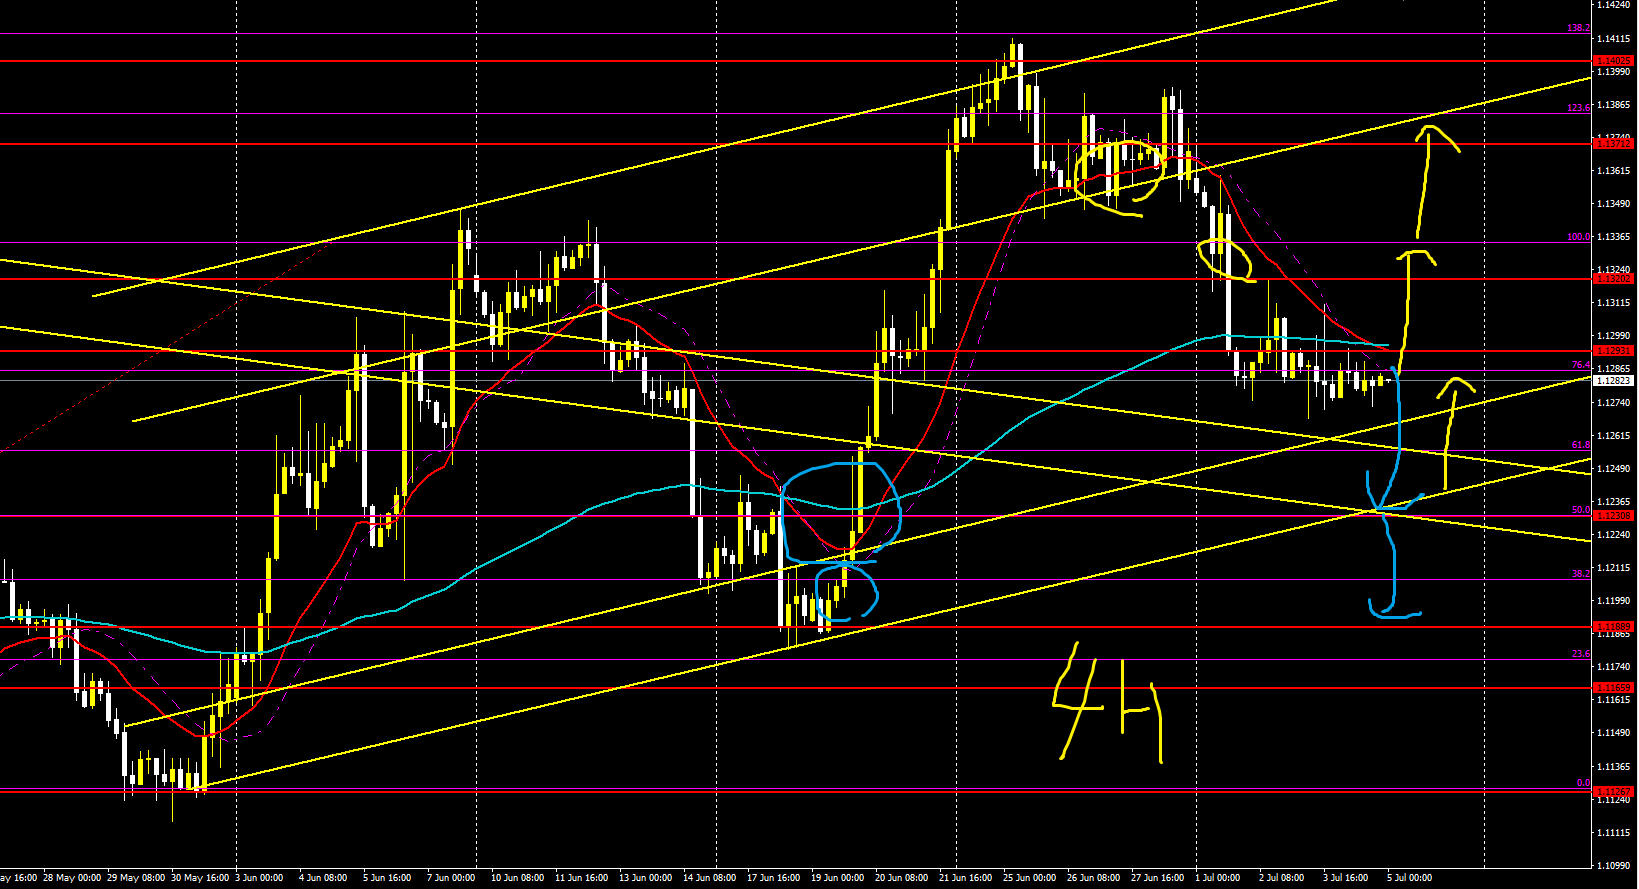
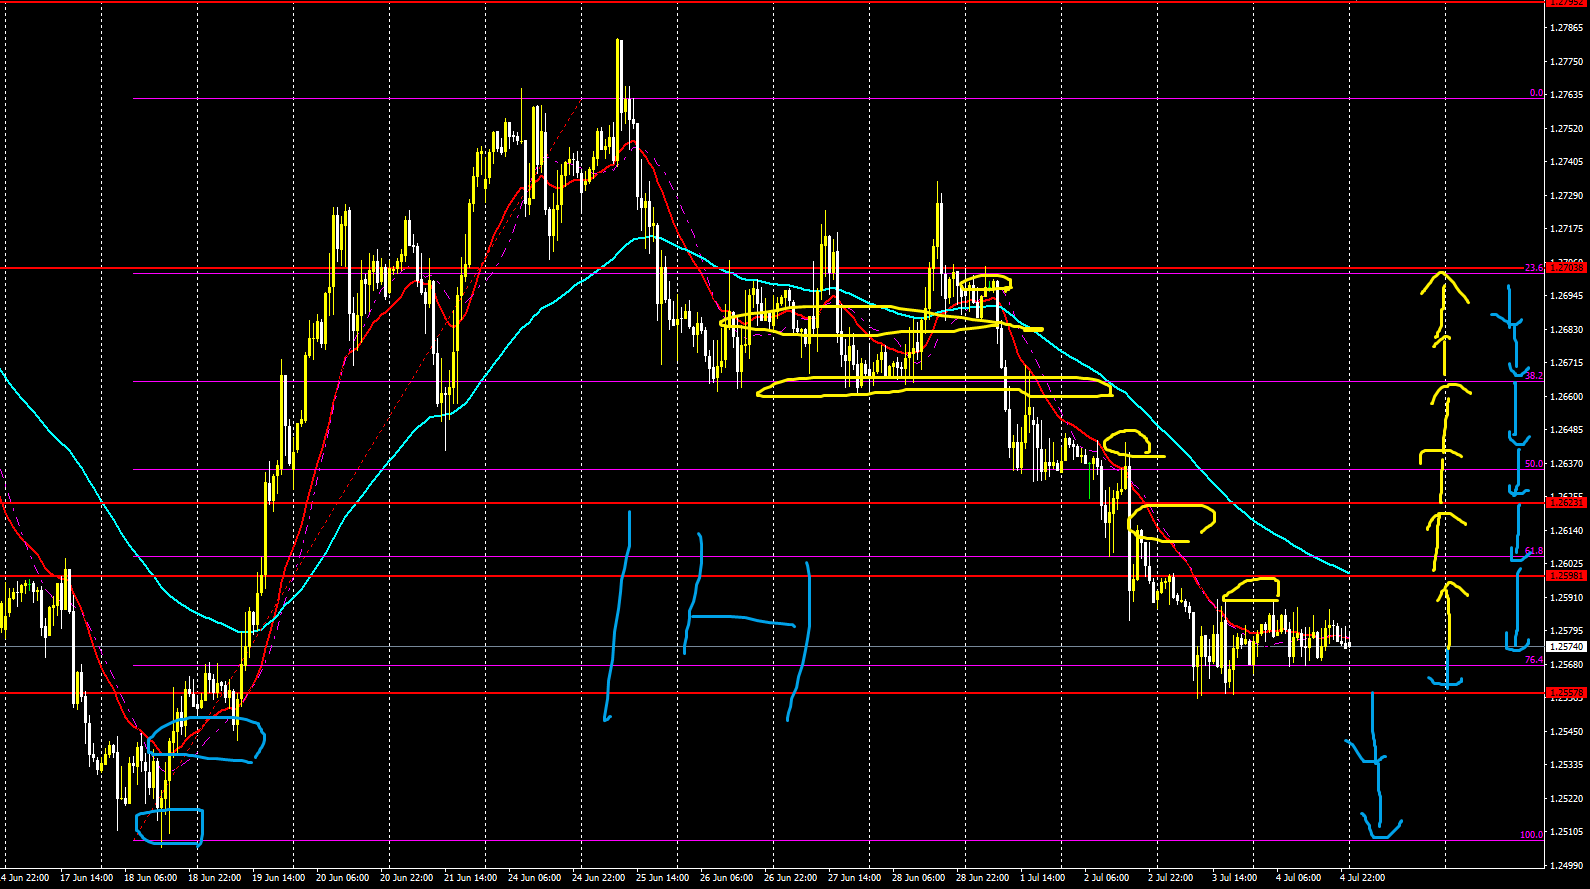
【EURUSD】
Trading difficulty A–
Long-term outlook: up, short-term: down
There is a possibility of buying up to the Fibonacci 100 or below levels from the current rate
Just buy at the indicated arrows
If it breaks downward, sell near the lower boundary of the channel
Buying could come up to around Fibonacci 100 or 123
4 hours
1 hour

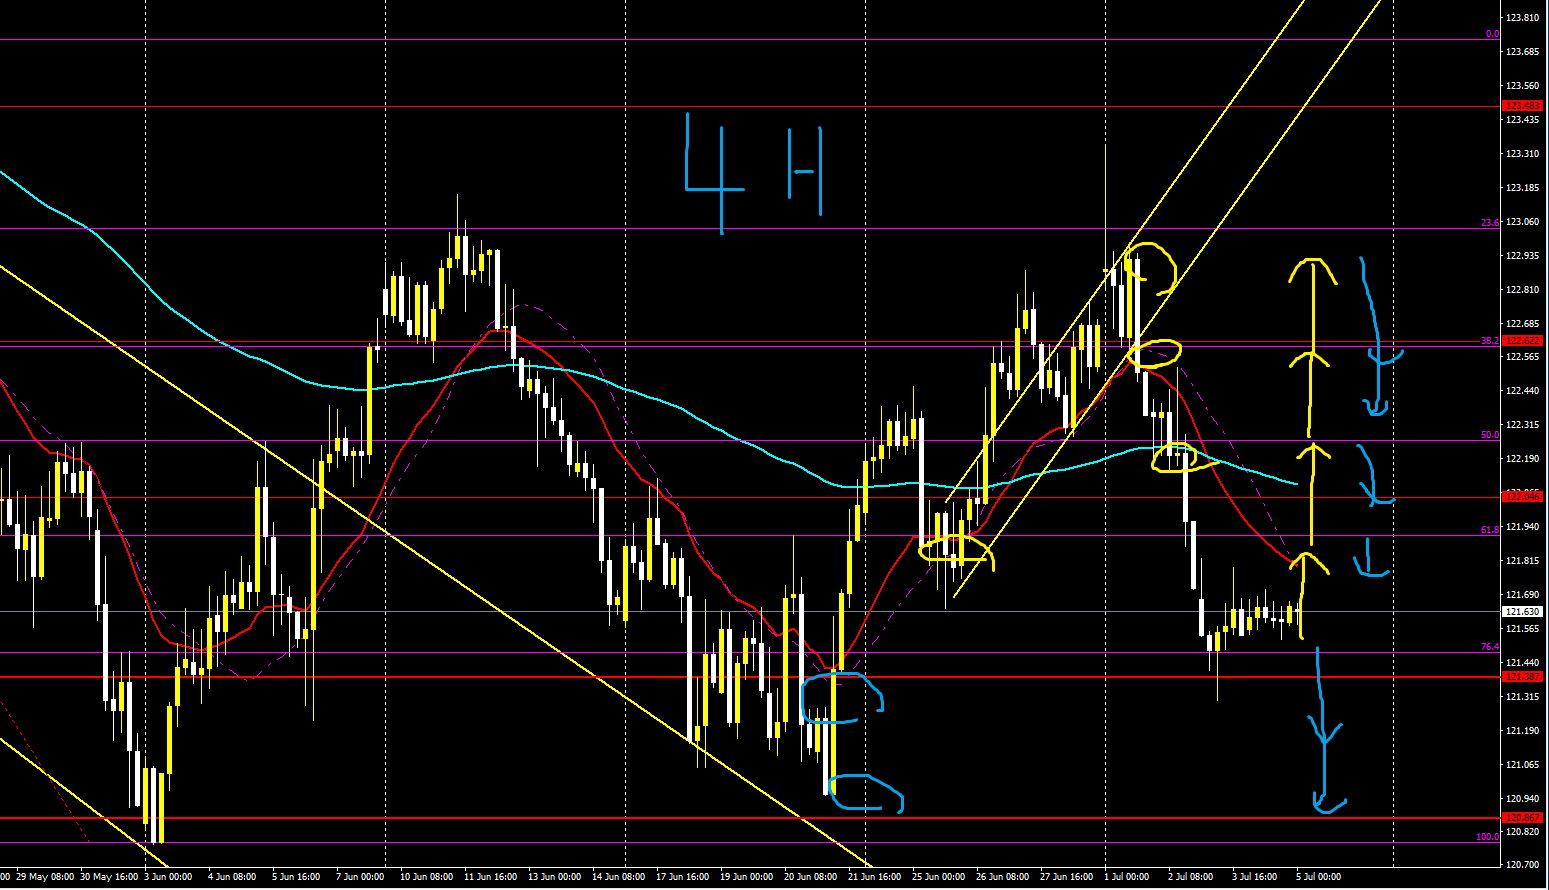
EUR/JPY
Trading difficulty B+
Long-term outlook: down, short-term also down
From near Fibonacci 76, a rebound to 61, then buy up to 50, then 38
If a rebound comes and selling enters, use a straightforward strategy of selling on rallies
If there is no rebound and it simply breaks, then sell straightforwardly
4 hours
1 hour
【GBPUSD】
Trading difficulty B+
Long-term outlook: down, short-term also down
There is a possibility of a rebound to near Fibonacci 61 or nearby levels, so go long
Range trading between Fibonacci 61–76 is possible
And if it breaks downward, follow the arrows to sell near the neckline or near the lows
There is also a possibility of a strong break above 61
4 hours
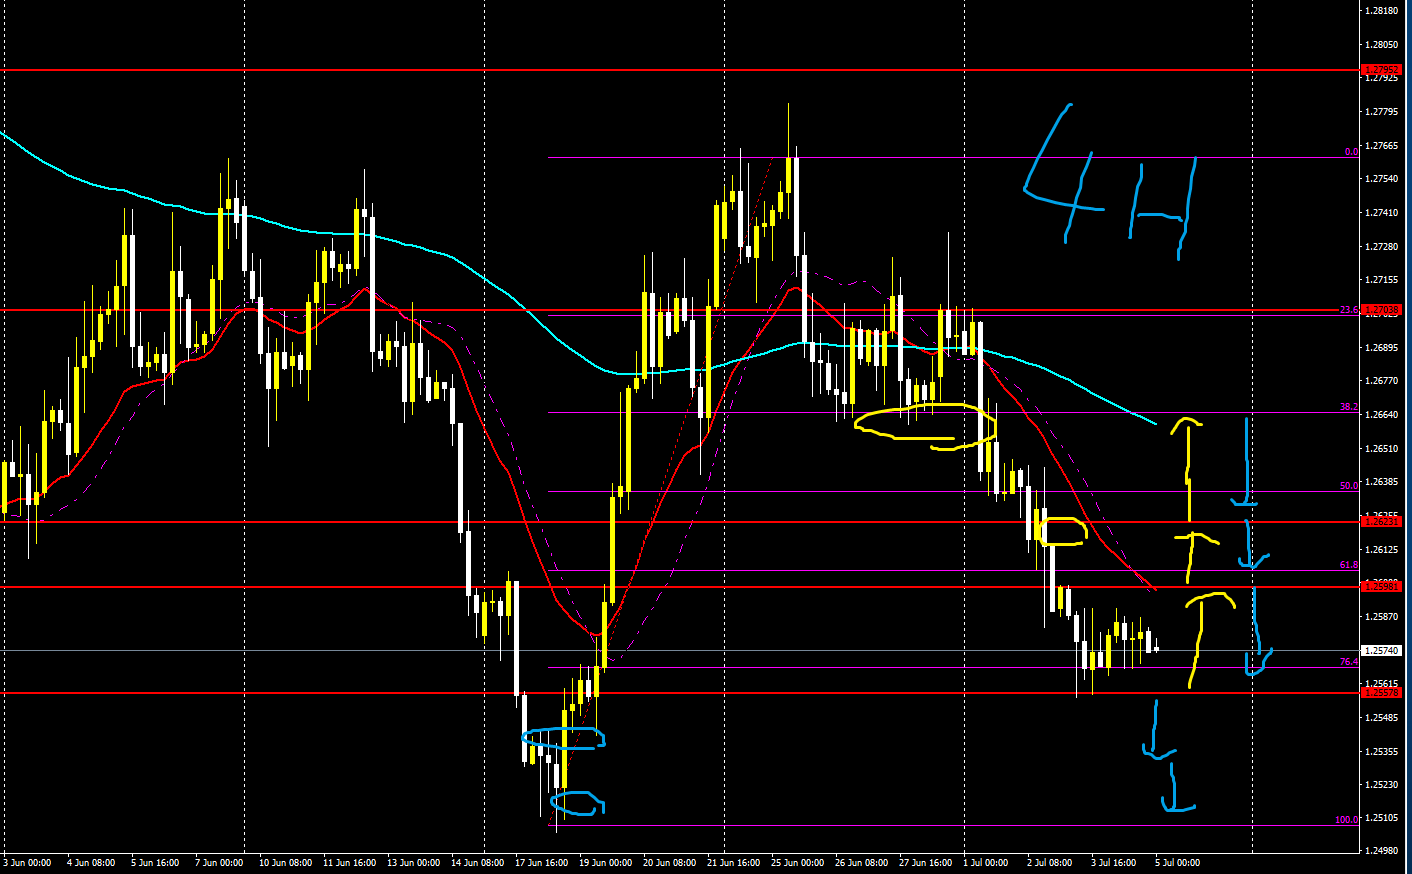
1 hour
【GBPJPY】
Trading difficulty A–
Long-term outlook: down, short-term also down
If there is a rebound within the Fibonacci 120–100 range, trade inside that range
If it does not rebound and falls to 138 Fibonacci, consider selling as it breaks, or sell toward the lower line or Fibonacci levels below
Also today there is a possibility of a rebound up to 100
4 hours
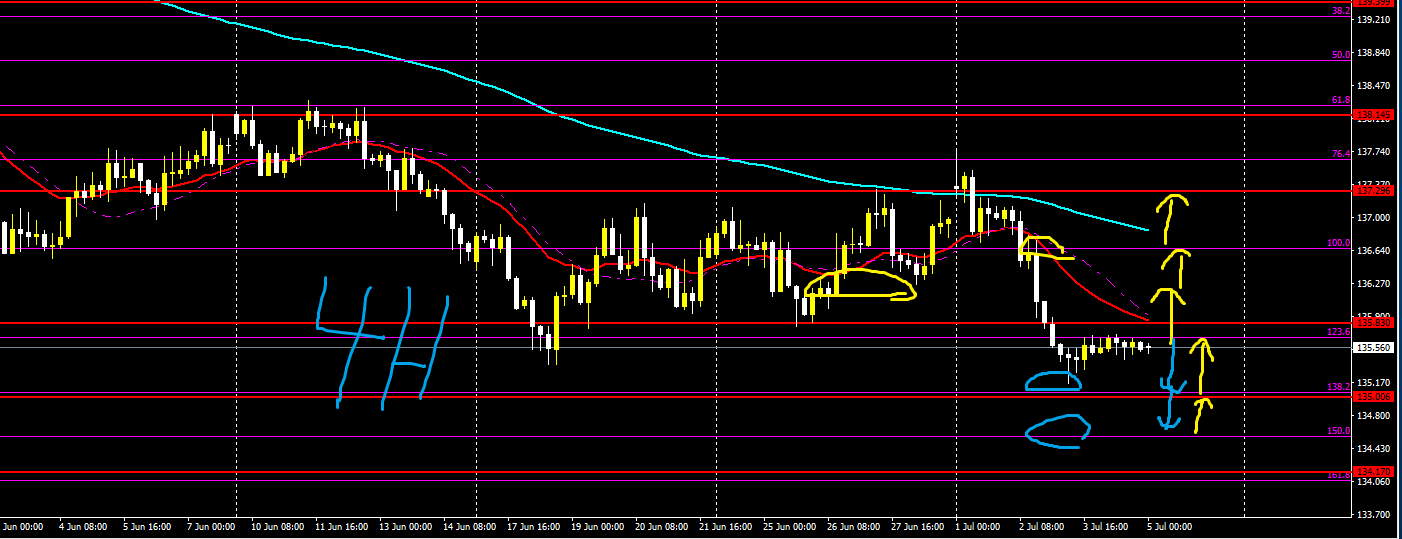
1 hour
【Afterword】
The arrows drawn in the image indicate the prevailing direction
Yellow indicates upward direction
Light blue indicates downward direction
It does not guarantee that the rate will react or rebound in that direction; it merely indicates relative strength
However, since the arrows are drawn around key levels, please use them as a trading reference
The arrows may become targets for taking profits or stop-loss points
And please use lines and Fibonacci levels similarly for take-profit, stop-loss, and entry points
The weekly market outlook and strategy are usually quite accurate on YouTube
What matters is how you apply them to trading and entries
When market strategy was correct or incorrect, the way of trading and thinking changes
And please consider entry as a separate matter


