

Future market strategy (from 7/4)
Hello, this is Womenpi Trade (@onepipst)
From 7/4, I would like to outline market expectations, plan strategies, and search for entry points
I also tweet about profits and other useful thingsso pleasefollow me on Twitter.
Table of contents
- Dollar/Yen (USD/JPY)
- Euro/Dollar (EUR/USD)
- Euro/Yen (EUR/JPY)
- Pound/Dollar (GBP/USD)
- Pound/Yen (GBP/JPY)
- Afterword
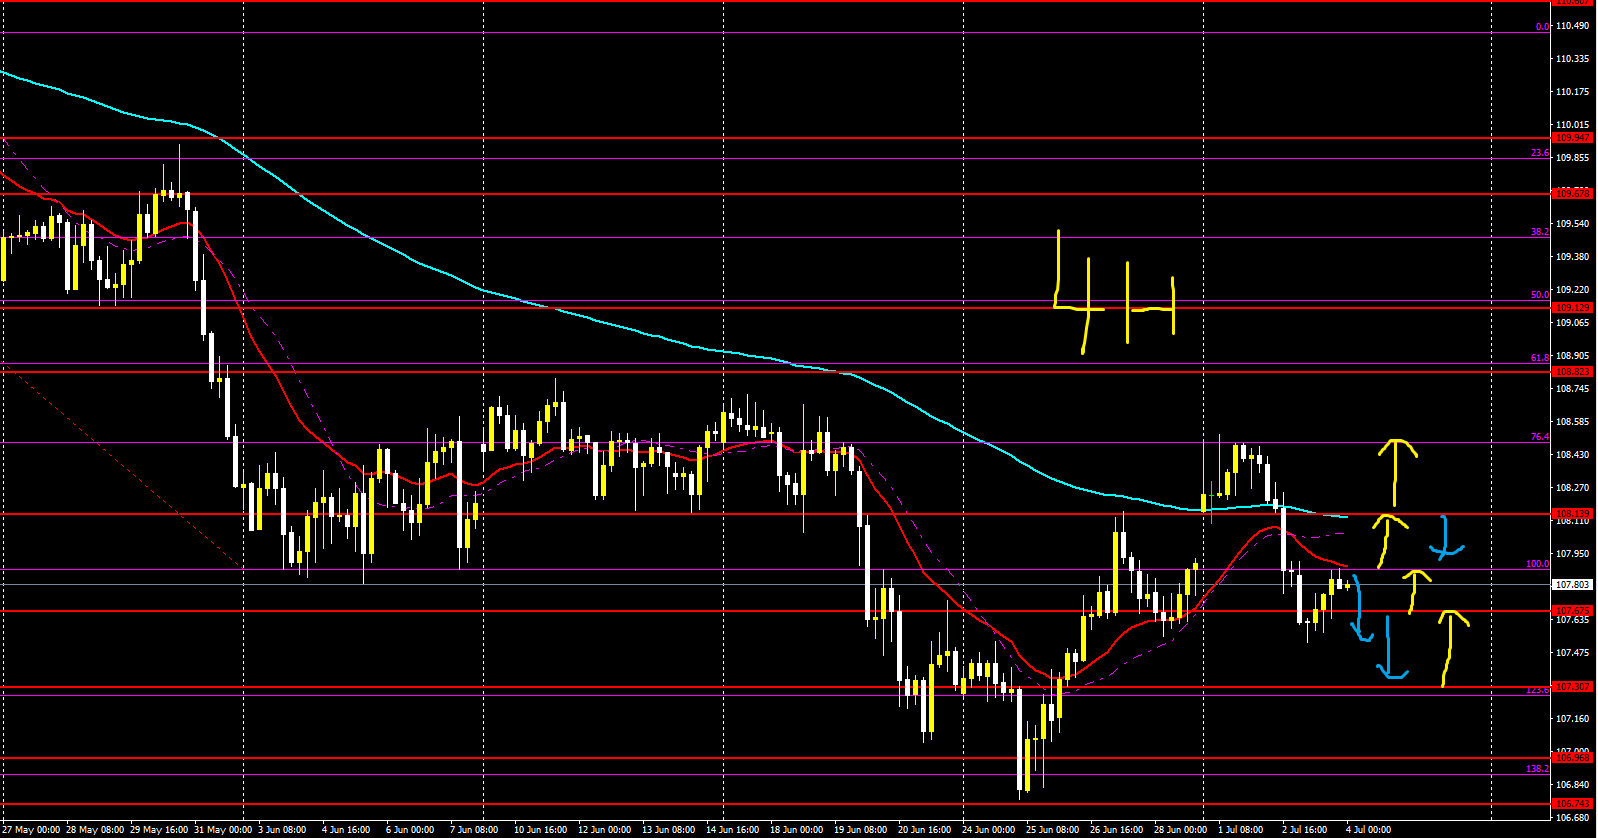
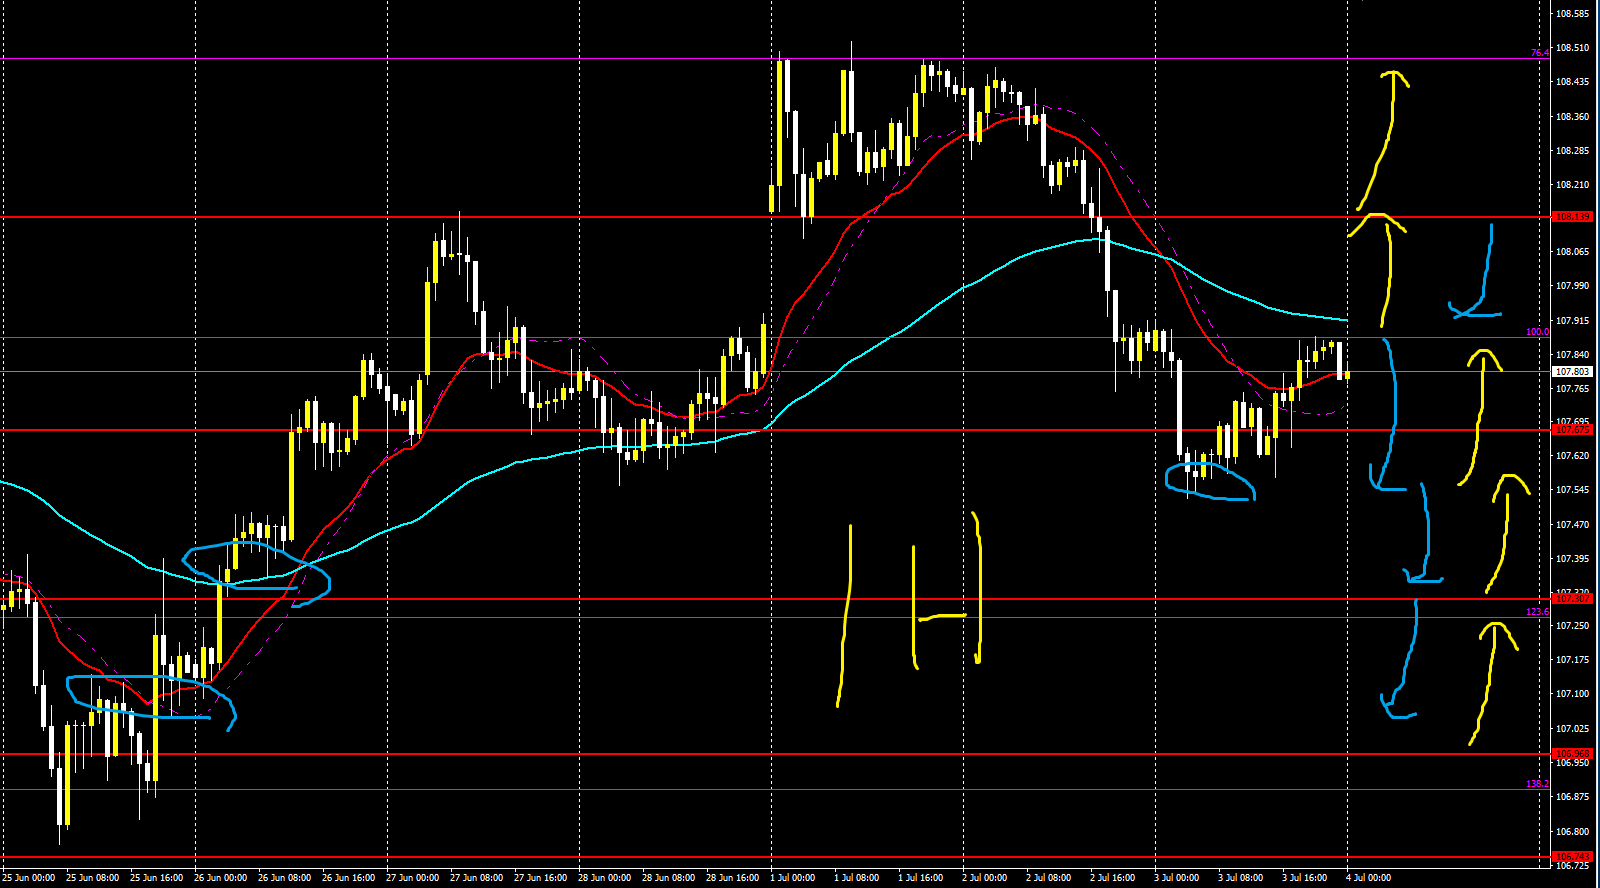
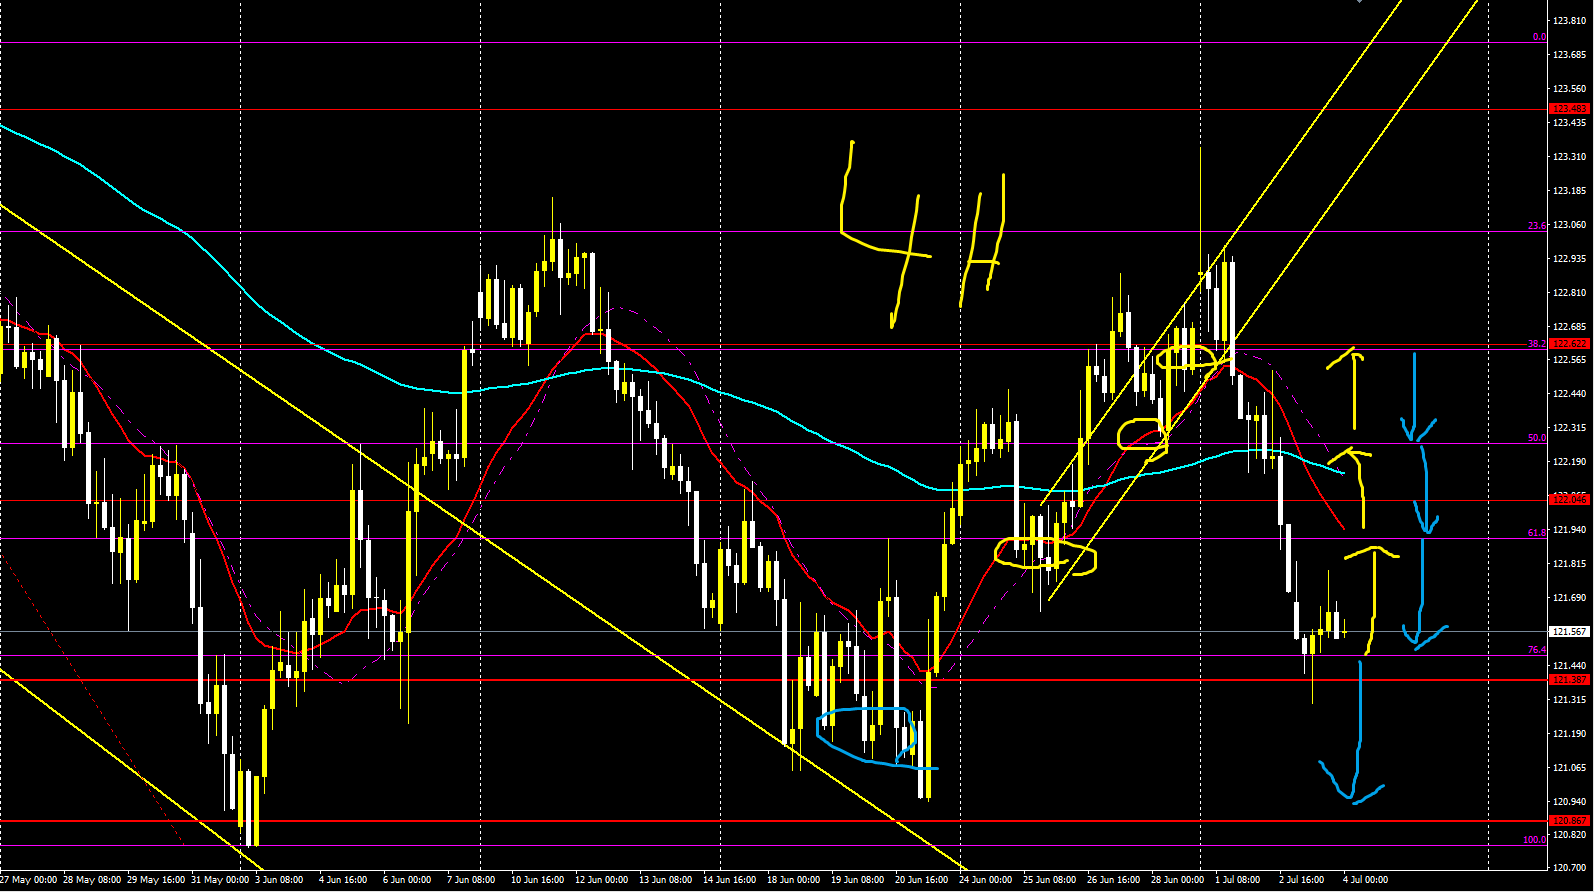
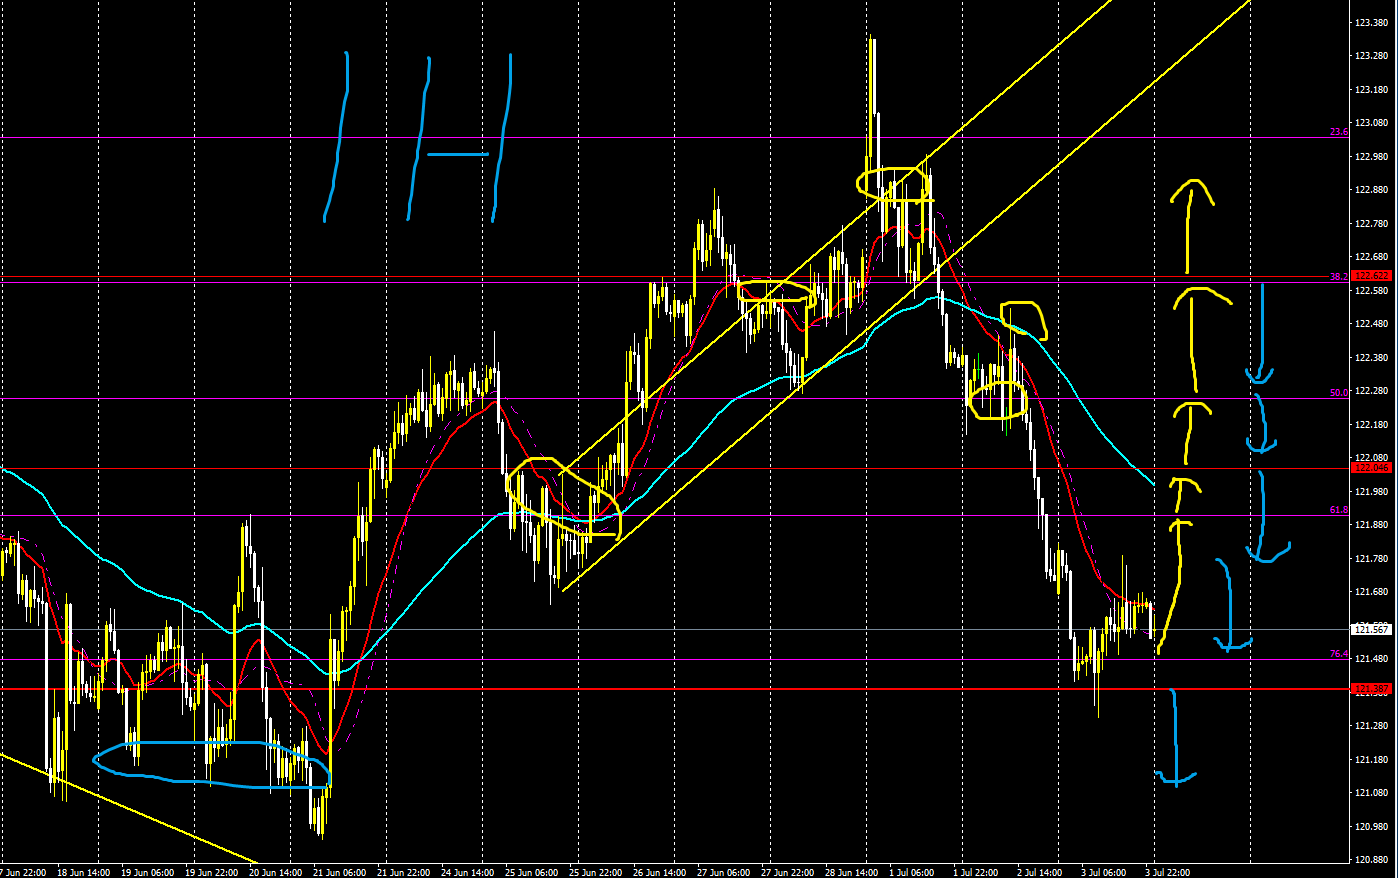
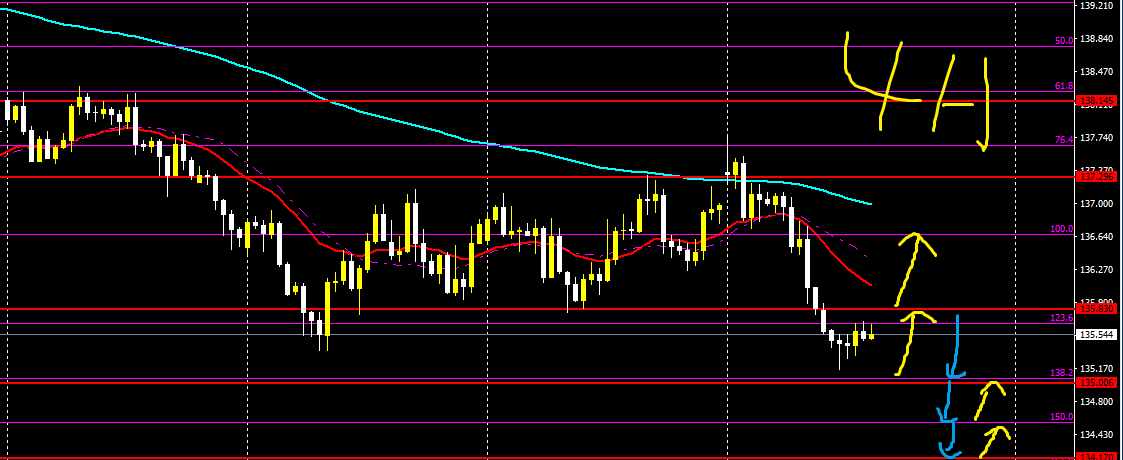
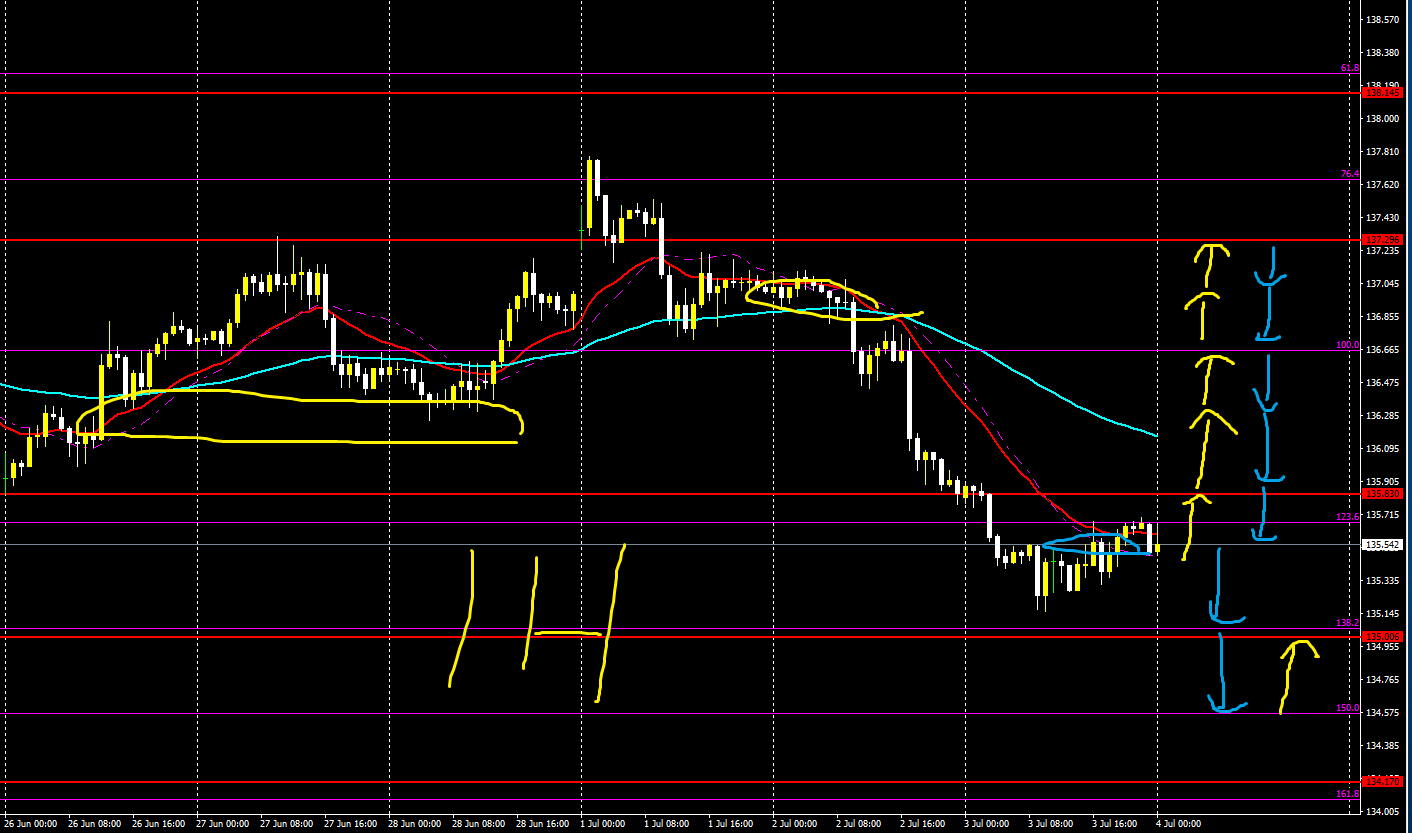
【Dollar/Yen (USDJPY)】
Trading difficulty B+
Long-term outlook is down, short-term is up
Currently in a range
From around the Fibonacci 100 level to the upper and lower lines, there is a possibility of movement in either direction
4 hours
1 hour
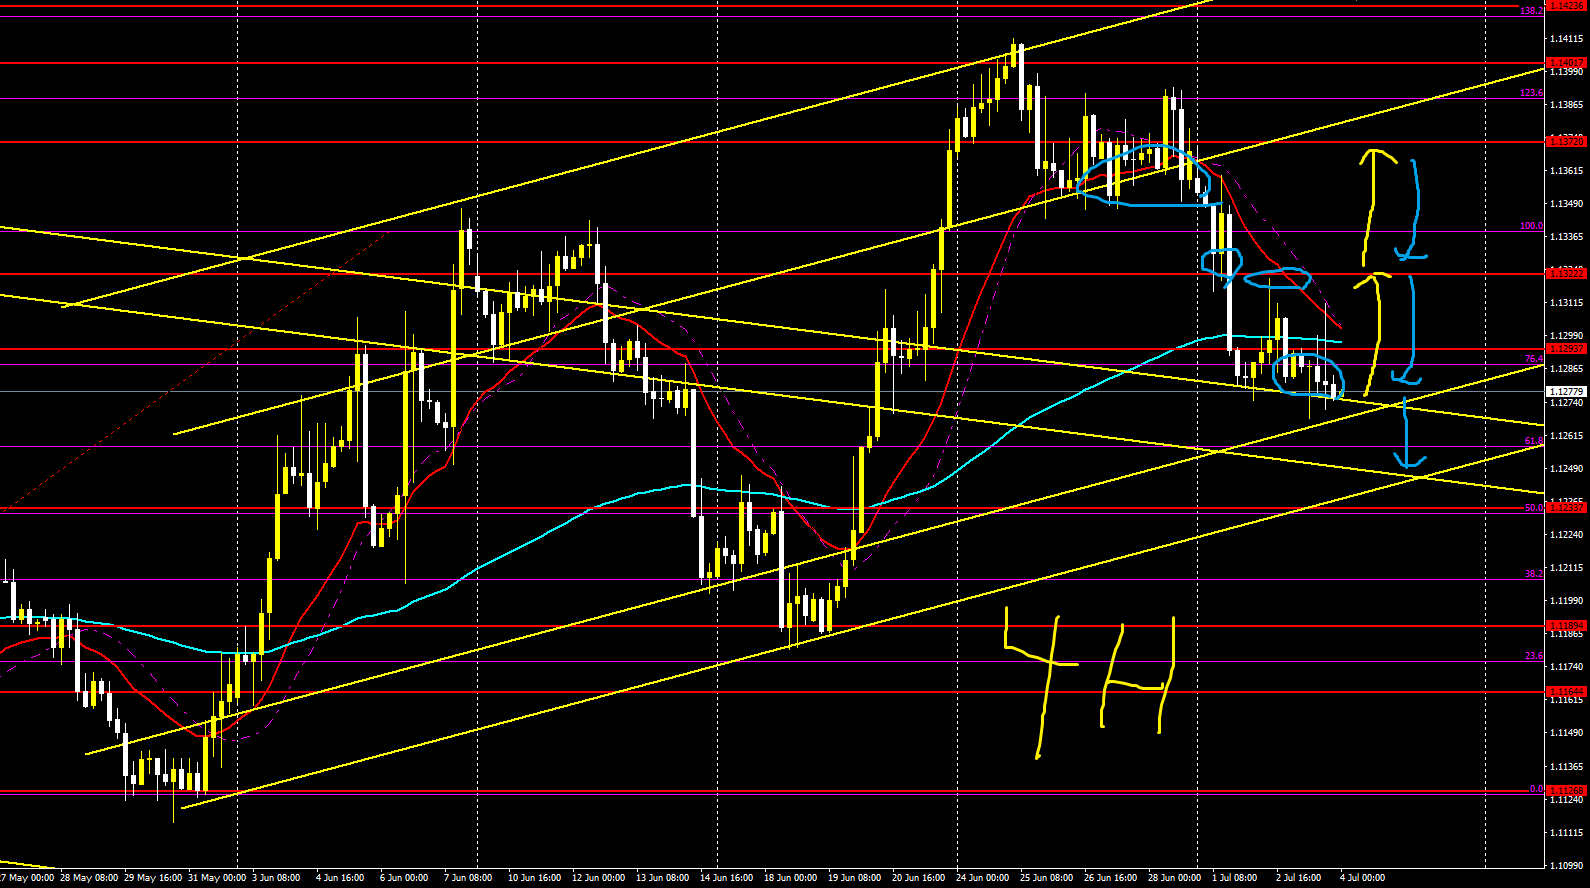
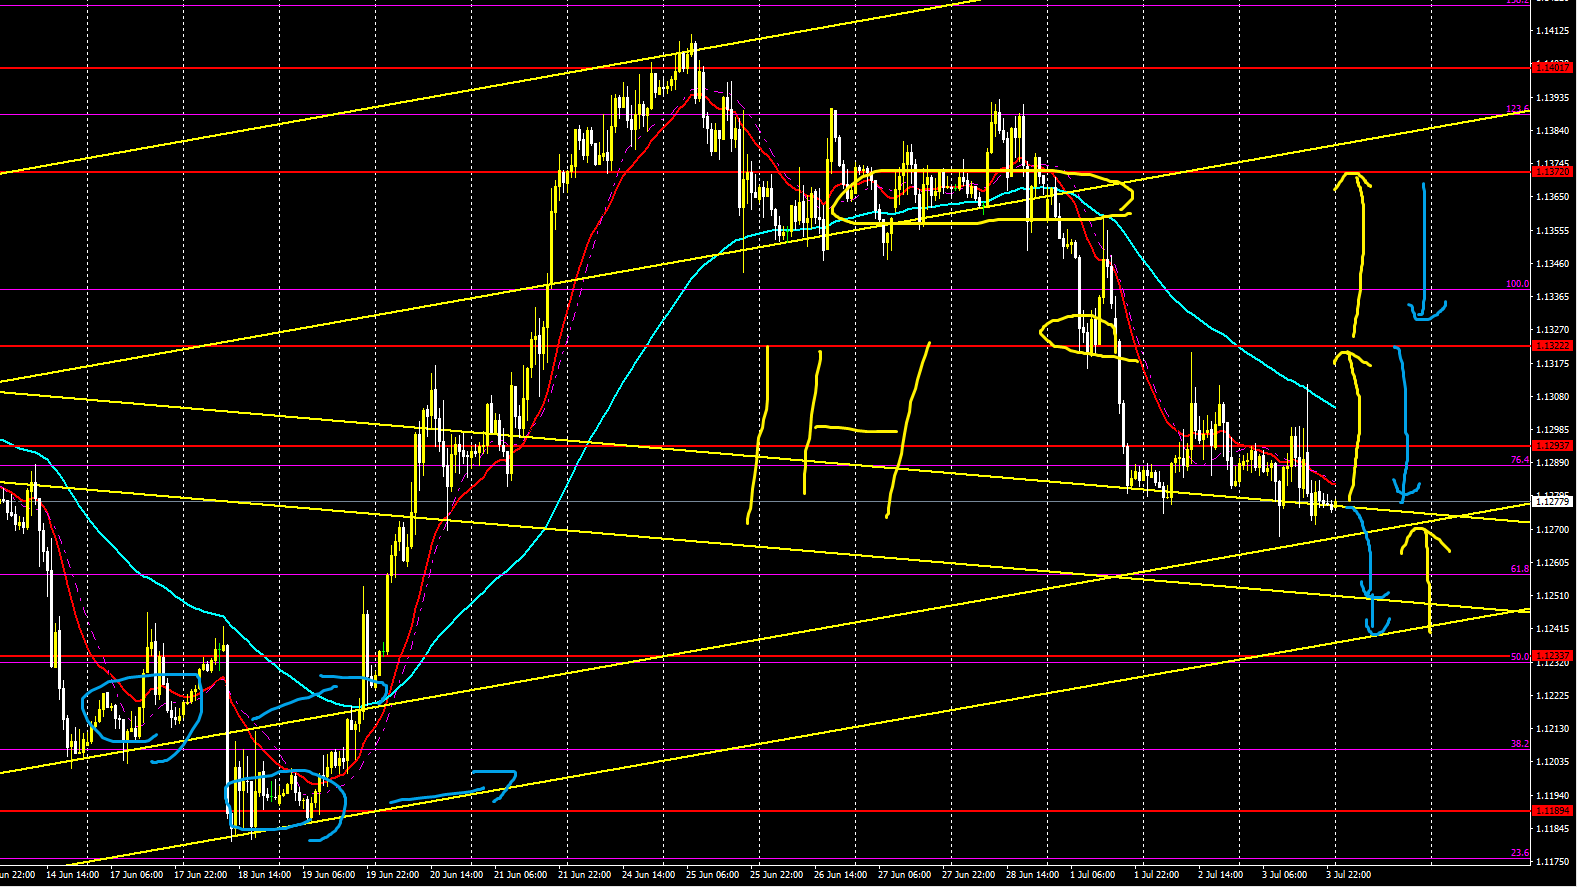
【Euro/Dollar (EURUSD)】
Trading difficulty A-
Long-term outlook is up, short-term is down
There is a possibility of buying from the current rate up to the Fibonacci 100 or below
Just buy if shown by the arrows
If it breaks downward, sell toward the lower bound of the channel
4 hours
1 hour
Euro/Yen (EUR/JPY)
Trading difficulty B+
Long-term outlook is down, short-term also down
From around Fibonacci 76, a rebound may come and buy up to 61; if it breaks, buy to 50, 38
If a rebound appears and selling comes, proceed with a straightforward rebound selling
If no rebound and it simply breaks, sell straightforwardly
4 hours
1 hour
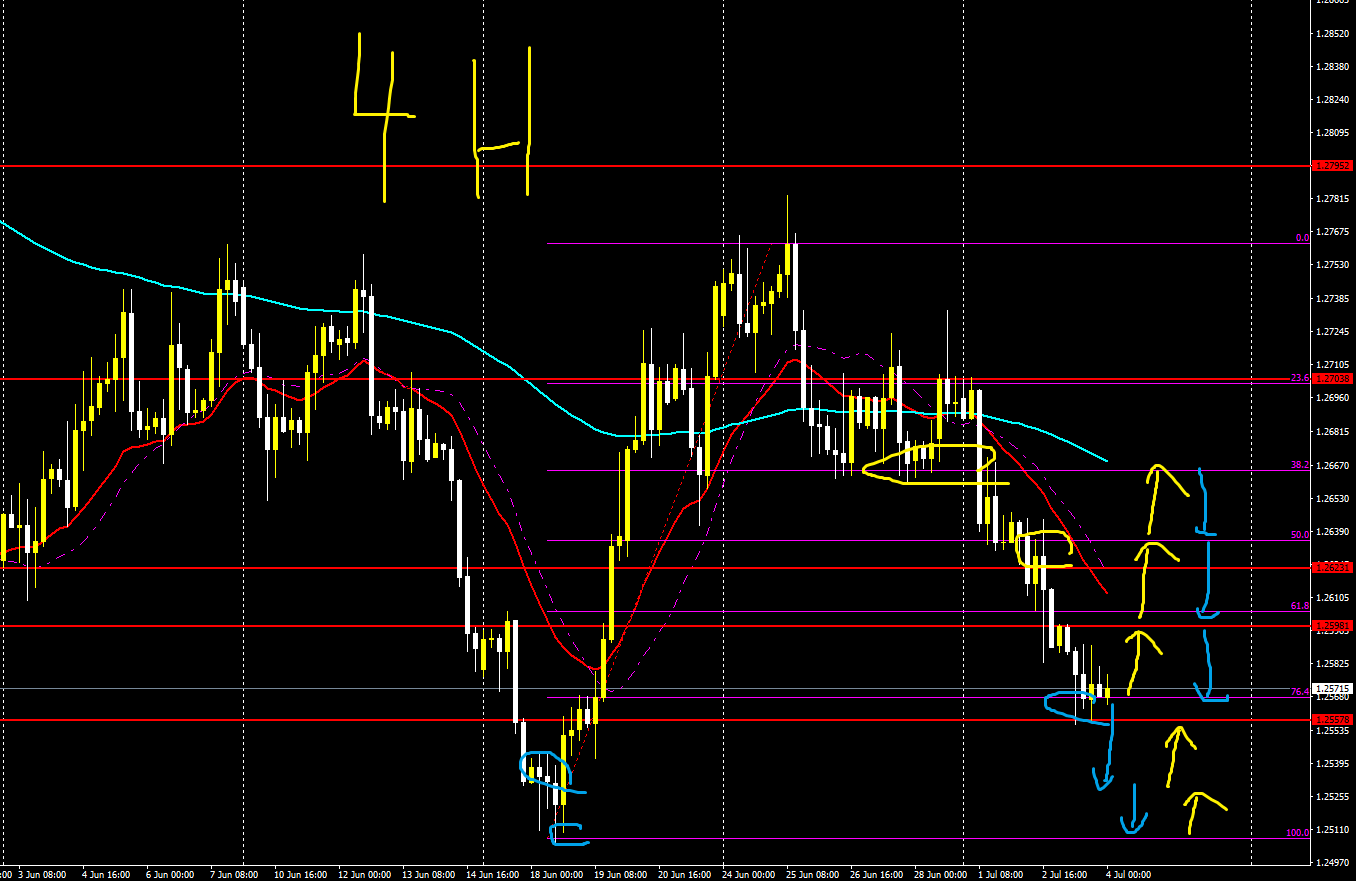
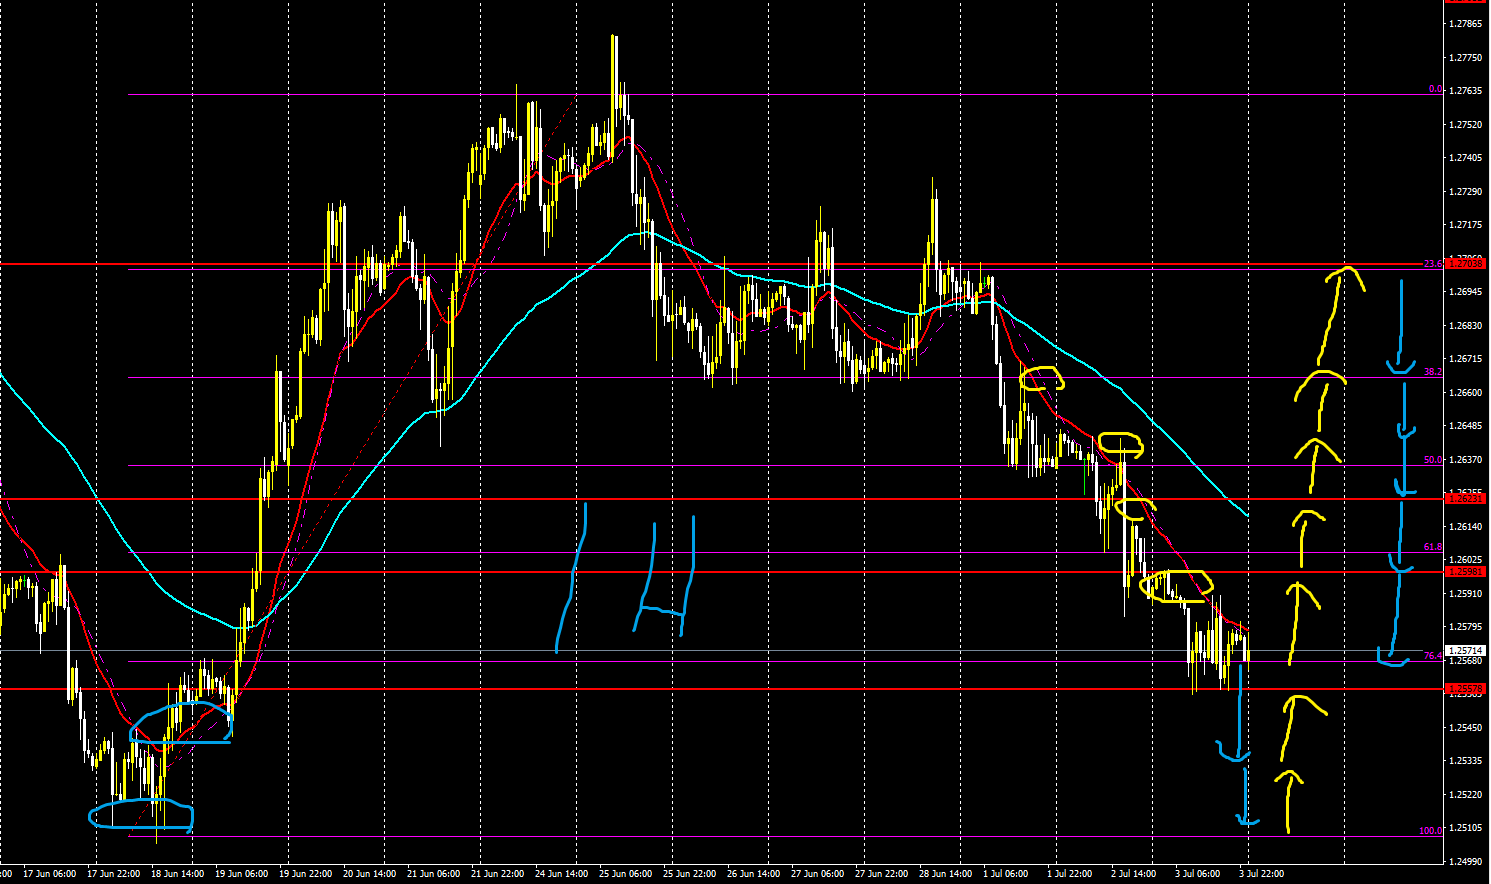
【Pound/Dollar (GBP/USD)】
Trading difficulty B+
Long-term outlook is down, short-term also down
There is a possibility of a rebound to around Fibonacci 61 or nearby lines, so buy to attack
Range trading between Fibonacci 61 and 76 is possible
If it breaks downward, follow the arrows to attack near the neckline or the low
4 hours
1 hour
【Pound/Yen (GBPJPY)】
Trading difficulty A-
Long-term outlook is down, short-term also down
If there is a rebound within the Fibonacci 120–100 range, trade within that range
If there is no entry and it breaks to the 138 Fibonacci level, consider selling up to that line or beyond
4 hours
1 hour
【Afterword】
The arrows drawn in the image indicate the advantageous direction
Yellow indicates upward direction
Light blue indicates downward direction
But this only indicates a relative advantage; it does not guarantee that the rate will react or rebound at that level
However, since arrows are drawn near key levels, please use them as reference for trading
The arrows may become take-profit or stop-loss points
And please use the lines and Fibonacci similarly for take-profit, stop-loss, and entry point references
Weekly market forecasts and strategies are released on YouTube, and they are generally accurate
What matters is how to apply them to trading and entries
When the market strategy is correct or incorrect, the method and mindset of trading differ
And please treat entries as a separate thing


