Understanding Max Iwamoto's "Pivot" Part 1 [Max Iwamoto]

Max Iwamoto Profile

Keisuke Iwamoto. As his nickname “No-Education Certified Technical Analyst” suggests, he is a rare no-education analyst in the industry. Even in these days when academic credentials still strongly matter, he is daily striving in the FX market where such things do not matter at all. With the belief that “now that anyone can start FX easily, I want you to acquire the skills to keep winning,” he serves as the author of serial articles and a seminar lecturer.
*This article is a reprint and rewrite of an article from FX攻略.com December 2018 issue. Please note that the market information written in the main text may differ from the current market.
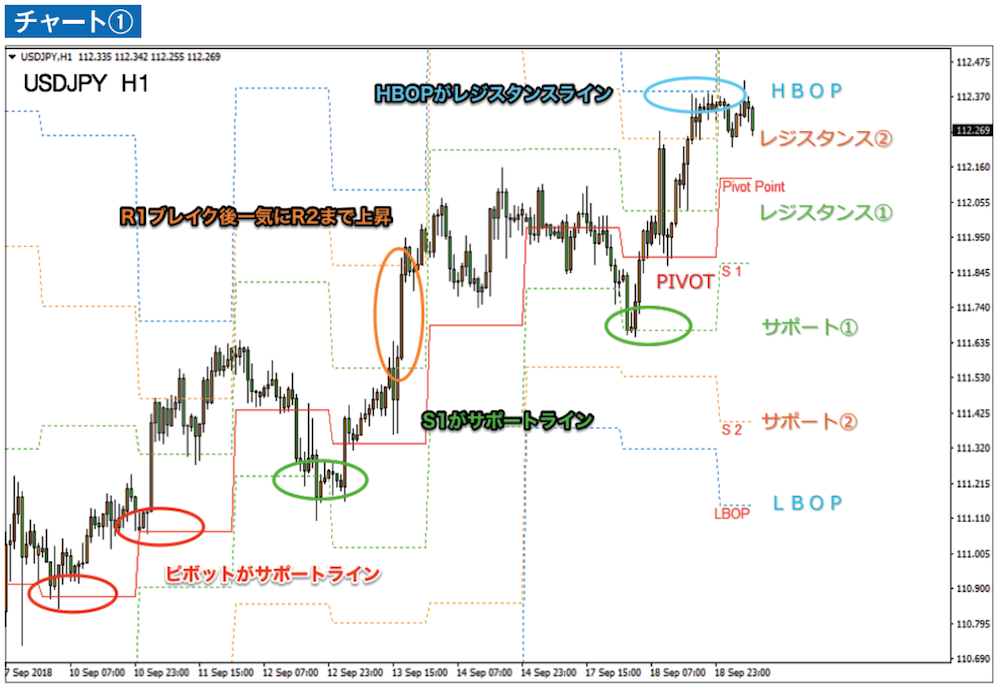
Capture buying and selling pressure from the previous day's price movement
From this issue, we introduce pivots devised by J. W. Wilder. He is a legendary technical trader known for major contributions, including RSI, Parabolic, DMI, and more, that almost no one in the field may not know.
The concept of Pivot is to express the strength of buying pressure and selling pressure for the current day based on the price movement of the previous day’s daily chart. While moving averages target several days’ closes, pivots use only the previous day. For those who advocate moving averages, you might think, “Isn’t one previous day too little?” But this is a matter of perspective. If you align with your trading style—whether you want to build a medium-to-long-term strategy or a day-trading strategy—both approaches have wide applicability. Therefore, this Pivot can be said to be an indicator for short-term, day-trading use.
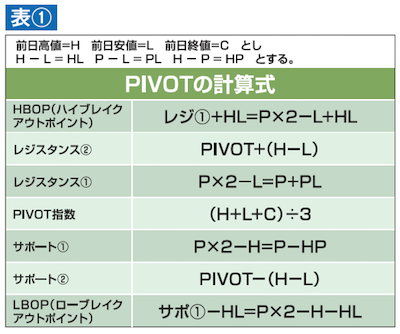
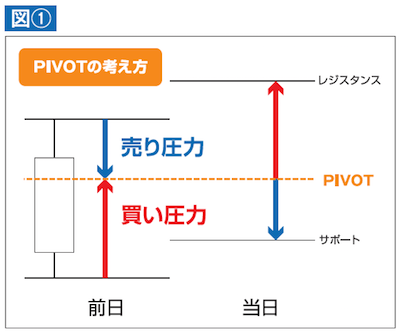
What is needed to generate the pivot are the high (H), low (L), and close (C). As shown in Table ①, you calculate the Pivot Index by averaging the previous day’s high, low, and close. The basic idea of Pivot is to set the Pivot Index as the center value for the day, with buy pressure from the previous day’s low to the Pivot, and the corresponding level of buy pressure expected for the day, while sell pressure stretches from the previous day’s high to the Pivot and is expected for the day (see Figure ①).
This indicator measures buying momentum and selling momentum through seven lines centered on the Pivot and uses them to make buy/sell decisions (Chart ①). Since it directly incorporates the previous day’s price, it is attractive in that you can tell whether the current market is ranging or trending.