

Future market strategy (6/28~)
Hello, this is One Pi Trading (@onepipst)
I will look at the future market developments and strategies
There are profits and other useful things I am tweeting, please follow Twitter
The long-term view is on the daily chart, and we also prepare two perspectives: long-term and short-term
Table of contents
- Dollar/Yen (USD/JPY)
- Euro/Yen (EUR/JPY)
- Pound/Yen (GBP/JPY)
- CAD/Yen (CAD/JPY)
- EUR/AUD (EUR/AUD)
- Afterword
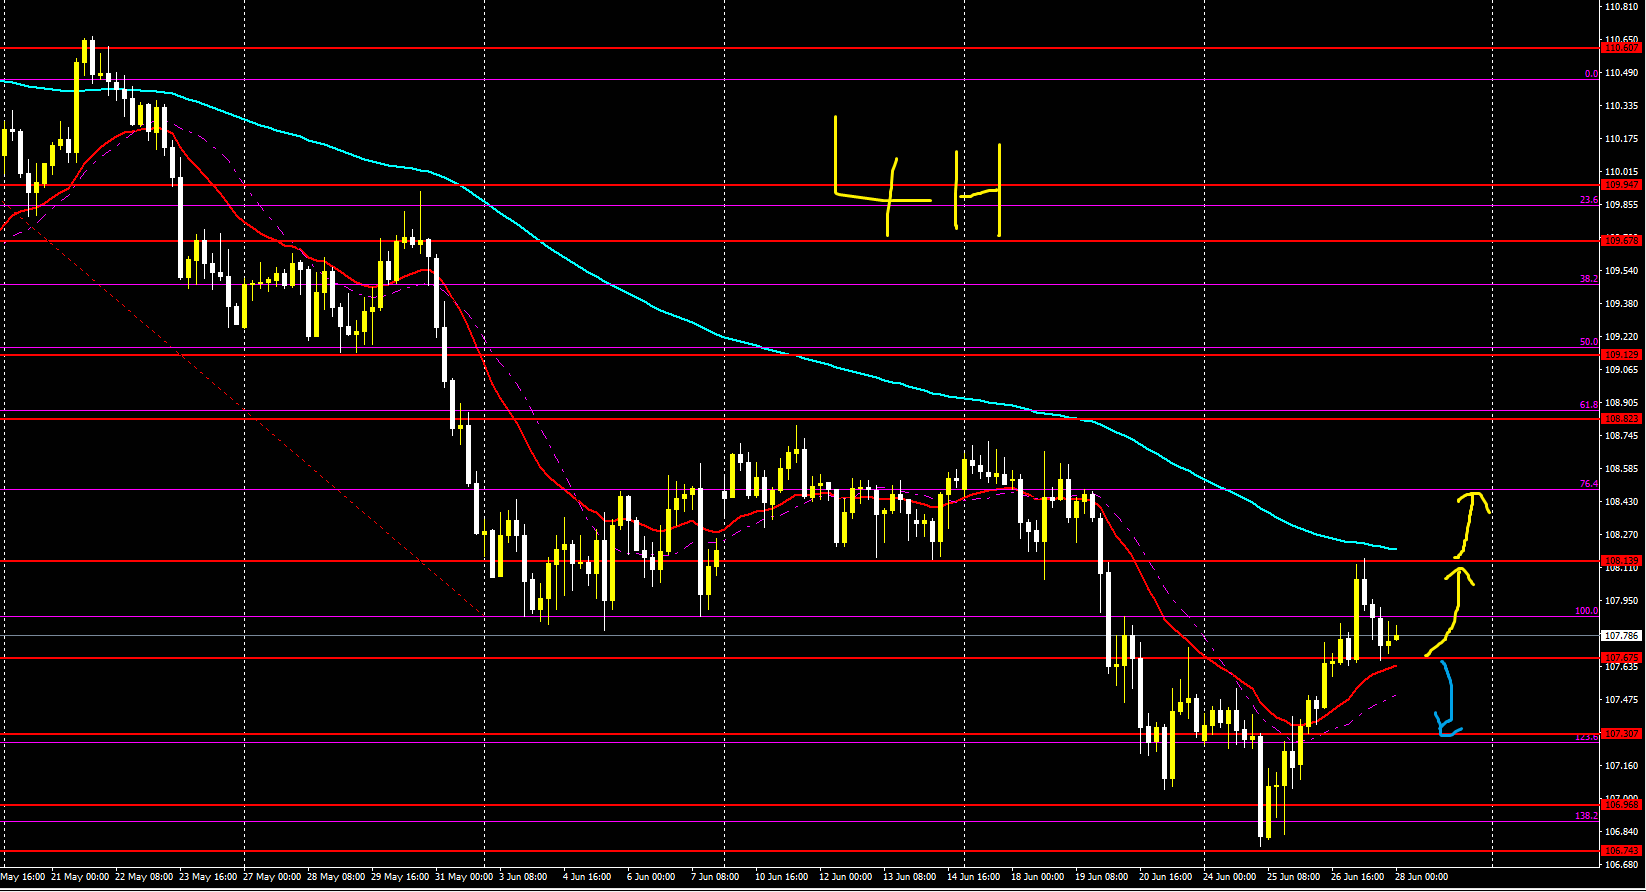
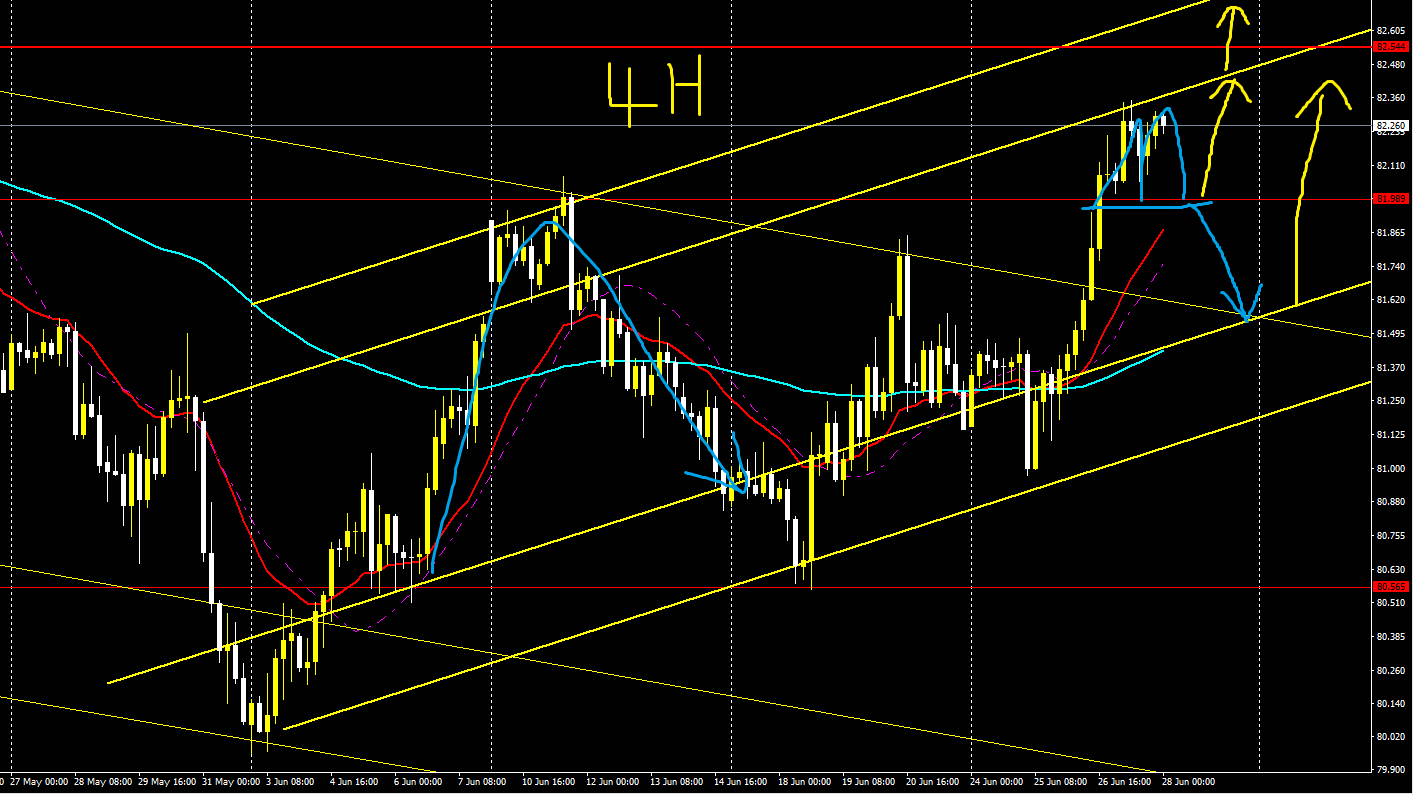
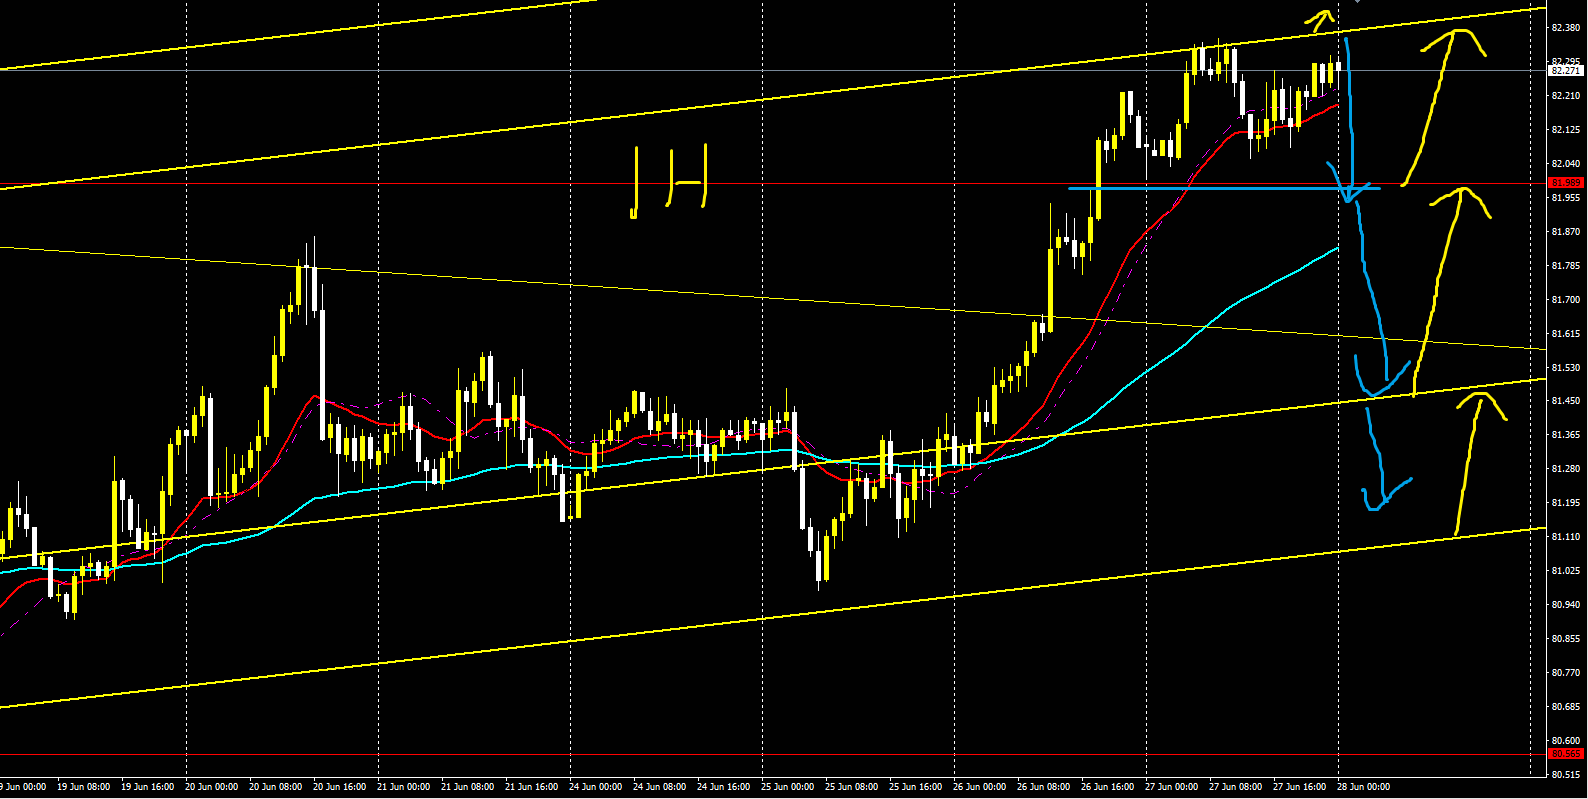
【Dollar/Yen (USDJPY)】
Trading difficulty: B+
Long-term is down, short-term is up
There may be a retracement up to around the Fibonacci 61.76 of the retracement high
Therefore, if a retracement occurs, the strategy is to pick up longs
Please rely on the lines drawn up to that point
Conversely, if it continues downward in a trend-following manner, you could short there
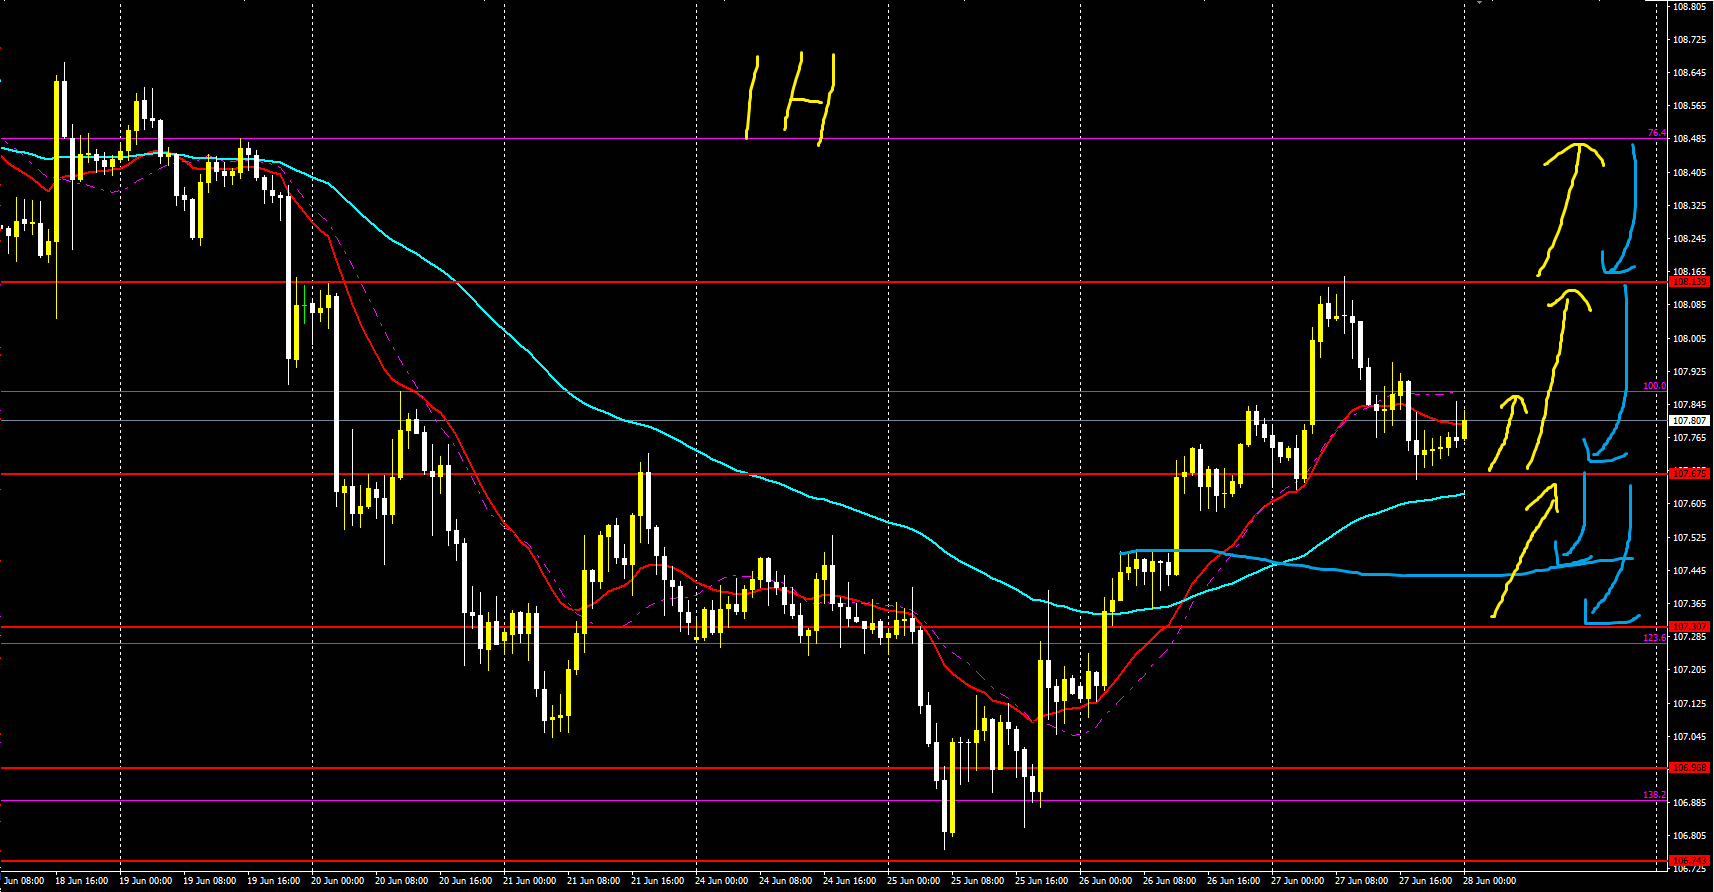
The daily trend is still down, but the 1-hour and other short-term frames are up, so there are scenes to go long and catch the retrace after a reversal
For shorts, also refer to moving averages (MA) etc.
4 hours
1 hour
Euro/Yen (EURJPY)】
Trading difficulty: B
Long-term is down, short-term is up
Short-term formed a flag and clearly drew a channel
Might aim for the Fibonacci 23 or the high lines above that
If using that strategy, go long
When there is a pullback, look to go short
However, the long-term view is still down, so
a large drop is not surprising
There is a possibility of falling to the Fibonacci 61.76 after capping the highs
There is no need to eagerly target a short just from a channel break
4 hours
1 hour
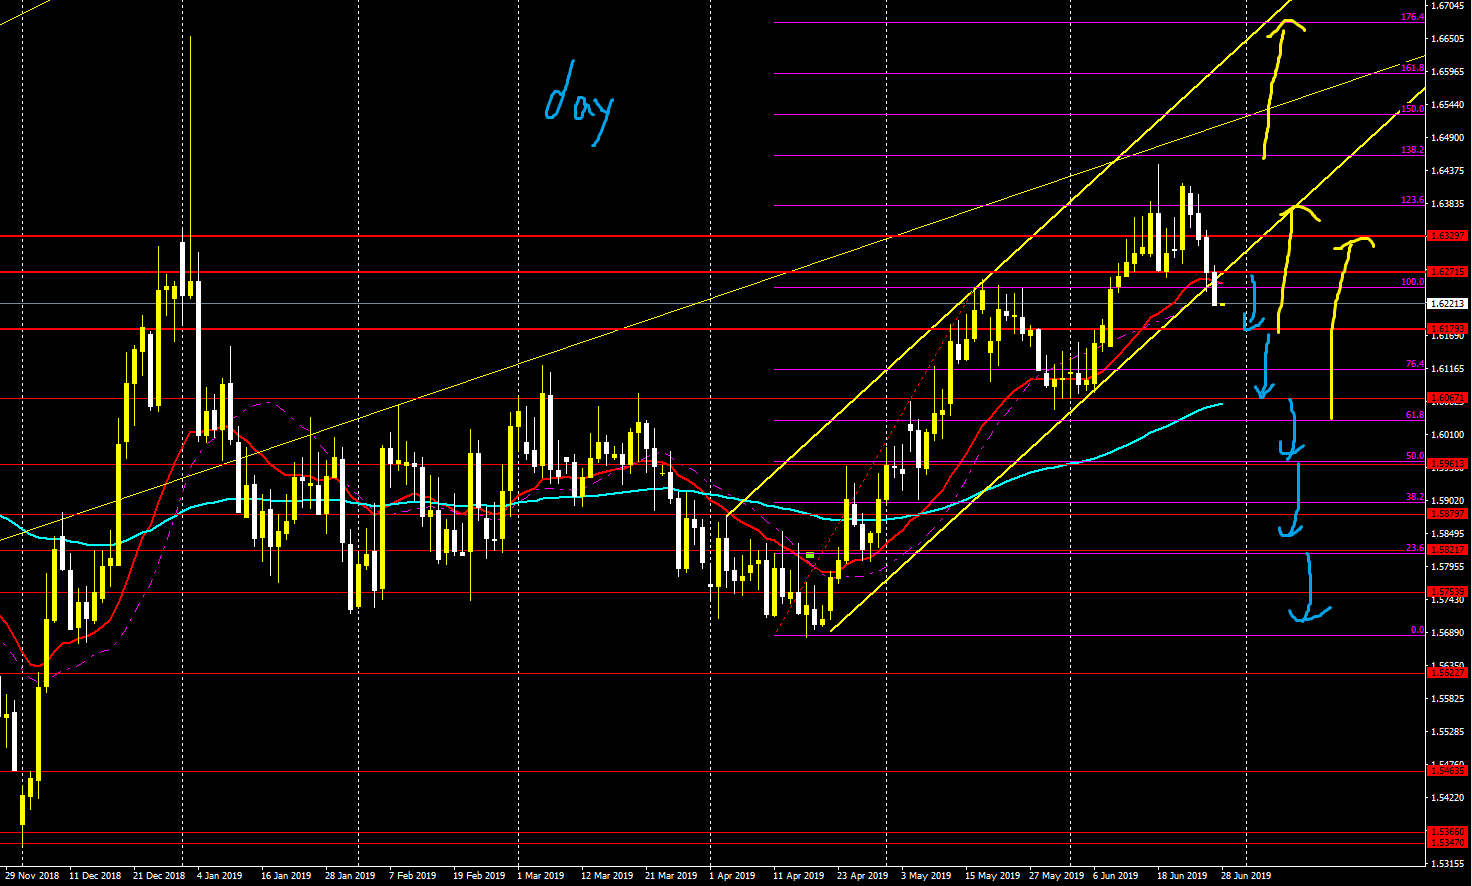
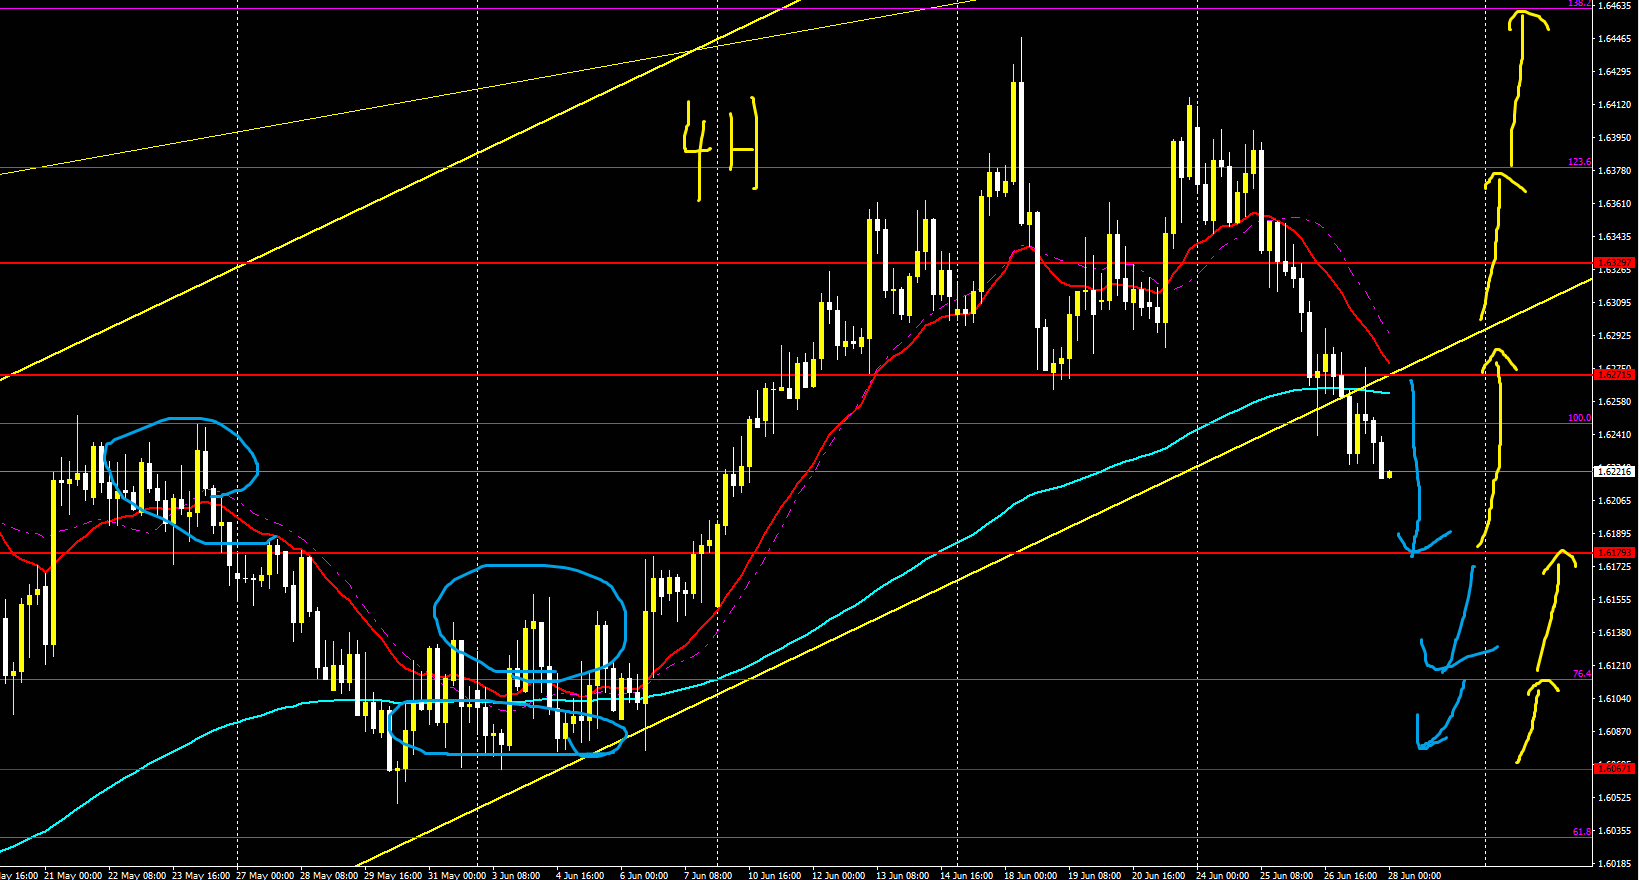
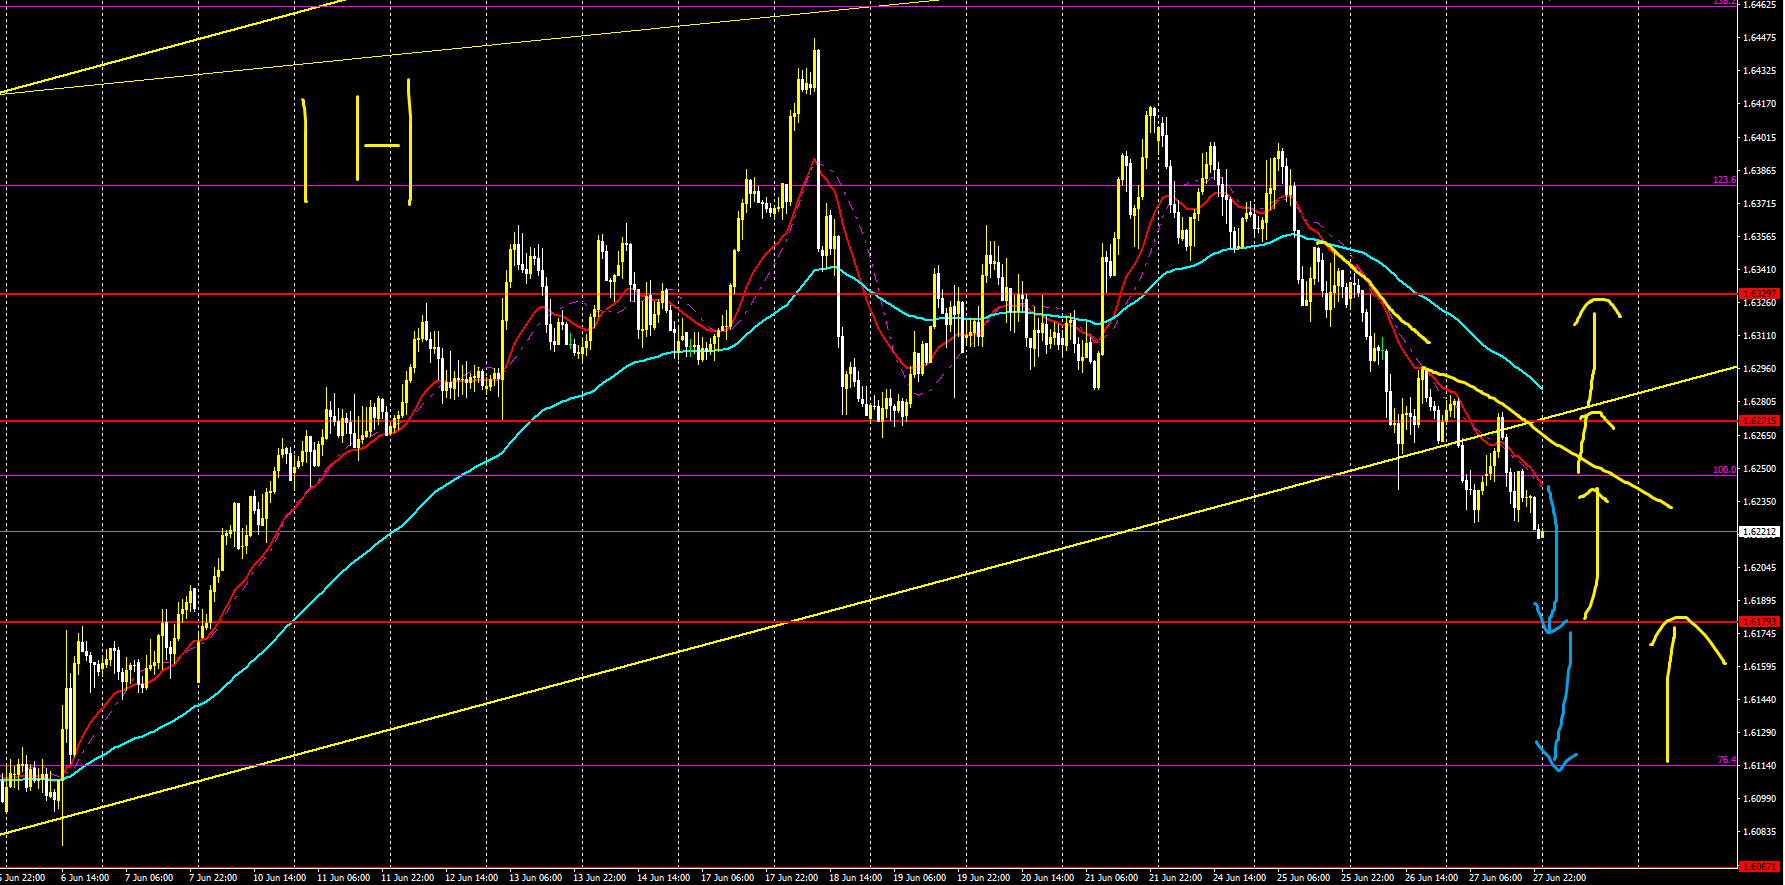
【Pound/Yen (GBPJPY)】
Trading difficulty: A
Long-term is down, short-term also slightly down
Range trading is possible
Fibonacci 120, 100, the levels above, and 76 for range trading
Short trades can be made on a downside break
Looking at the 1-hour chart, a sell from Fibonacci 100 may come in
So today, selling might be somewhat favorable??
Refer to trades along the arrows
4 hours

1 hour

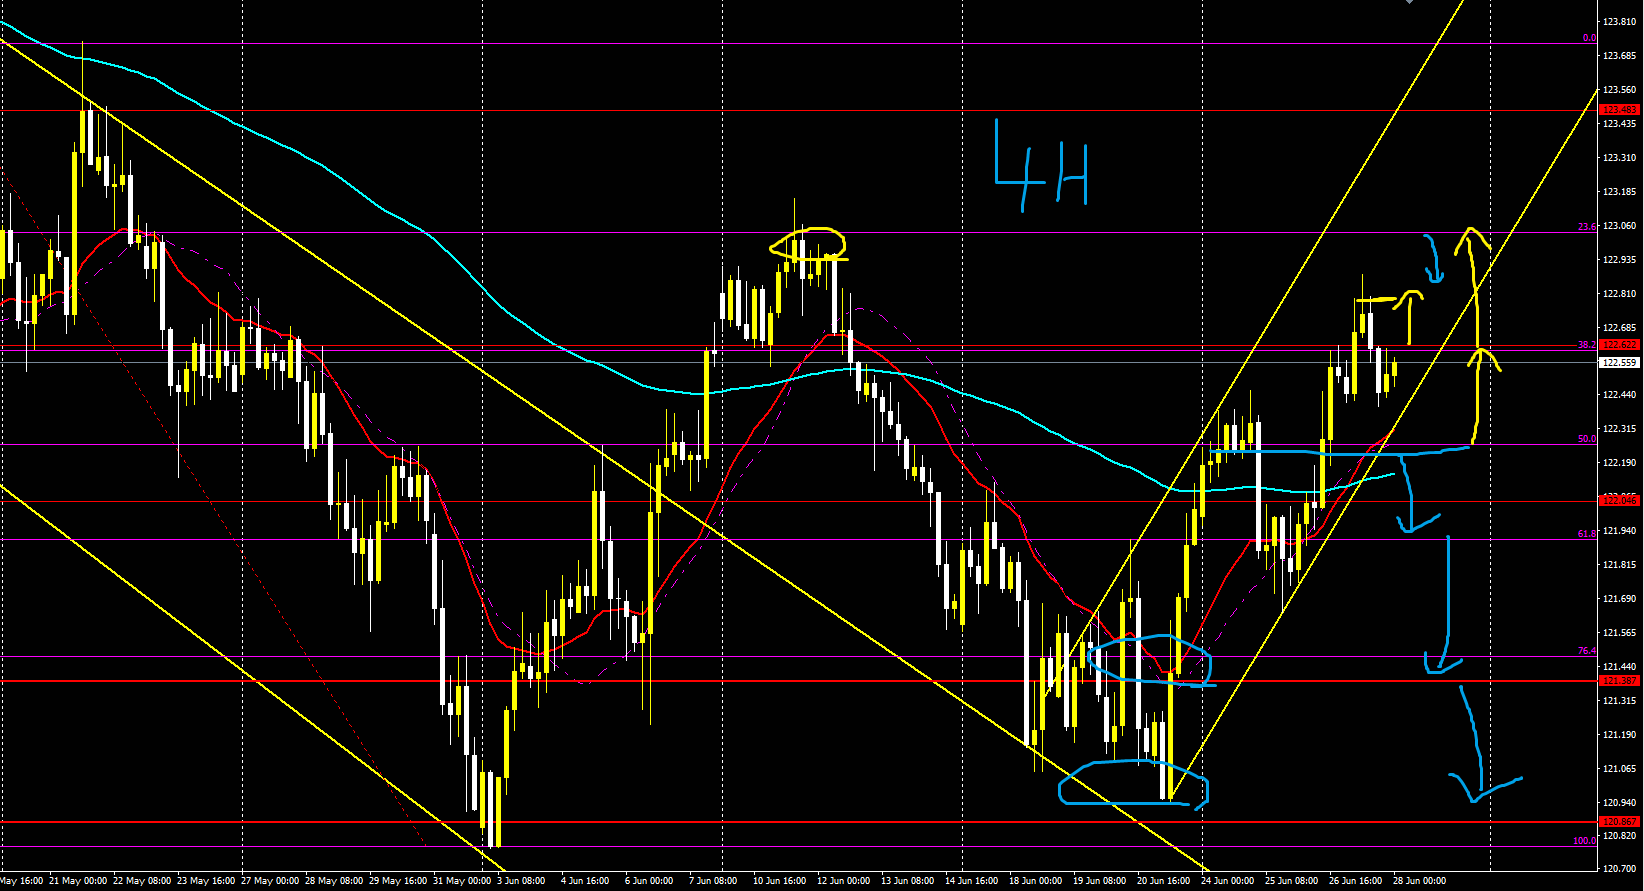
【CAD/Yen (CADJPY)】
Trading difficulty: A
Long-term is slightly up, short-term up
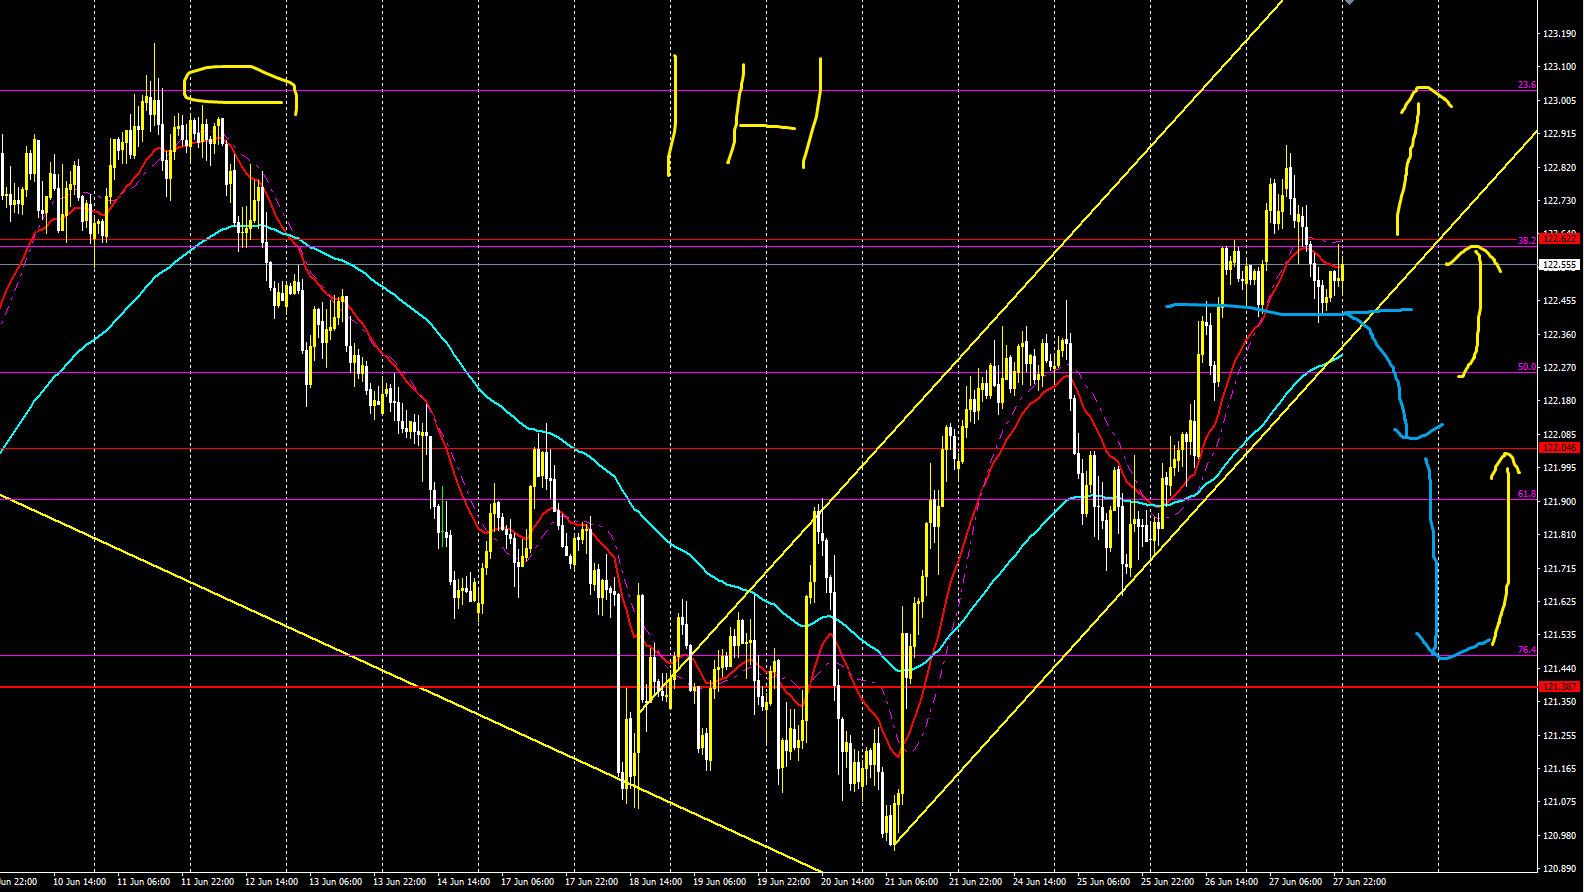
Currently forming a flag, so I drew a channel
Necklines up and down with a channel
Short strategy should refer to the previous waves
If we assume a current peak, the short strategy is to the lower neck
From the lower neck or bottom, go long to the top region
If it simply rises, go long to enter
4 hours
1 hour
【EUR/AUD】
Trading difficulty: A minus
Long-term is up, short-term down
On the daily chart, the uptrend is currently pulling back and has broken the channel
It is a scene to take a reversal-short to catch the pullback, but it wouldn’t be surprising if buying comes in at any time
Once a line is drawn, observe and short is okay, but don’t be greedy
If going long, it is prudent to wait until it moves above the MA
4 hours
1 hour
【Afterword】
The arrows written in the image point to the favorable direction
Yellow indicates the upward direction
Light blue indicates the downward direction
It merely indicates a direction with relative advantage; it does not guarantee a response or rebound at those levels
The market forecasts and strategies I publish weekly on YouTube have been generally accurate
What matters is how to apply that to trading entries
When market strategies were correct or incorrect, approaches to trading and thinking change
And please consider entries as a separate matter


