Learn How to Create Trading Plans from a Currency Exchange Broker | Episode 21: Incorporating the Third Wave Theory into USD/JPY Market Analysis (14) [Toshirō Asano]
Toshio Asano will thoroughly teach the buying/selling methods and market insight construction techniques grounded in his own experience and knowledge in this project. This time as well, he will continue to interpret the recent and future USD/JPY market, and then present the most suitable trading plan.
*This article is a reprint and revised edition of an article from FX攻略.com January 2019 issue. Please note that the market information written in the main text differs from the current market.
Toshio Asano Profile

Asano Toshirou. He has worked at Tokyo Forex, a foreign exchange trading broker of the Tokyo Short Group, and at EBS (now ICAP), which boasts over 80% global market share in the currency trading world. He experienced historic markets firsthand, including the 1985 Plaza Accord, the subsequent era of strong yen, the bubble burst, and the euro integration in 2000, cultivating his market view. He later founded two FX trading companies and also worked as a dealer at a private FX fund. Currently, he writes for a daily blog in the Investing School Group. He is also a strong advocate of easy-to-understand video works that leverage his specialty in video editing.
Add High (R) and Low (S) and Q-Rmid
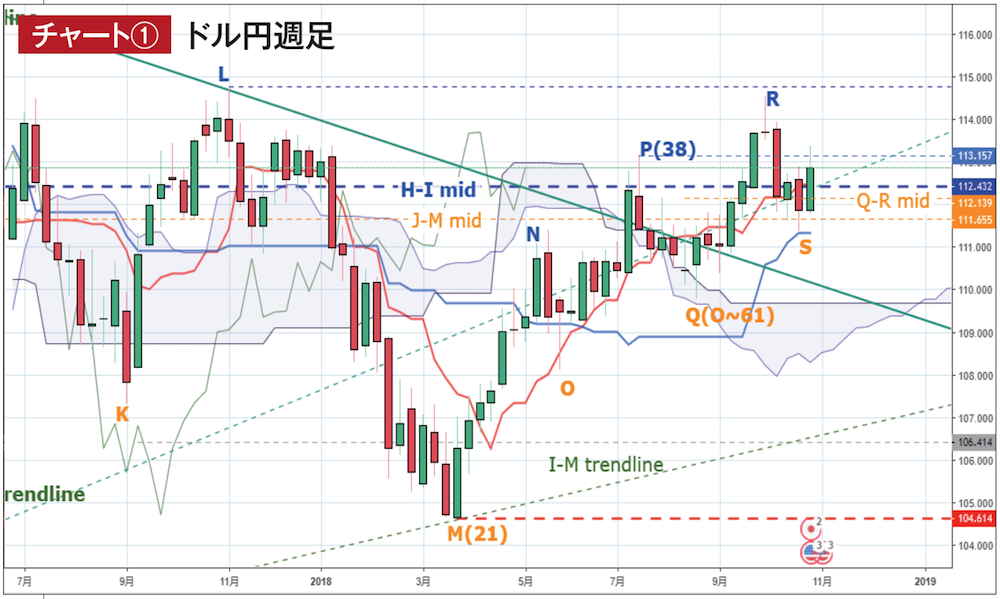
Chart ① Source:USDJPY chart by TradingView
Now, before we proceed to weekly analysis, here are this month’s revisions (Chart ①). First, for the newly formed pullback wave over the past month, we temporarily added a high R and a low S. I considered moving N-O-P-Q up by one wave each, but since the time from O for the three-wave sequence remains two weeks, I will leave it as is this time as well. Since R-Smid corresponds to the conversion line and O-Rmid corresponds to the baseline, I added Q-Rmid anew. I will not touch the numbers in parentheses for now.
Weekly is near a range and market conditions are difficult
Now, regarding this month’s weekly chart, since the general trend hasn’t changed much, I’ve narrowed the range compared to usual to make it easier to compare the small upswings after the low M with the daily chart. Of course, if we surpass the important pivot high L, the next clue for a higher high will lie further back in time, but currently we are moving within a range between L and M. Looking only at this range, the decline period between L and M is faster than the subsequent rise after M, and the rising momentum is weak—this is a constant concern. However, the current market favors chasing the ascent from M (details in the previous issue).
The wave from M-N-O has expired, and now the focus is on M-P-Q or O-P-Q. As noted, with the three-wave sequence O-P-Q-T (T provisional) still ending in about two weeks, we would like to reach at least N’s calculated value of 114.83 yen within that period, though the price range appears quite tight. If we cannot surpass R and this three-wave completes, we should be mindful that next we can only expect M-P-Q-T.
From M onward, the high calculated values have not yet been achieved even once, primarily because each pullback from N-O, P-Q, and R-S was too deep. This suggests the price movement is close to a range market and is more difficult than it appears. Nevertheless, as a basis for assuming an uptrend, once the Ichimoku indicators improve, the condition stabilizes, and the recent low S is just barely supported by the baseline, with a subsequent recovery of the conversion line in the following week, which is not bad. The conversion line will likely dip again, but for now we should focus on which direction this newly formed R-S will break and watch for a domino effect of breaking R and exceeding L.
Finally, one point: the low S that held at the baselines is actually at the upper limit of the monthly leading span, so it will continue to be an important lower target. The daily chart will touch on this as well.