

Learn from a currency broker on how to create a trading plan | Episode 28: Yen-Dollar market analysis incorporating the concept of three waves (21) [Toshirō Asano]
Toshio Asano shares his trading methods and market intuition built from his own experience and knowledge, in a book project that leaves no method uncovered. This time as well, he will continue to interpret the recent and future USD/JPY market, and then present the optimal trading plan.
*This article is a reprint and revision of FX攻略.com’s August 2019 issue. Please note that the market information written in the body may differ from the current market.
Toshio Asano Profile

Asano Toshirō. Has worked at Tokyo Forex Information Center, a foreign exchange brokerage of the Toho-Takken Group, and at Tokyo Forex (Tokyo Forex Co., Ltd.), as well as at EBS (now ICAP), which boasted over 80% global share in foreign exchange trading. He experienced legendary markets firsthand, including the Plaza Accord in 1985, the subsequent era of strong yen, the bursting of the bubble, and the euro introduction in 2000, thereby honing his market sense. Later he founded two FX trading companies and also worked as a dealer at a private FX fund. Currently, he writes for the Daily Blog of the Investment School Group. He is also a popular figure for easy-to-understand video works that leverage his video editing skills.
Weekly chart focuses on the decline wave after P
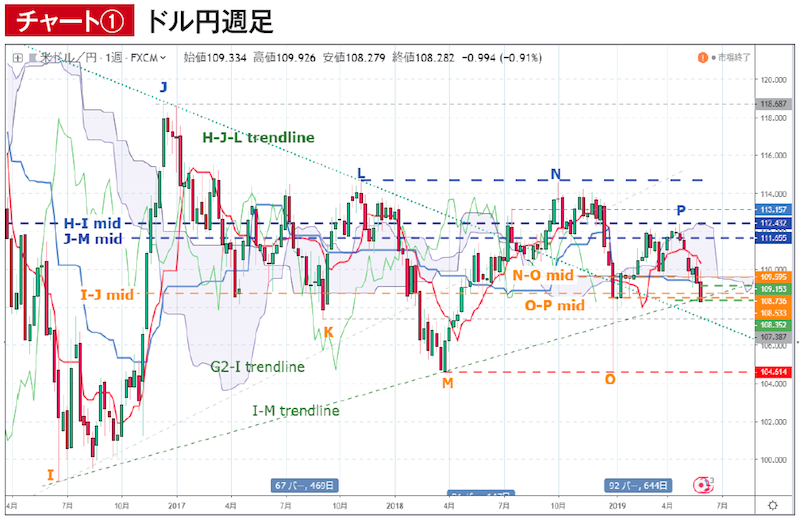
First, regarding the corrections in this month’s chart, both the recent high P and low Q have been updated due to the downward movements since May, so on the weekly chart (Chart 1), P has moved to a new high, while the downside is still being updated in the current bar, and Q temporarily disappeared. The newly established high P became decisive in the subsequent decline, so although it is close to I–J mid, O–P mid has been added.
At the time of the previous issue’s weekly chart, it showed up to the “combing” bar just before the new high P. It had closed above the leading span and had room to continue rising, but in the following week, which is the week just before the Golden Week, after hitting a high P, it moved into the leading span and ended there, and subsequently the price fell below its lower bound abruptly.
In the process of forming P, the lagging span was expected to turn favorable, raising expectations for higher prices, but ultimately the upper limit largely coincided with the H–I mid level, and the impact of the downward wave from H–I continues to act as downward pressure. By the end of last week, excluding that the conversion line had maintained a favorable turn, this week has become a critical one that could sharply break below the half-range level of all consolidation waves from H–I onward, potentially restarting the downtrend.
With only about three weeks left before the conversion line enters a passive decline, an active reversal would require breaking below the 106 yen level; even if that does not happen, after a passive start of the decline, during the second week the baseline line will move away from the O downside target and rise sharply, making a reversal inevitable. Of course, scenarios that overturn expectations exist, but in the near term, it would be natural to chase the downward waves after P, using the lower bound M–O of the big consolidation as a guide, toward the P onward declines.
The two horizontal green dashed lines added to the right side of the chart indicate the lower bound of the monthly leading span, with the lower bound in May and the upper bound in June. As June approaches from now, the question is whether the upward expectation can quickly recover the June lower bound and, by stepping on the five lines of the converged Ichimaku chart, restart the three-wave sequence of I–J–M–X (X provisional). Timing to watch is around the end of June.


