Is there a “trend” in the gold daytime movement? Compare the real price action with the arranged “random” moves
Verification Notes | I counted the Gold "common sense" — Part 1
"Gold tends to form trends" "If you ride the trend you will win." These are phrases commonly seen in explanations of FX and commodities.
The author is researching short-term trading rules for gold. In doing so, I have checked, one by one on past 1-minute charts, whether these kinds of "common sense" actually show up in numbers. In this series, I will present those results together with diagrams.
The theme of Part 1 is"Is there a daily trend in gold intraday?".
【Author's indicator】Using a 5-minute GOLD chart, the MT5 indicator "CALDO GOLD AI" shows entry points, stop loss guidelines, and exit signals. The results of the signals — wins and losses — are published as records. For details,CALDO product page.
Now, a quiz: Which one is genuine?
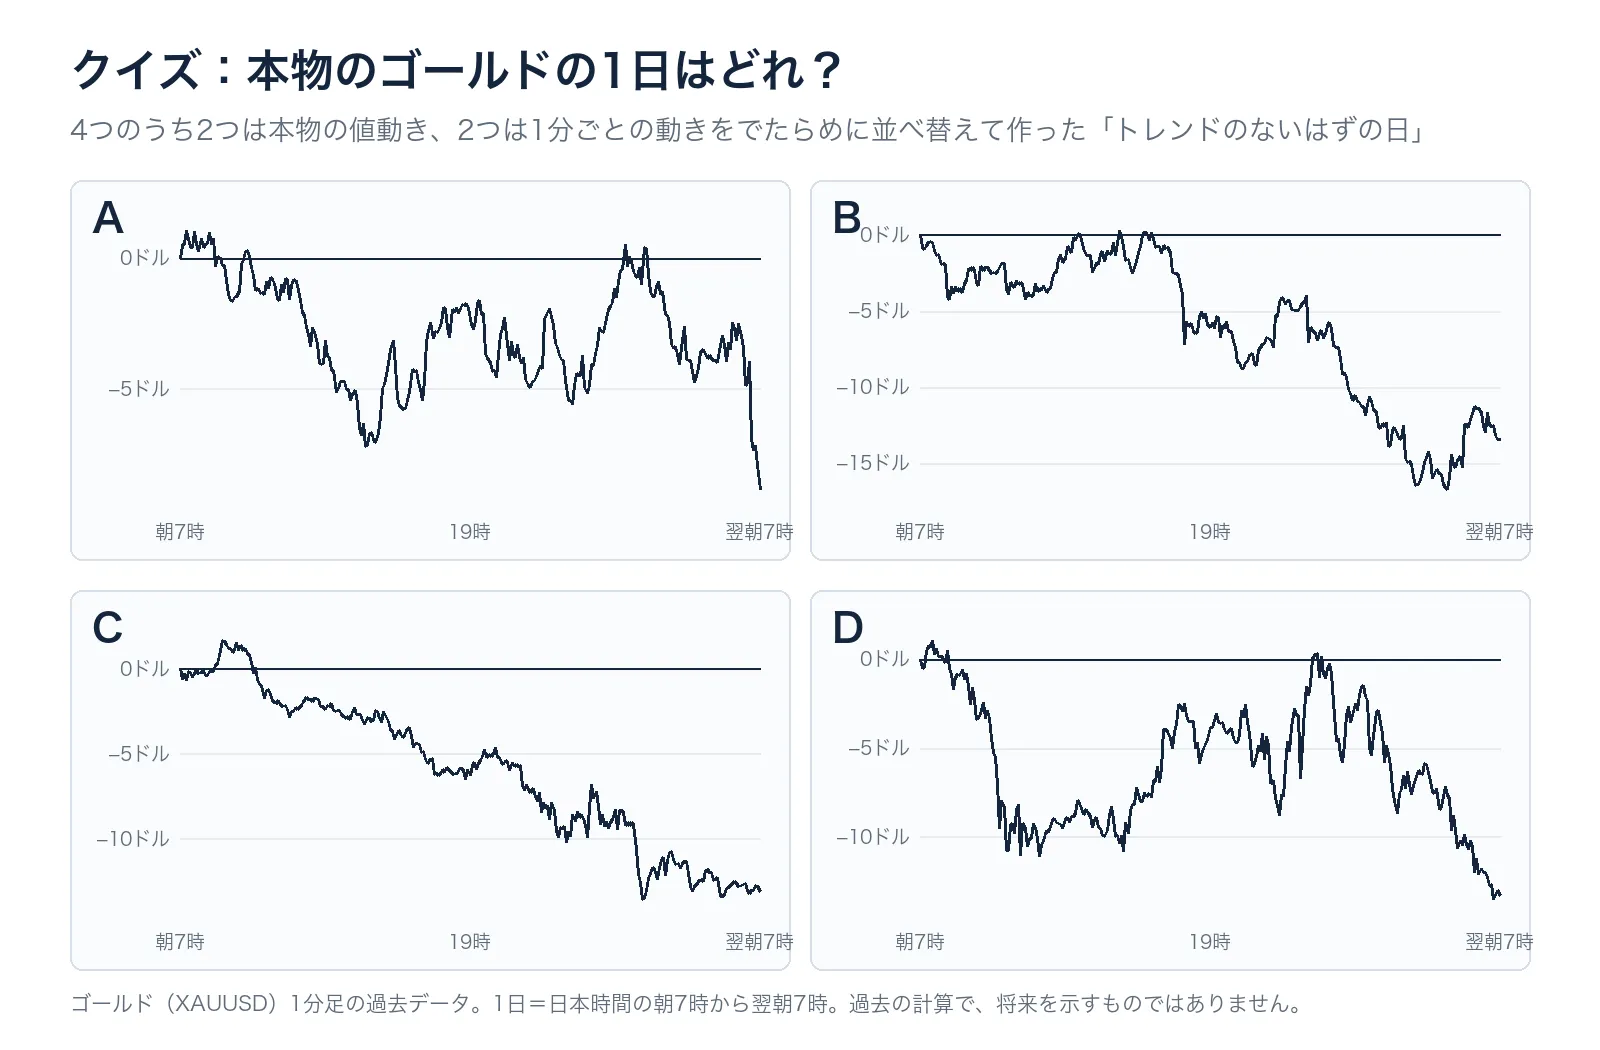
Two of the four are the actual gold movement for one day (Japanese time 7:00 AM to 7:00 AM the next day). The remaining two are created by rearranging, in random order, a day's minute-by-minute ups and downs.A day formed by only the order, without considering flow.
The rearranged days have the same highs/lows, opening, and closing prices as the original day, but because the order is random, they should lack the "flow" or "momentum."
All four are days that ended significantly lower than the opening price. Which one is genuine? The answer appears later in the article.
How to verify: compare the genuine day with the rearranged day
For gold, 2,581 days from 2010 to 2019 were used to create rearranged days by shuffling the 1-minute movements 200 times day by day. Then,how many days are one-direction days in the genuine days versus the rearranged days was counted.
One-direction day means a day where the movement from open to close (the candlestick body) covers 70% or more of the day's range from high to low. When you look at a chart and feel that "today there was a trend," this is usually the shape.
If gold price movements have a property of "once they start moving, they continue," the genuine days should have more one-direction days than the rearranged days.
Result: One-direction days occur at roughly the same rate as random days
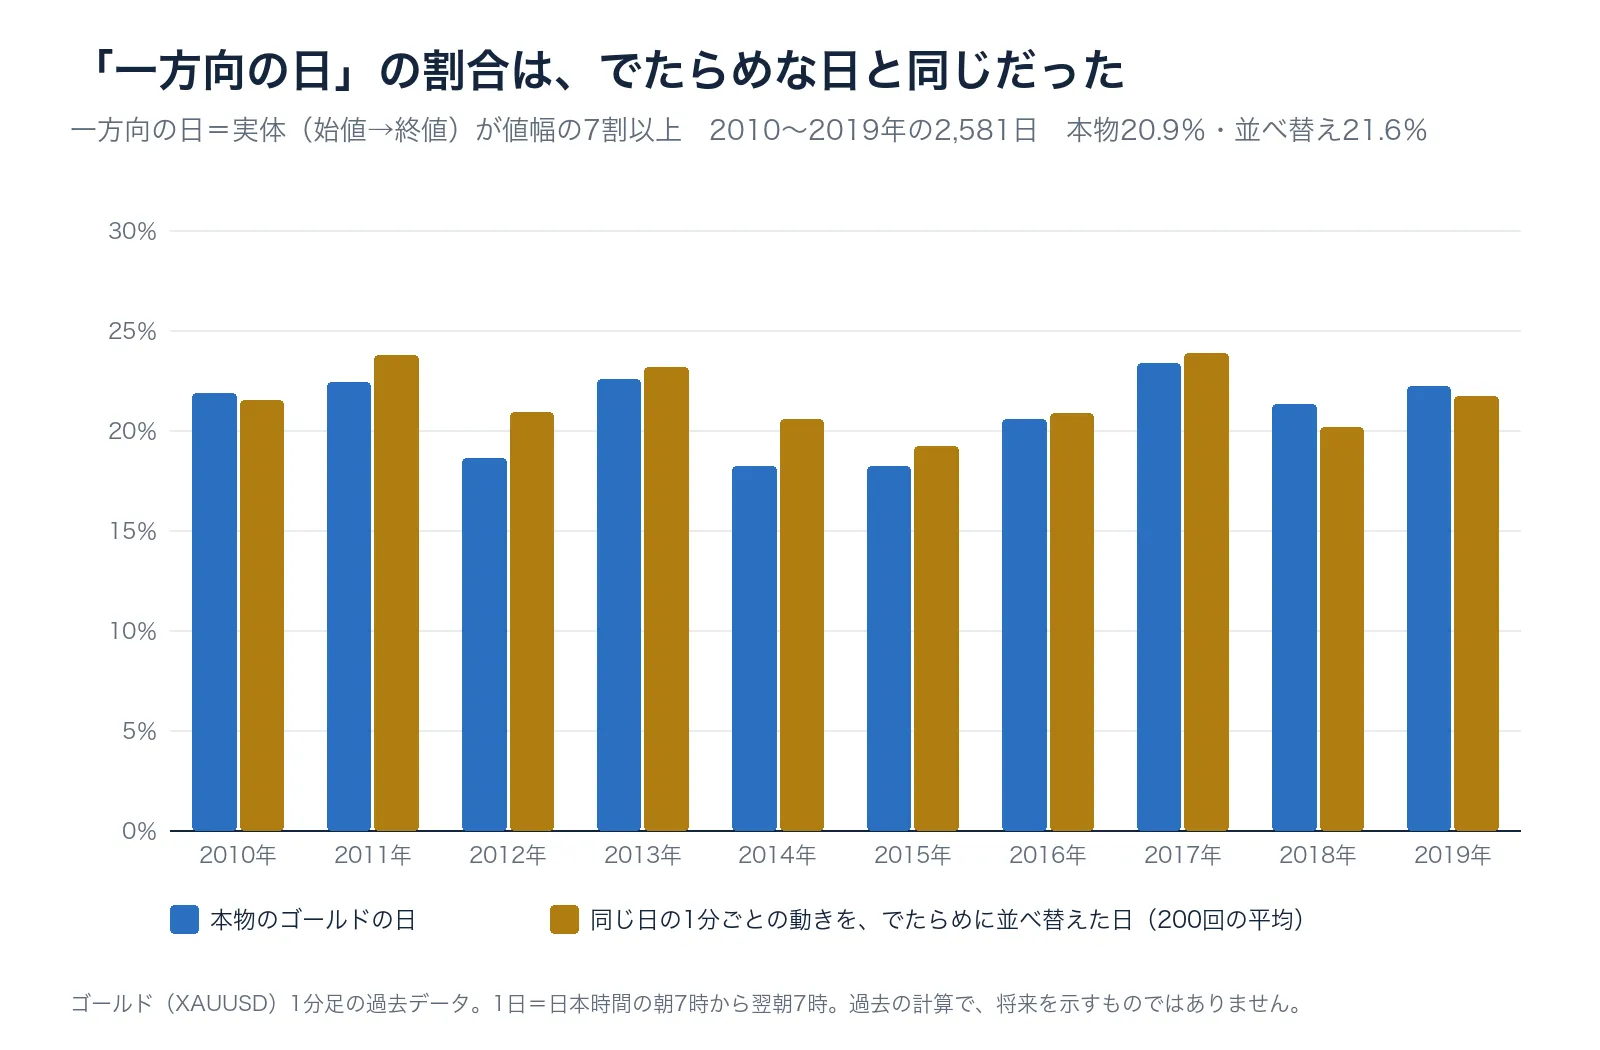
Among the genuine days, one-direction days were20.9%, while among the rearranged days they were21.6%. They were almost the same, with the genuine days being slightly fewer.
Looking across years, the differences are within 2.4 points for all years. The years when genuine days were more frequent occurred only 3 out of 10 years.
In other words,about one in five days shows a "trend day," even if the price movements are random. When you look at the chart afterward, a clear flow may appear. But the frequency of that "flow" could not be distinguished from random price movements.
What you will learn next
- The answer to the quiz and clues to distinguish genuine days from rearranged days
- A comparison of the distribution of "straightness" within a day (diagram)
- If you look at shorter timeframes (5 minutes to 4 hours), is there a trend?
- Is this the same for gold after 2020 (up to September 2026)
- Results confirming "riding the momentum partway through" as a trading approach
- Three questions to ask when you see methods described as "capturing a trend"
You can read the continuation with a free view
The continuation can be read with a free-view of this article. Those who sign up may receive notices useful for understanding gold price movements, including the next installment of this series.