Financial Instruments Business Operator Kanto Finance Bureau Director (Kinsho) No. 1960 / Membership Association Investment Trusts Association, Japan Membership No. 012-02323Go to GogoJungle Home
As a developer of image recognition algorithms, I, go_stock, am utilizing my knowledge and statistics in system trade rule development. I started interest in stock trading by writing my own program in Ruby to develop rules and begin operation. In the first few months, I achieved nearly 10% monthly returns, but gradually things started to go poorly, leading to continued losses. When I began to feel the limits of my own program, I learned about Izanami and purchased it immediately. I am deeply grateful for its overwhelming development efficiency and ease of fund management! The guiding principle for rule creation is that it should be easy to continue even as a side job. After all, I can’t monitor prices during the day. And my goal is to travel to all the World Heritage sites around the world with passive income earned from trading, savoring local cuisine and drinks. If possible, in business class ^^; And from 2020, I started FX system development with MT4 as well!! I’m once again hooked on indicator development.
AI indicator that looks not only at “likely to win” but also at “likely to move” – GS's AI Confidence Signal for 15M. I would also like to provide a weekly performance and confidence explanation. If busy during the day and thinking semi-automatic is better, I hope it can help both registered users and unregistered readers understand the market.
GS's AI Confidence Signal for 15M Weekly Report ~2026.11.7
0
0
GS' AI Confidence Signal for 15M
Weekly Report
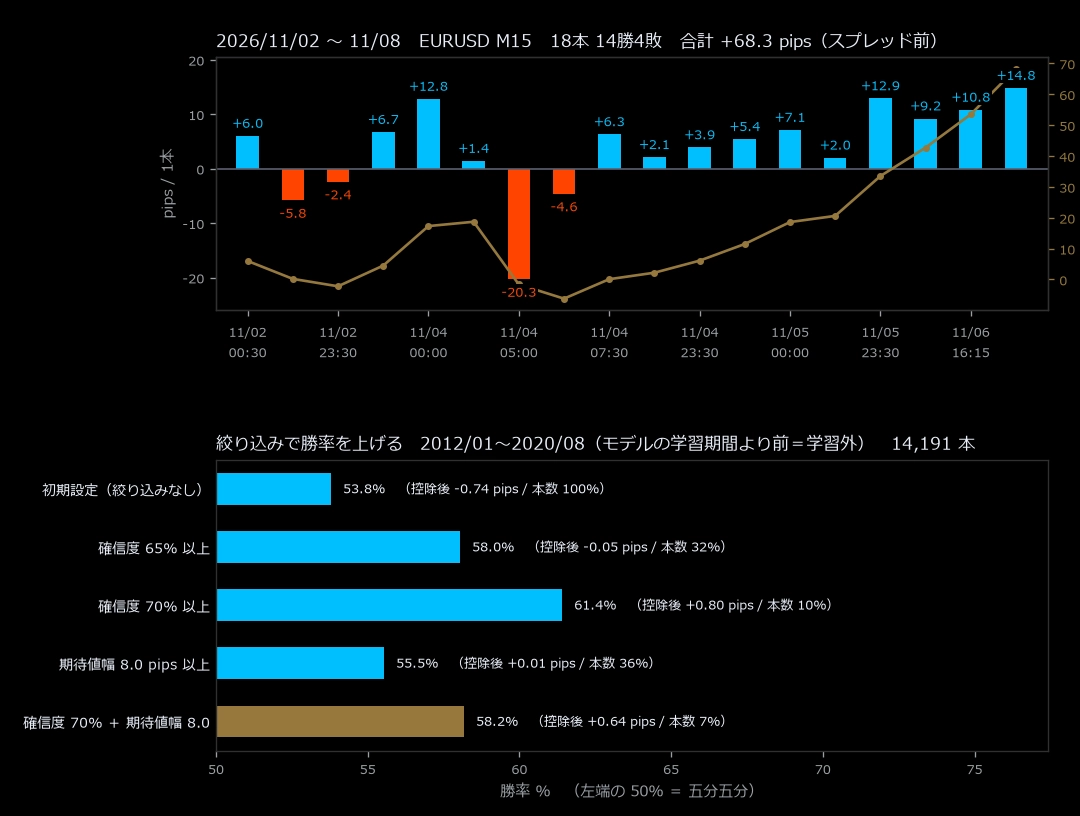
EURUSD / M15Period: 2026-11-02 to 2026-11-08Data basis: Server time
This Week's Summary
Signals
18signals
Buy 18 / Sell 0
Win rate
77.8%
14 Wins 4 Losses
Total
+68.3pips
Net after deduction +50.3 pips
Per trade
+3.8pips
Net after deduction +2.8 pips
Largest win / loss
+14.8 / -20.3
pips (gross)
ATR14
6.5pips
Movement estimate for one 15-minute bar
The numbers above aregross (before spread)If you subtract the 1.0 pips round-trip costtotal +50.3 pips / per bar +2.8 pipswill be the result.
This Week's Signal Status
Date/Time
Direction
Confidence
Expected Range
Entry
Exit
Result
Judgment
11/02 00:30
Buy
62%
5.0
1.11558
1.11618
+6.0
○
11/02 23:15
Buy
67%
5.6
1.11915
1.11857
-5.8
×
11/02 23:30
Buy
66%
5.3
1.11904
1.11880
-2.4
×
11/03 00:00
Buy
74%
7.1
1.11853
1.11920
+6.7
○
11/04 00:00
Buy
75%
5.4
1.11940
1.12068
+12.8
○
11/04 04:30
Buy
59%
6.0
1.12457
1.12471
+1.4
○
11/04 05:00
Buy
59%
5.4
1.12532
1.12329
-20.3
×
11/04 07:15
Buy
60%
6.6
1.12288
1.12242
-4.6
×
11/04 07:30
Buy
59%
5.7
1.12285
1.12348
+6.3
○
11/04 23:15
Buy
66%
5.9
1.12303
1.12324
+2.1
○
11/04 23:30
Buy
71%
7.4
1.12293
1.12332
+3.9
○
11/04 23:45
Buy
73%
7.7
1.12283
1.12337
+5.4
○
11/05 00:00
Buy
72%
6.9
1.12279
1.12350
+7.1
○
11/05 23:15
Buy
67%
6.2
1.12174
1.12194
+2.0
○
11/05 23:30
Buy
67%
5.9
1.12172
1.12301
+12.9
○
11/05 23:45
Buy
65%
5.0
1.12169
1.12261
+9.2
○
11/06 16:15
Buy
64%
6.0
1.11370
1.11478
+10.8
○
11/06 16:30
Buy
63%
5.7
1.11337
1.11485
+14.8
○
Entries are the open of the next bar after the signal, exits are the open of the bar after 8 bars (2 hours). TP/SL are not used.
AI's View of This Week's MarketWeekly Insight
Weekly High-Low
142pips
Difference between weekly high and low
Weekly Change
-20pips
Difference from the opening price at the start of the week
ATR14 (Average)
6.5pips
Movement estimate for one 15-minute bar
AI Confidence (Maximum)
75%
Expected range (Maximum) 7.66 pips
This week's EURUSD had a weekly high-low of 142 pips and finished -20 pips from the week's opening price. The ATR14 for one 15-minute bar is about 6.5 pips on average.
There were 18 signals (buy 18 / sell 0), with 14 wins and 4 losses, totaling +68.3 pips. Subtracting a round-trip of 1.0 pips yields +50.3 pips.
Confidence ranges from 59% to 75%, and the expected range is about 5.0 to 7.7 pips.
Applying the recommended filter below (confidence 70% + expected range 8.0) to this week results in 0 remaining signals. The filter isdesigned to reliably reduce signal count. Please use under the assumption that only a few signals appear per week.
Recent Trends6 weeks
Week 40 (09/28〜)
9 bars
+20.9
Week 41 (10/05〜)
11 bars
+64.8
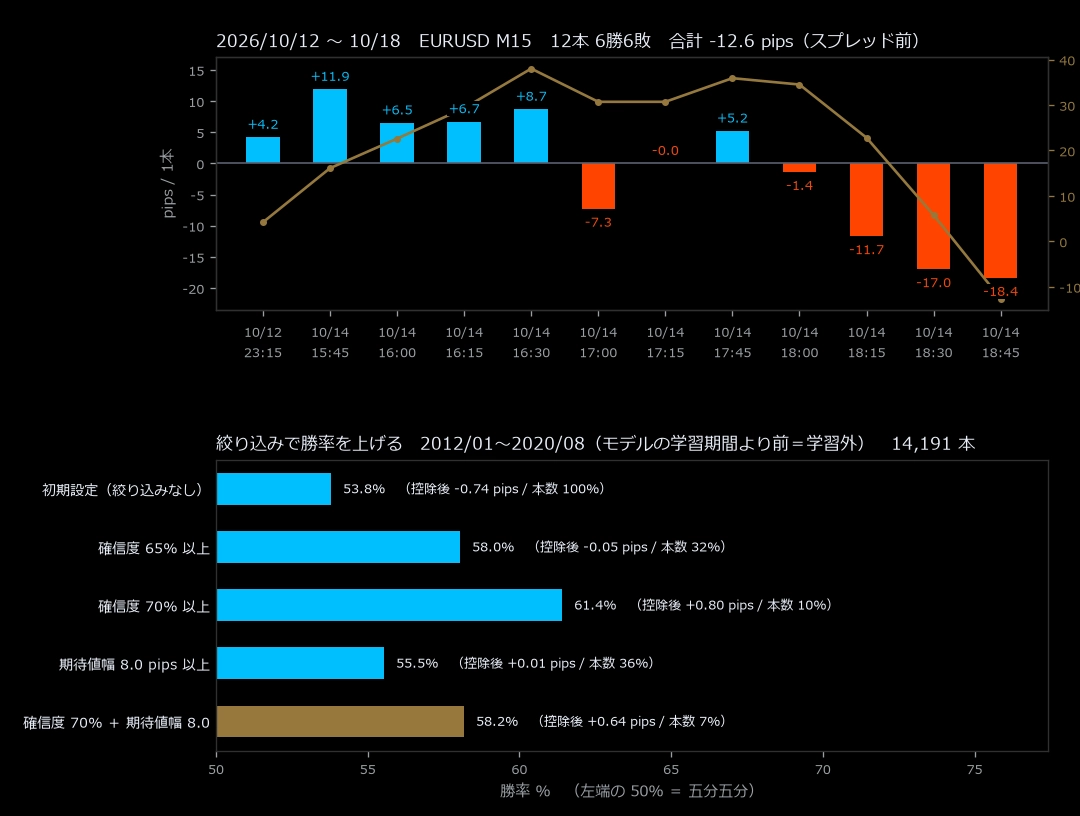
Week 42 (10/12〜)
12 bars
-12.6
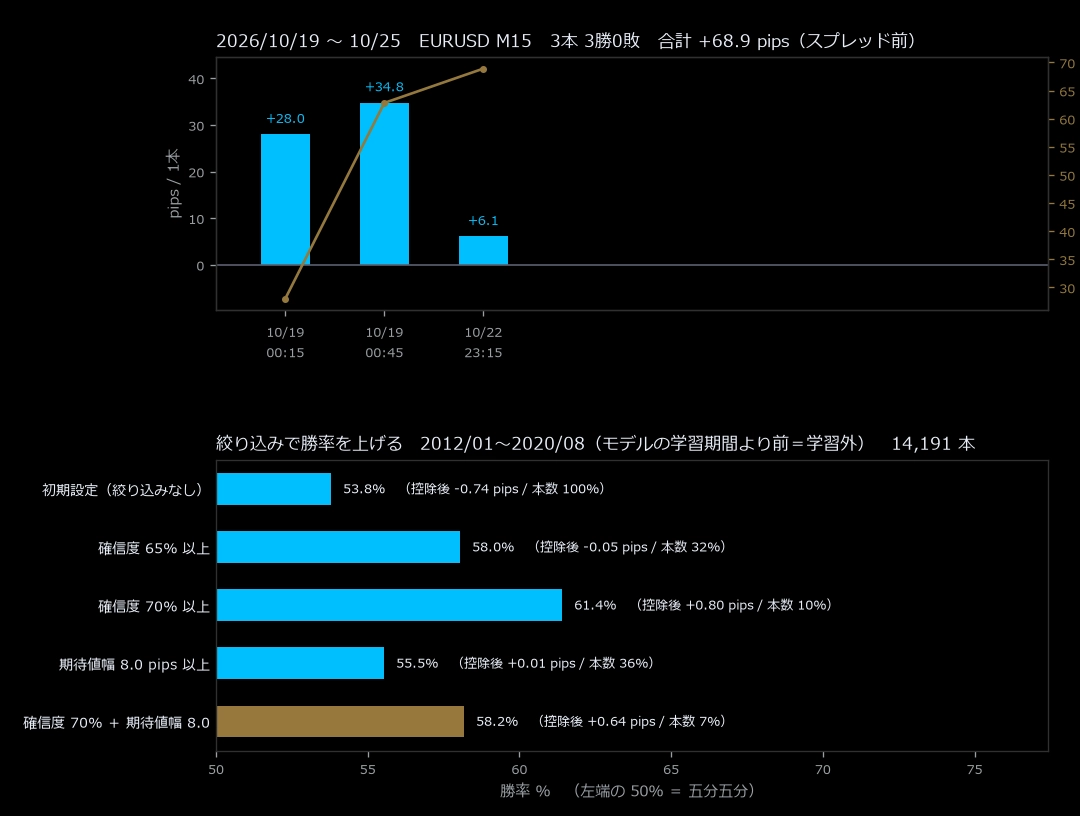
Week 43 (10/19〜)
3 bars
+68.9
Week 44 (10/26〜)
10 bars
-0.4
Week 45 (11/02〜)
18 bars
+68.3
The bars represent weekly total pips (pre-spread). The vertical line is 0.