

The requested translation is: What is the difference between during the candlestick formation and after confirmation?
In the gold 4-hour chart, the price fell to the horizontal line, and now it has risen back above the line.
However, if the 4-hour period has not ended yet, the candlestick shape can still change.
Touching the line and confirming above the line are two different things.
A candlestick summarizes the price movement over the designated period into a single bar.
The thick part is the body, and the thin lines extending above and below are called wicks or shadows.
If it is a 4-hour chart, the shape is only confirmed after that 4-hour period ends.
The body represents the range between the open price and the price at that moment.
The part extending above the body is the upper wick, and the part extending below is the lower wick.
A forming candle can still change
While forming, the lengths of the body and wicks change as the price moves.
Prices that were above the starting price can fall below before it ends.
The opening price does not change, but the closing price is not yet decided.
We separate the candles that have finished their shape (confirmed candles) from those that are still forming.
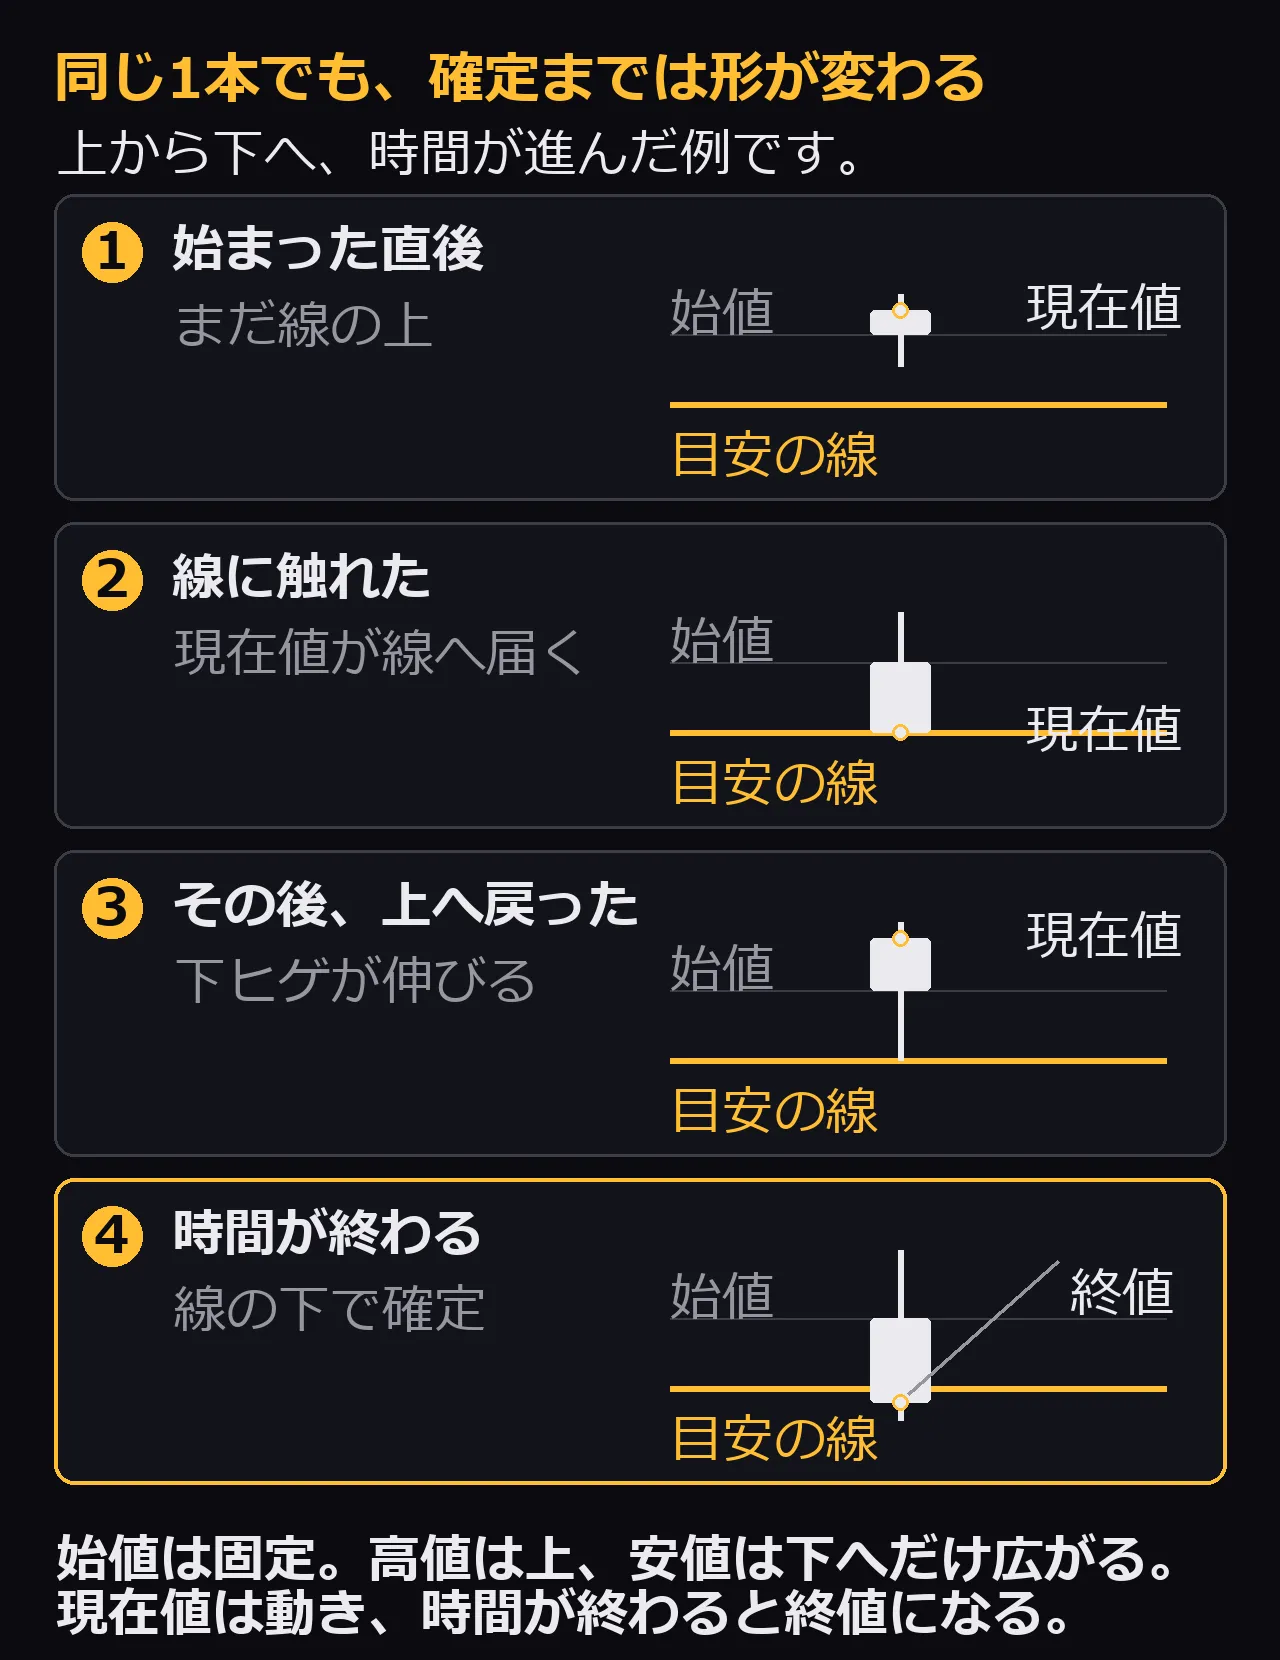
The figure shows the same candlestick changing in sequence from top to bottom.
We also distinguish the moment it touched the line and the moment it later rose above the line.
Even if it moves back up in the middle, it may end below the line at the end.
We are not avoiding looking at candles that are forming itself.
We view it as a progress showing how far it has moved up to now.
This is a distinction from treating it as the same as the confirmed candle results.
Difference between open, high, low, and close
Open is the price at which the candle started, and it does not change while forming.
High is the highest price during that time period.
For the same candle, it remains the same or can be updated to a higher value.
Low is the lowest price during that time period.
For the same candle, it remains the same or can be updated to a lower value.
The high and low seen during formation are records up to that moment.
If a new high or low appears before the candle closes, the wick tips extend.
During the formation, the relationship between open and the current price changes, so the direction and size of the body can change.
The value at the end of the period is the close.
The position of the close can continue to move until it is confirmed.
When a candle becomes confirmed, the four values open, high, low, and close are fixed, and the shape of that candle no longer changes.
Subsequent price movements are recorded on the next candle, and the four values of the confirmed candle do not change.
Touching the line and where it confirmed
Here we use a non-moving price horizontal line as an example.
If a candle starts above the line, and the low is at or below the line, we know it “reached the line.”
If it started below the line, we check whether the high is at or above the line.
If it starts at the same position as the line, it has touched the line at that moment.
Where it ends is confirmed by the close.
Even candles that started from above the line and rose to the line can be confirmed above the line if the close is above the line.
If the close is below the line, it is confirmed below; if the same, it is confirmed on the line.
Touching the line and where it ended are separate concepts.
Check again when the next 4-hour candle starts
Even if a long lower wick appears during formation, that is only a midway point.
When the next 4-hour candle starts, review the low and close of the previous candle.
See whether the low reached the horizontal line.
Next, check where the close is relative to the line: above, below, or on the line.
Confirm these two points separately.
In the diagram, the candle touched the line and moved up, but the close is below the line.
“Reached the line” and “recovered above the line and closed above” are not the same result.
Even by comparing only one candle—visible during formation—with its confirmed form, you can see this difference.
Related articles
・Difference between FX indicators and automated trading
https://www.gogojungle.co.jp/finance/navi/articles/130581
A free MT5 display tool created by Awagoru, “Awate nai EA,” shows the intermediate progress during formation separately from the results when the 4-hour candle is confirmed. It does not perform automated trading.
https://www.gogojungle.co.jp/tools/indicators/89463