
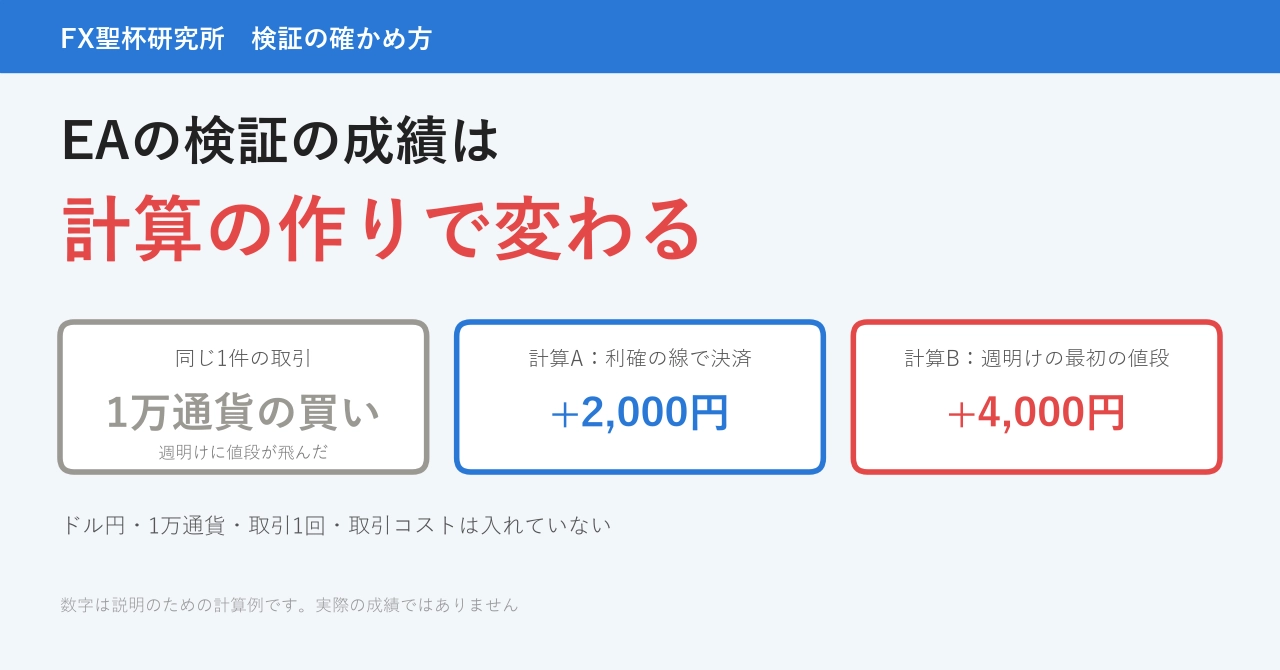
The results of validation using EA's historical data vary depending on how the calculation is constructed. The procedure and reason for my cross-checking my own validation against MT5's tester one by one
I am the director of FX Holy Grail Research Institute. I am a 50-year-old systems engineer who records trying out automated trading strategies that look like they might win, validated against historical data and then broken down.
When I test trading rules against historical data, I use a verification program I wrote myself. Today I will describe the work I did before trusting the numbers from that program. It’s a story about comparing the MT5 (FX trading software) tester against each individual trade.
All numbers mentioned in this article are calculation examples for explanation purposes.These are not my own verification results or performance. I do not present the numbers from the side-by-side comparisons (how many matched, how far off).
Conclusion
The tester is a feature attached to MT5 that allows you to test trades against past price movements. The numbers that appear on the product page under the “Backtest” tab for EA (an automated FX trading program) are, I believe, generated by such a trading software’s verification function.
Three takes from the cross-checking results are as follows.
- Even with the same trading rules and the same period, the results differ if the calculation method differs.In the calculation example, simply the treatment of the price for one settlement caused the profit/loss to double.
- Therefore, your own verification numbers should be compared with the tester trade-by-trade before use.The items to compare and the passing threshold were decided before the comparison.
- Even on product pages, first confirm where the numbers come from.The numbers on the “Backtest” tab and those in the Performance/Results section come from different methods.
Why compare trade-by-trade
How much do differences in calculation methods move the profit/loss? We’ll look at it with calculation examples.
Suppose you buy 10,000 units of USD/JPY at 149.800 and place a take-profit line at 150.000. Take-profit means you automatically close the trade when it reaches the line.
The last price on Friday was 149.950. But on Monday at the open, it started at 150.200. The price jumped over the take-profit line during the weekend and began above it.
At this moment, which price you use to settle the trade depends on the calculation method.
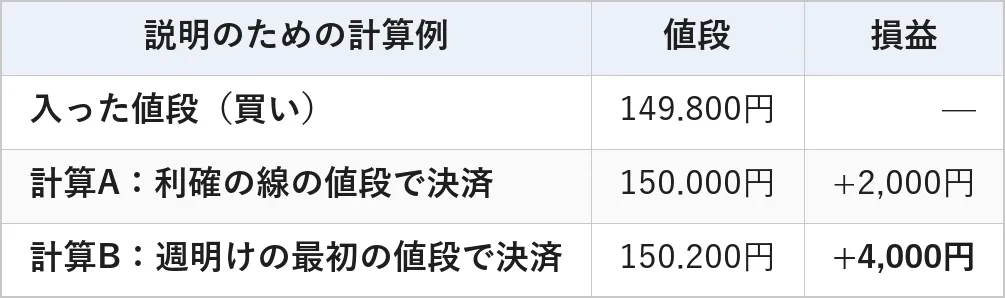
Condition: USD/JPY, 10,000 units, 1 trade. Trading costs (the difference between buy and sell prices and fees) are not included. This is a calculation example for explanation.
Calculation A assumes settlement at the take-profit line of 150.000. Profit is +2,000 yen. Calculation B assumes settlement at the first price of 150.200 on the following Monday. Profit is +4,000 yen.
The same trade yields two different profits in a single trade. If such differences accumulate over hundreds of trades, the total performance becomes a different thing altogether. Which handling is correct is not stated in this article. What matters isknowing which handling your own calculation uses before you apply it.
I created a small EA just for verification
For the cross-check, I created a small EA just to verify things. It has almost no decision-making rules for trading.
The reason for making it small is to trace the cause when there is a mismatch. If the decision rules are complex, you won’t know whether the discrepancy came from the decision logic or from price calculation.
This EA is designed to run only inside the tester. If it were accidentally run on a real trading account, it would stop before placing any orders. It’s only used to test past price movements; no real orders were placed.
Line up one-by-one and decide the passing line in advance
The procedure is as shown in the figure below.
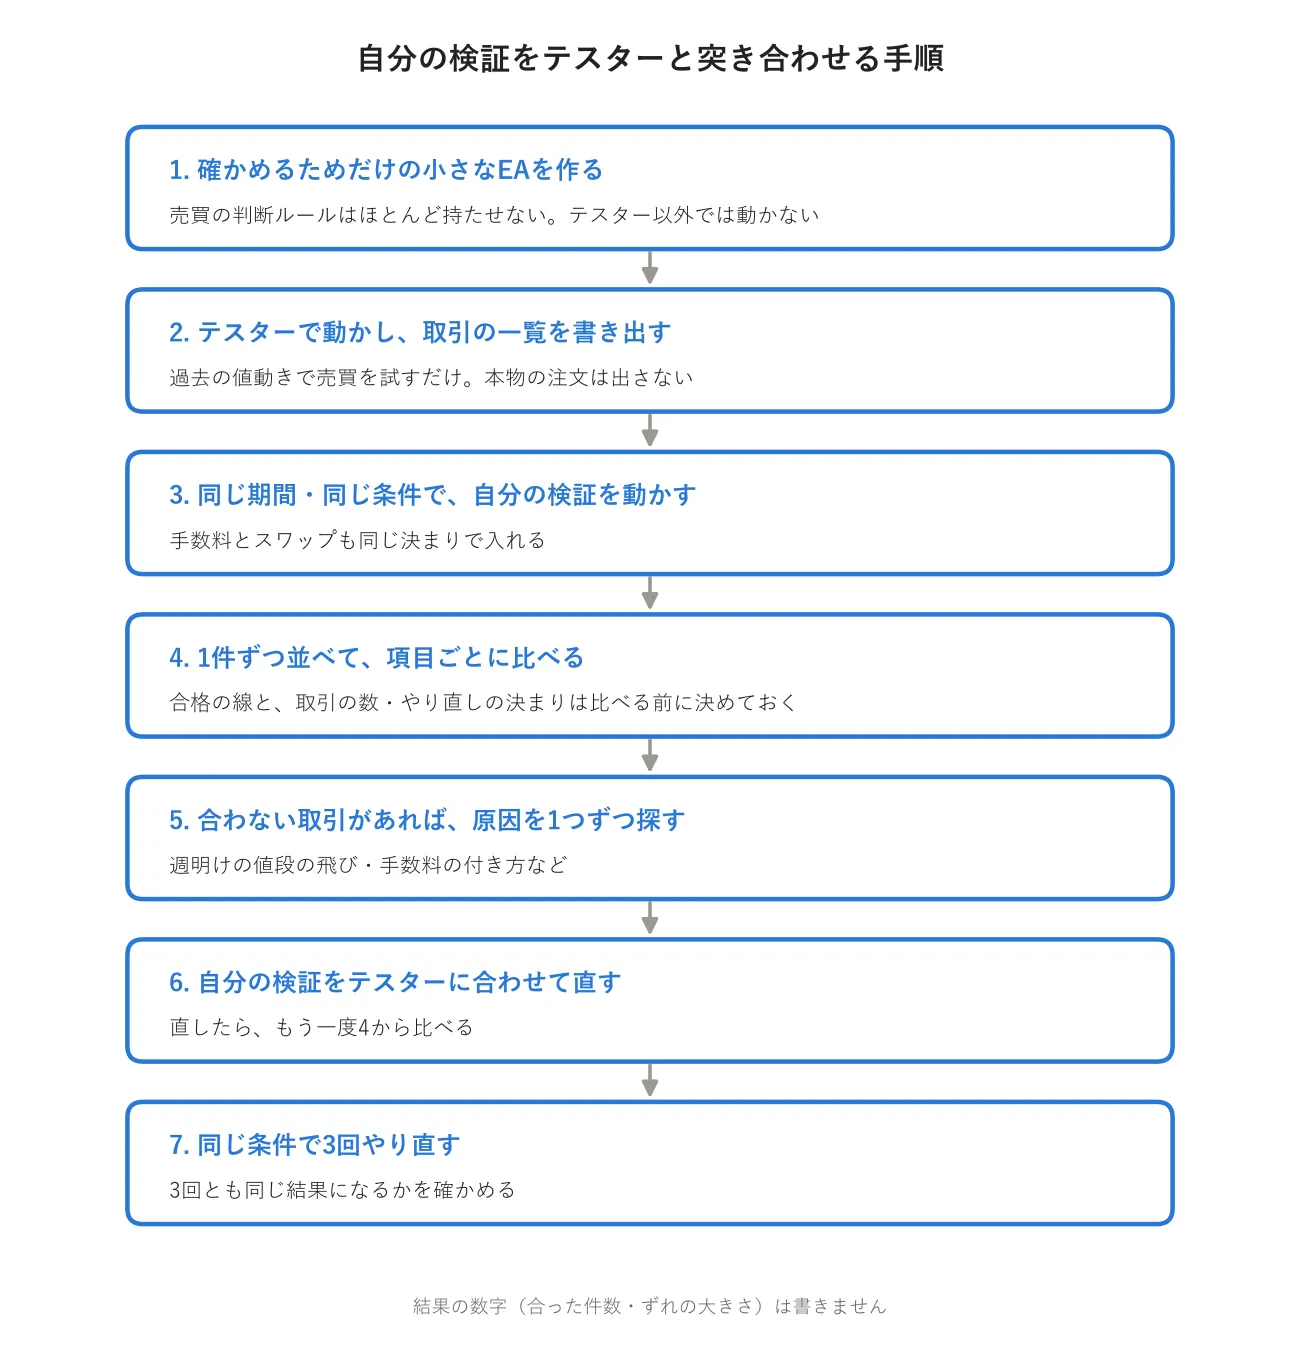
We lay the tester’s trades next to our verification trades side by side, one by one. The items compared and the pre-decided passing line (including rules for the number of trades and rechecks, a total of seven lines) are shown in the following table.
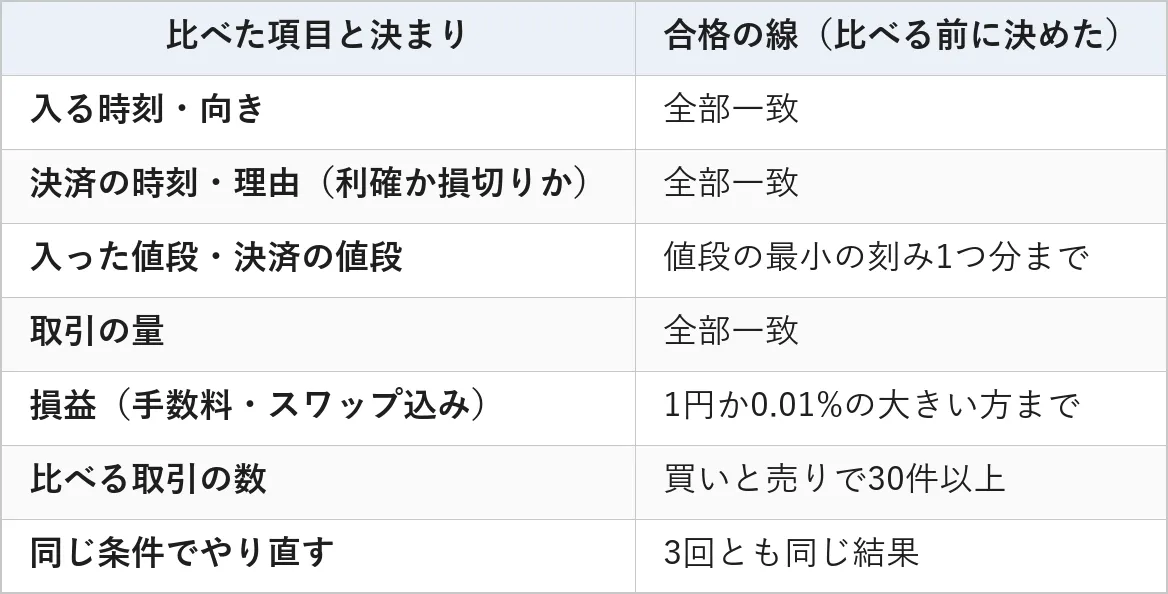
Profit and loss include commissions and swaps. Swap is the interest differential between two currencies if a position is held overnight. If you forget either, the profit or loss for each trade won’t match.
The passing line is decided before comparing results to prevent moving the line after seeing the results. If a mismatched trade would be made to pass by widening the line, it would defeat the purpose of the cross-check.
If mismatches occur, we investigate the causes one by one. The settlement price when price jumped at the start of the week, when fees are charged, which day swaps are accrued, and so on.
Aligning with the tester is about standardizing the yardstick
Once the cause is identified, I adjusted my verification program to align with the tester.
This is not because the tester is the same as the live environment. The tester also has a different way of placing values. For example, how to place the spread (the difference between bid and ask).
The adjustment was to standardize the yardstick. I read the numbers on the product page’s “Backtest” tab as produced by such a function. With a standardized yardstick, you can read your own numbers and the product page numbers on the same footing.
Differences with the live environment are measured separately. One such task is measuring the bid-ask spread by time of day.
Finally, I repeated the process three times under the same conditions to see if all three results were identical. If they differed each time, I could not decide which numbers to trust.
What to look at on the GogoJungle product page
From here, I’ll discuss where on GogoJungle product pages you apply this article’s approach. The item names reflect checks done on two best-selling product pages as of September 26, 2026, October 1, 2026, and October 19, 2026. Depending on the product and period, the display may differ.
Please view in the following order.
- First, confirm which tab the numbers come from.Product pages have “Forward Test” and “Backtest” tabs. The numbers in the performance column are from the forward test after listing. The historic data verification numbers are under the “Backtest” tab.
- Under the “Backtest” tab, look for the period and quality.Both pages list a period. The quality value (%) is shown for only one of them, and it isn’t always present on the best-seller page.
- The “Forward Test” tab should be read as performance for a period after creation.This is GogoJungle’s results run on a demo account with default settings. These numbers correspond to a period that cannot be created using past data.
Even for the same “Revenue” or “Maximum Drawdown,” the meaning changes depending on which tab and which method produced the numbers. This is the same question I asked when cross-checking my own verification with the tester.
Details on how to read the period and quality for past-data verification are described in the previous article.
Period and quality article: “EA verification with past data looks at ‘Period’ and ‘Quality’. Calculation examples where the same 100 trades yield PF of 2.33 or 1.00”:https://www.gogojungle.co.jp/finance/navi/articles/127333
Finally
In today's calculation example, the same single trade could yield +2,000 yen or +4,000 yen simply by how the settlement price is treated. Before using my own verification numbers, I cross-checked trade-by-trade with the tester and confirmed them with the pre-set line.
The cross-checking program and this article’s tables and figures were created with AI, and all calculation example numbers are verified by program.
I do not promise a method that guarantees winning. Still, I believe in a Holy Grail and keep searching. The Holy Grail I refer to is a trading rule that does not collapse even when including trading costs or in periods I have not yet seen.
If you cannot tell which numbers come from which calculations, you cannot determine whether they are genuine or fake. When you open the next product page, please first confirm which tab and which method produced the numbers before reading them.
Only when you can verify the origin of the numbers will you be one step closer to the Holy Grail.
The five types of breakdowns, including one that involves misalignment in the verification method and how to draw the line to stop or continue when you start losing, are covered in a paid article (980 yen).
Paid article: “If the EA starts losing, stop or continue. Why a few months’ performance is hard to judge, five patterns of breakdown, and how to draw the stop line”:https://www.gogojungle.co.jp/finance/navi/articles/128308
Glossary
- EA: A program that automatically trades FX
- MT5: FX trading software
- Tester: A feature in MT5 to test trading with historical price movements
- Take profit: Automatically close the trade when the price reaches the set line
- Stop loss: Automatically close the trade when the price reaches the set line
- 10,000 units: the trade size. For USD/JPY, 10,000 dollars’ worth
- Swap: The interest rate difference between two currencies that accrues when holding a position overnight
- Trading costs: money charged for each trade. The spread and fees
- Forward: performance measured after listing. A period that cannot be created using past data
- Maximum drawdown: the largest peak-to-trough decline in assets
- Profit and loss: net of gains and losses
- PF: total profit divided by total loss. 1.0 means break-even
- Quality (%): a percentage indicating how closely the price data used in past-data verification matched, expressed as a percentage
Note: This article is not investment advice. All numbers are calculation examples for explanation purposes.