
The Bottom of Defeat is Fragmented Across 6 Currencies — The Truth Behind EA’s Max Drawdown Reduced by 70%
Key Points of This Article
- The maximum drawdown (the largest drop from the account's peak) of an EA is read by aligning not only the depth (%) but also the length of the validation period and the number of days from the high to the low to the recovery. The longer the validation period, the more likely the maximum drawdown will appear large (Magdon-Ismail et al.).
- When measuring by currency pair with free CSV, the sum of the maximum drawdowns for 6 currencies is 4,324.9 pips, but the maximum drawdown for the combined six currencies is 1,291.6 pips (about 30% of that; about 70% smaller than the sum = 1 − 1,291.6 ÷ 4,324.9 ≈ 70%). The timing of the bottoms for each currency’s maximum drawdown ranged from October 2008 (USDCAD) to September 2015 (GBPUSD). The number of days to recover to the high was 3,227 days (about 8.8 years) for USDCHF alone, and 502 days for the total of six currencies (ゴゴジャン 86515).
- I included a table that converts the maximum drawdown into yen for your own lot size, and a checklist for reading the numbers on the sales page. For currency pairs in USD terms, the yen amount changes with the USD/JPY level (Bank of Japan).
The currency-pair table can be recalculated from the free CSV of all trades: LAST ORDER Free CSV of all trades 11,489 records (ゴゴジャン 86515)
Conclusion: Read Maximum Drawdown by Aligning Three Numbers
Maximum Drawdown (hereafter DD) is the maximum amount that the account balance dropped from its peak. On sales pages, it is often written as a single number like “Maximum DD 19.8%.” This single number alone cannot be used to compare different EAs on the same scale.
There are three numbers to read. The first is the depth and its method of measurement (%, or pips; compound interest or fixed lots). The second is the length of the validation period. The third is the date of the high, the low, and the recovery.
This article is written from the perspective of the creator of the EA “LAST ORDER.” Using our own sales page figures and the free CSV, we recalculated these three factors.
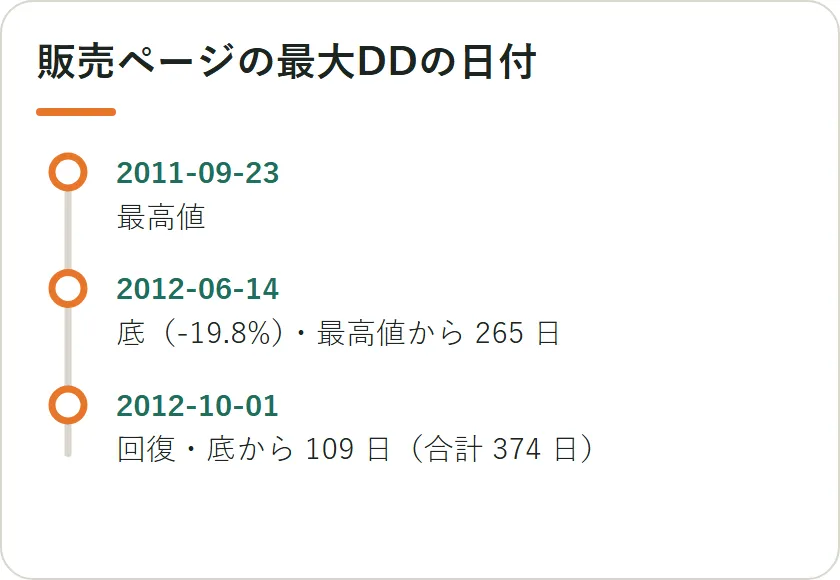
On the sales page, it states maximum DD 19.8%, the peak on 2011-09-23, the bottom on 2012-06-14, the recovery on 2012-10-01, totaling 374 days (ゴゴジャン 83528). Subtracting dates shows 265 days to fall, and 109 days to recover. The conditions are theoretical values with compound interest and no lot cap, covering tests from May 2003 to December 2025.
Applying 19.8% to a capital of 1,000,000 yen yields a drop of 198,000 yen. This is a calculation applying the theory from the sales page as-is and does not guarantee actual account figures.
The Longer the Validation Period, the Larger the Maximum Drawdown
In Magdon-Ismail et al. (2004), the drawdown was analyzed by modeling price movement as Brownian motion (a model of continuous small fluctuations). The growth of the expected maximum drawdown when the period grows depends on the sign of the expectation: it grows logistically if positive, by the square root if zero, and proportionally to the period if negative.
DD for 3-year validation and 23-year validation cannot be compared by numbers alone. If the expected value is zero, the square-root growth approximate yields that if the period is 23 ÷ 3 ≈ 7.67 times longer, the expected maximum DD would be about √7.67 ≈ 2.77 times larger. A shorter validation period may yield smaller DD simply due to the shorter duration.
Recovery Days Should Be Read Alongside the Drop Days
Bailey and López de Prado (2015) showed, under standard portfolio theory assumptions, that on average, it takes about three times the duration to recover to a certain level after reaching a maximum loss with a given confidence level. The authors call this the triple penance rule.
In the same study, ignoring the serial correlation in results can lead to underestimating downside risk by up to 70% for hedge-fund strategies. On the sales page, check whether recovery days or dates of the high and low are provided. If dates are present, you can calculate the drop days and recovery days yourself.
How to Read the Studies
- Magdon-Ismail et al. (2004): A mathematical theory paper. It assumes Brownian motion for price movements, which differs from real EAs that show biases in win/loss sizes.
- Bailey & López de Prado (2015): A theoretical paper starting from standard portfolio theory assumptions (independence of returns) and extending to cases with first-order autocorrelation. The “three times” figure refers to an average; actual outcomes vary.
Maximum Drawdown Measured by Free CSV for Each Currency Pair
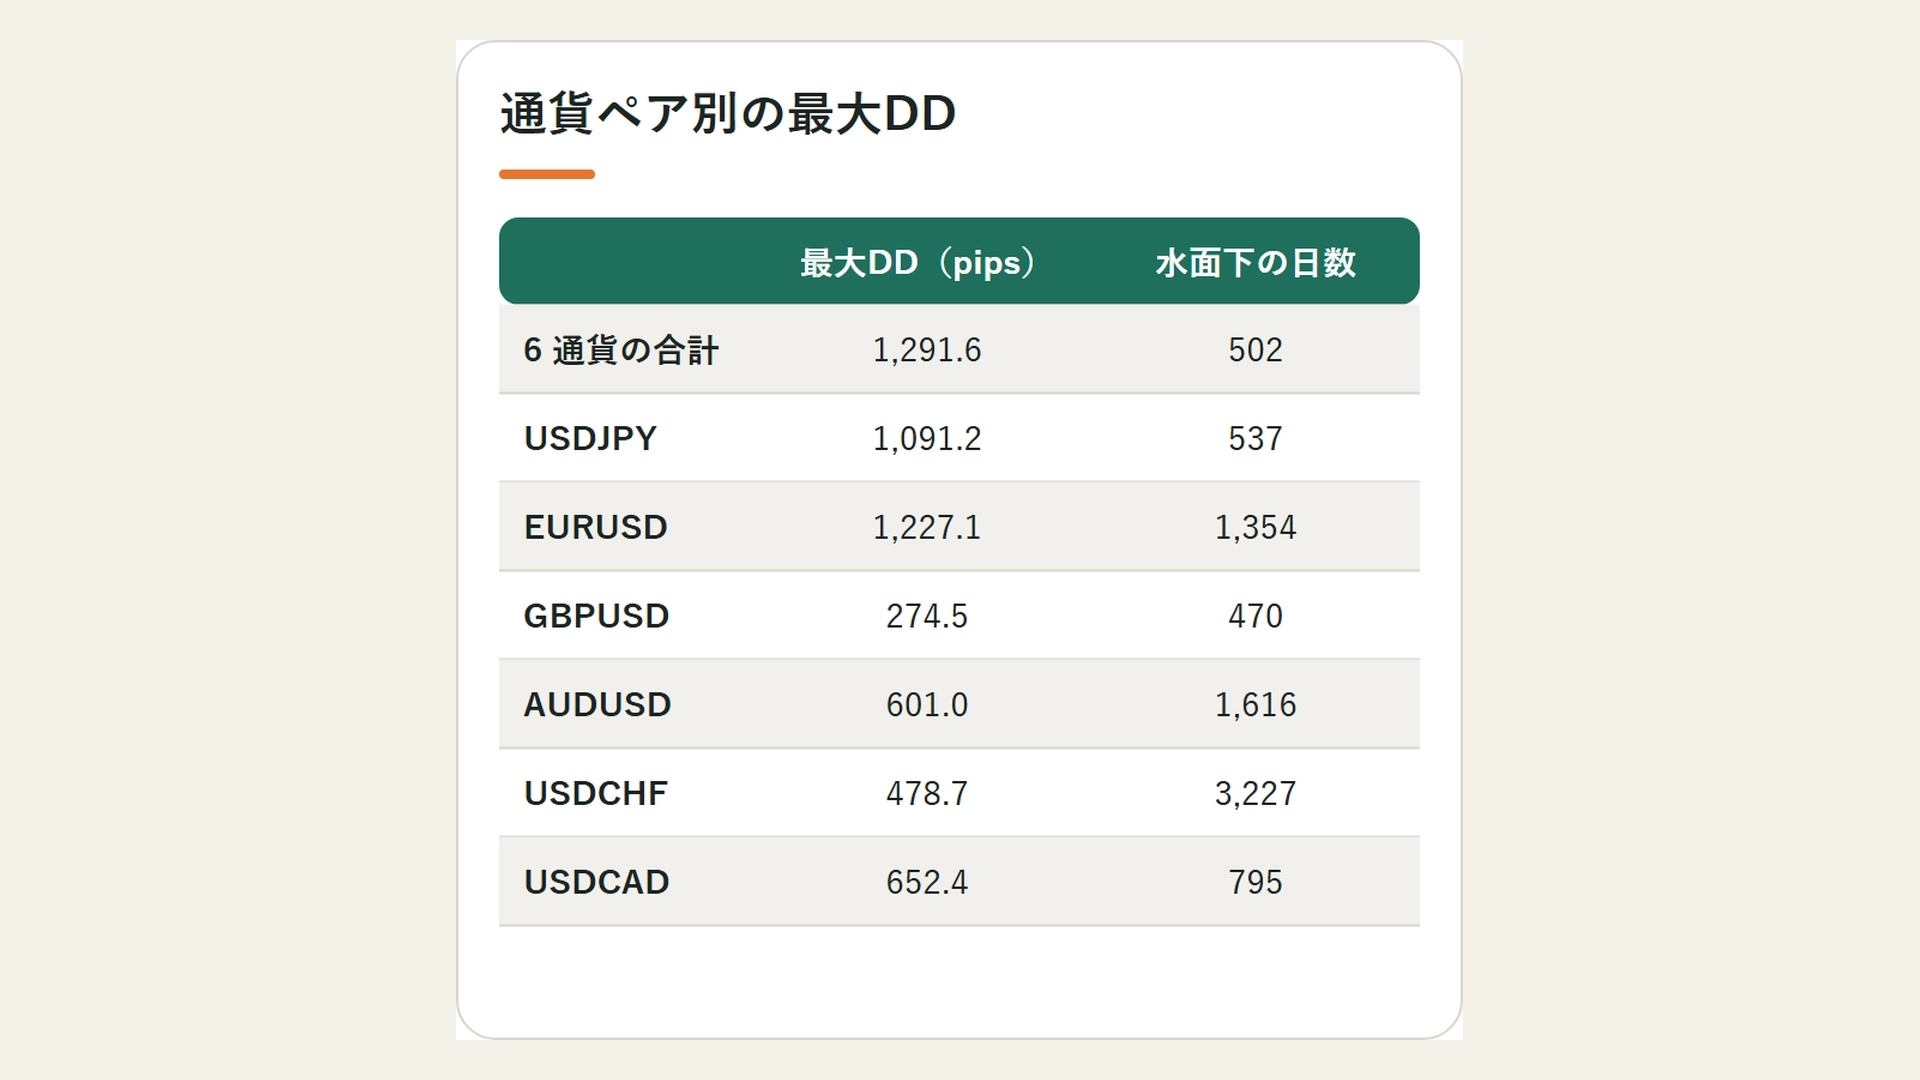
Using the free CSV of all 11,489 LAST ORDER trades (ゴゴジャン 86515), the maximum DD was calculated per currency pair. The method is to sum gains/losses in pips for each settlement date, then take the maximum drop from the daily peak. The CSV has no timestamps, so the same day’s order sequence is not counted; measurements use the end-of-day values.
| Currency Pair | Trades | Total Pips | Maximum DD (pips) | Peak Day → Bottom Day → Recovery Day | Under-the-surface Days |
|---|---|---|---|---|---|
| 6-Currency Total | 11,489 | +39,848.7 | 1,291.6 | 2011-09-23→2012-06-10→2013-02-06 | 502 |
| USDJPY | 3,758 | +20,220.7 | 1,091.2 | 2011-10-25→2012-10-30→2013-04-14 | 537 |
| EURUSD | 5,015 | +8,077.3 | 1,227.1 | 2007-10-22→2009-03-19→2011-07-07 | 1,354 |
| GBPUSD | 459 | +2,953.8 | 274.5 | 2014-12-31→2015-09-30→2016-04-14 | 470 |
| AUDUSD | 1,023 | +3,507.4 | 601.0 | 2009-03-27→2012-04-27→2013-08-29 | 1,616 |
| USDCHF | 498 | +1,855.1 | 478.7 | 2008-09-29→2012-06-28→2017-07-31 | 3,227 |
| USDCAD | 736 | +3,234.4 | 652.4 | 2006-11-20→2008-10-20→2009-01-23 | 795 |
The under-the-surface days are the number of days from the high to the day when the cumulative value returned to the high. Adding the six currencies’ maximum drawdowns gives 4,324.9 pips, but the total maximum drawdown was 1,291.6 pips (about 30% of 4,324.9) because the timing of declines differed by currency.
Looking at USDCHF alone, it took 3,227 days (about 8.8 years) to return to the high. For the six currencies combined, it was 502 days. The date of the overall peak was 2011-09-23, the same as the yen-denominated peak on the sales page.
The recovery in yen terms is 374 days, while the total pips were 502 days; this difference is due to the different measuring scales. The total pips do not reflect the yen value per pip for each currency pair or the EA's lot distribution (ゴゴジャン 86515).
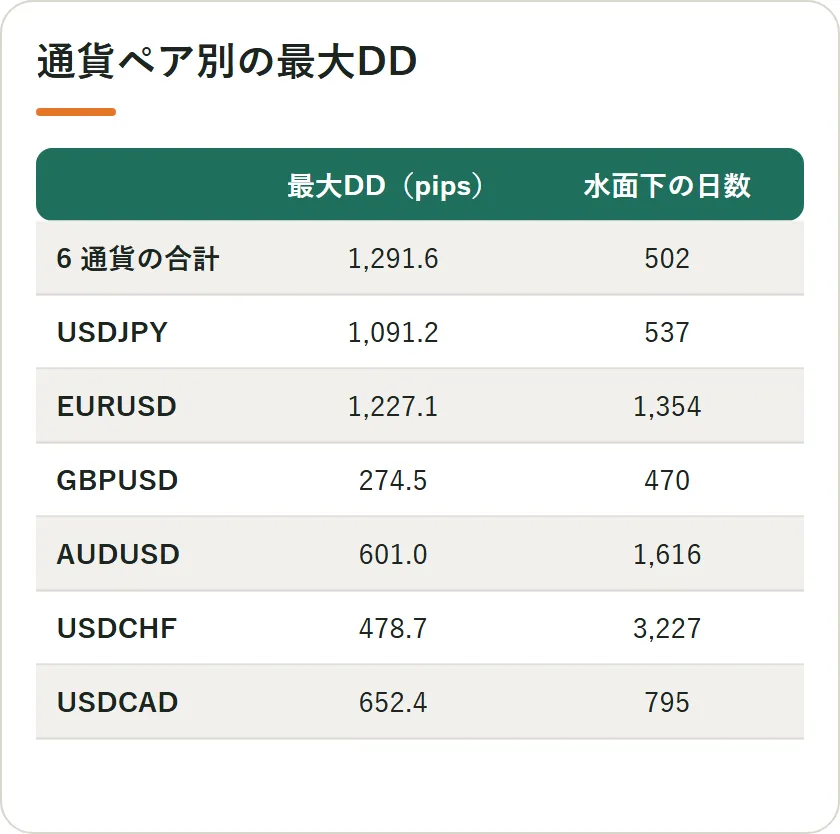
Table to Convert Maximum Drawdown to Your Account in Yen
How to use: input your own lot size and multiply “Maximum DD (pips) × 1 pip in yen × lots” to calculate. Here we assume an account with 1 lot = 100,000 units. Confirm the number of base currency units per 1 lot on your broker’s trading terms page.
1 pip in yen is determined by the right-hand currency of the pair. USDJPY is 1000 yen for 10万 units × 0.01円. EURUSD, GBPUSD, and AUDUSD are 10 dollars for 10万 units × 0.0001 dollars; multiplying by the Bank of Japan’s September 2026 mid-month average of 156.23 yen yields 1,562.3 yen.
| Currency Pair | Maximum DD (pips) | 0.1 Lot 1 pip | Yen for 0.1 Lot Fixed | With Your Lot Size |
|---|---|---|---|---|
| USDJPY | 1,091.2 | 100 yen | 109,120 yen | 1,091.2 × 1,000 yen × Lot |
| EURUSD | 1,227.1 | 156.23 yen | 191,710 yen | 1,227.1 × 1,562.3 yen × Lot |
| AUDUSD | 601.0 | 156.23 yen | 93,894 yen | 601.0 × 1,562.3 yen × Lot |
| GBPUSD | 274.5 | 156.23 yen | 42,885 yen | 274.5 × 1,562.3 yen × Lot |
This is a calculation example. EURUSD: 1,227.1 × 156.23 = 191,709.8 yen, about 192,000 yen. For an account with 1,000,000 yen, this corresponds to about a 19.2% drop (191,710 ÷ 1,000,000).
For yen-denominated currency pairs, the same pips correspond to different yen amounts depending on the USD/JPY level. The BoJ mid-month average was 76.78 yen in September 2011 and 156.23 yen in September 2026, about 2.03 times higher. Do not apply the old yen drawdown to your current account unchanged.
This table calculates 0.1-lot-fixed trades using the same CSV data. Since LAST ORDER adjusts lots according to funds, these yen-denominated numbers on the sales page do not match precisely.
Checklist for Reading the Sales Page’s Maximum Drawdown
How to use: Open the EA’s sales page you're interested in and mark six fields with a circle or cross. The more Xs, the less reliable the DD figure is for comparison.
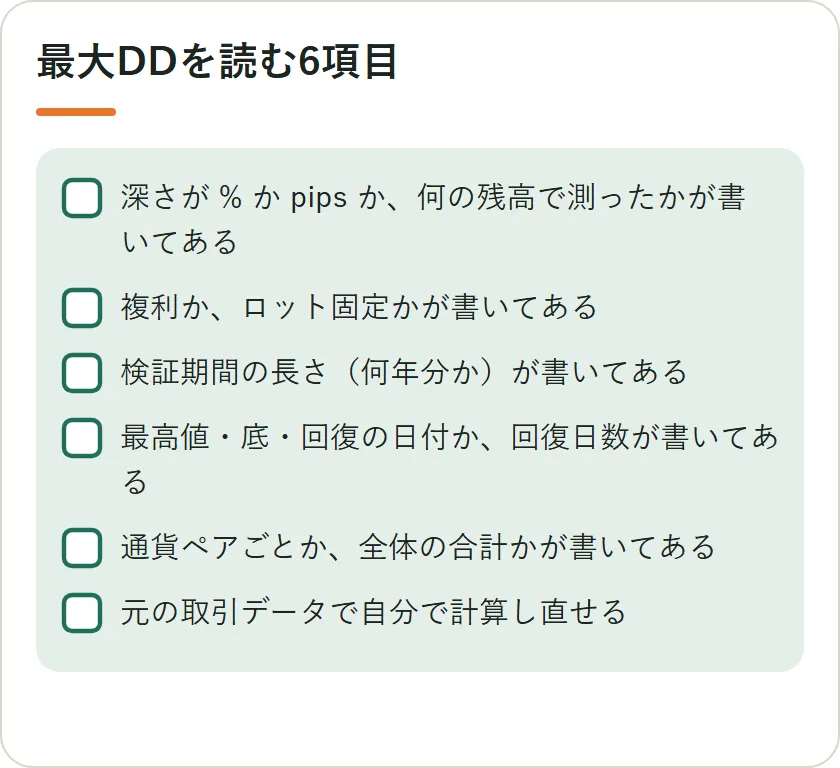
| Field to Check | 〇 / × | LAST ORDER’s Sales Page |
|---|---|---|
| Depth and Method | 19.8%・Balance-based | |
| Compound interest or fixed lots | Compound interest・No lot cap theoretical value | |
| Validation period | May 2003–December 2025 | |
| Dates or recovery days | Three dates and 374 days | |
| Per currency or total | 16 logics・6 currencies in one | |
| Can you recompute yourself? | Free CSV (86515) can compute pips |
Next Reads
- The above currency-pair table can be recomputed yourself from the free CSV of all trades:LAST ORDER Free CSV of all trades 11,489 entries (ゴゴジャン 86515)(The author’s own EA verification data)
- Procedures for aggregating CSV by year and by currency are summarized here:Before buying the EA: Verify with the “All Trades CSV” — steps to aggregate by year and currency in 5 minutes
- Next title in the series “Verifying the EA’s Numbers Yourself”: Backtesting vs Forward testing and what to read to assess performance
References
- Magdon-Ismail, M., Atiya, A. F., Pratap, A., & Abu-Mostafa, Y. S. (2004) “On the maximum drawdown of a Brownian motion” Journal of Applied Probability, 41(1), 147–161. DOI: 10.1239/jap/1077134674
- Bailey, D. H., & López de Prado, M. (2015) “Stop-outs under serial correlation and the triple penance rule” The Journal of Risk, 18(2), 61–93. DOI: 10.21314/JOR.2015.317 (Abstract in SSRN DOI: 10.2139/ssrn.2201302)
- Bank of Japan “Main Time-Series Statistical Data Table: Exchange Rates (Tokyo Interbank Market) (Monthly)” Tokyo Market USD/JPY spot 17:00 mid-month average (2011-09: 76.78 yen; 2026-09: 156.23 yen)
- ゴゴジャン “LAST ORDER” product page (Maximum drawdown 19.8%; 2011-09-23 peak; 2012-06-14 bottom; 2012-10-01 recovery; 374 days)
- ゴゴジャン “LAST ORDER Verification Data | 2003–2025 All Trades CSV (no timestamps, free)” All-trades CSV 11,489 records; SHA-256 171145c5a37731c6fcdce734179335843c93fbf816116022a2eb4564ae0e5a85. (Maximum DD by currency pair is calculated from the highest drop from daily closing cumulative pips)