

【BTC Example】Identify the wave that extended from the resistance breakout and the moment when the buying rationale collapsed
"I broke through the high price. I want to buy, but it might come back again."
Even when the breakout is anticipated, if the price suddenly rises, I hesitate whether to chase it. In such scenes, I consider a setup by combining the predetermined breakout of resistance with the BB expansion on the target time-frame pair.
On October 2, 2026, for BTC/USD there was a moment when the expansion of H1 and M15 aligned. After the breakout, prices reached higher highs and later fell below the previous resistance within the same day. Let’s trace from the reasons to buy to reviewing whether to hold. The times are in UTC; 05:00 is 14:00 in Japan standard time.
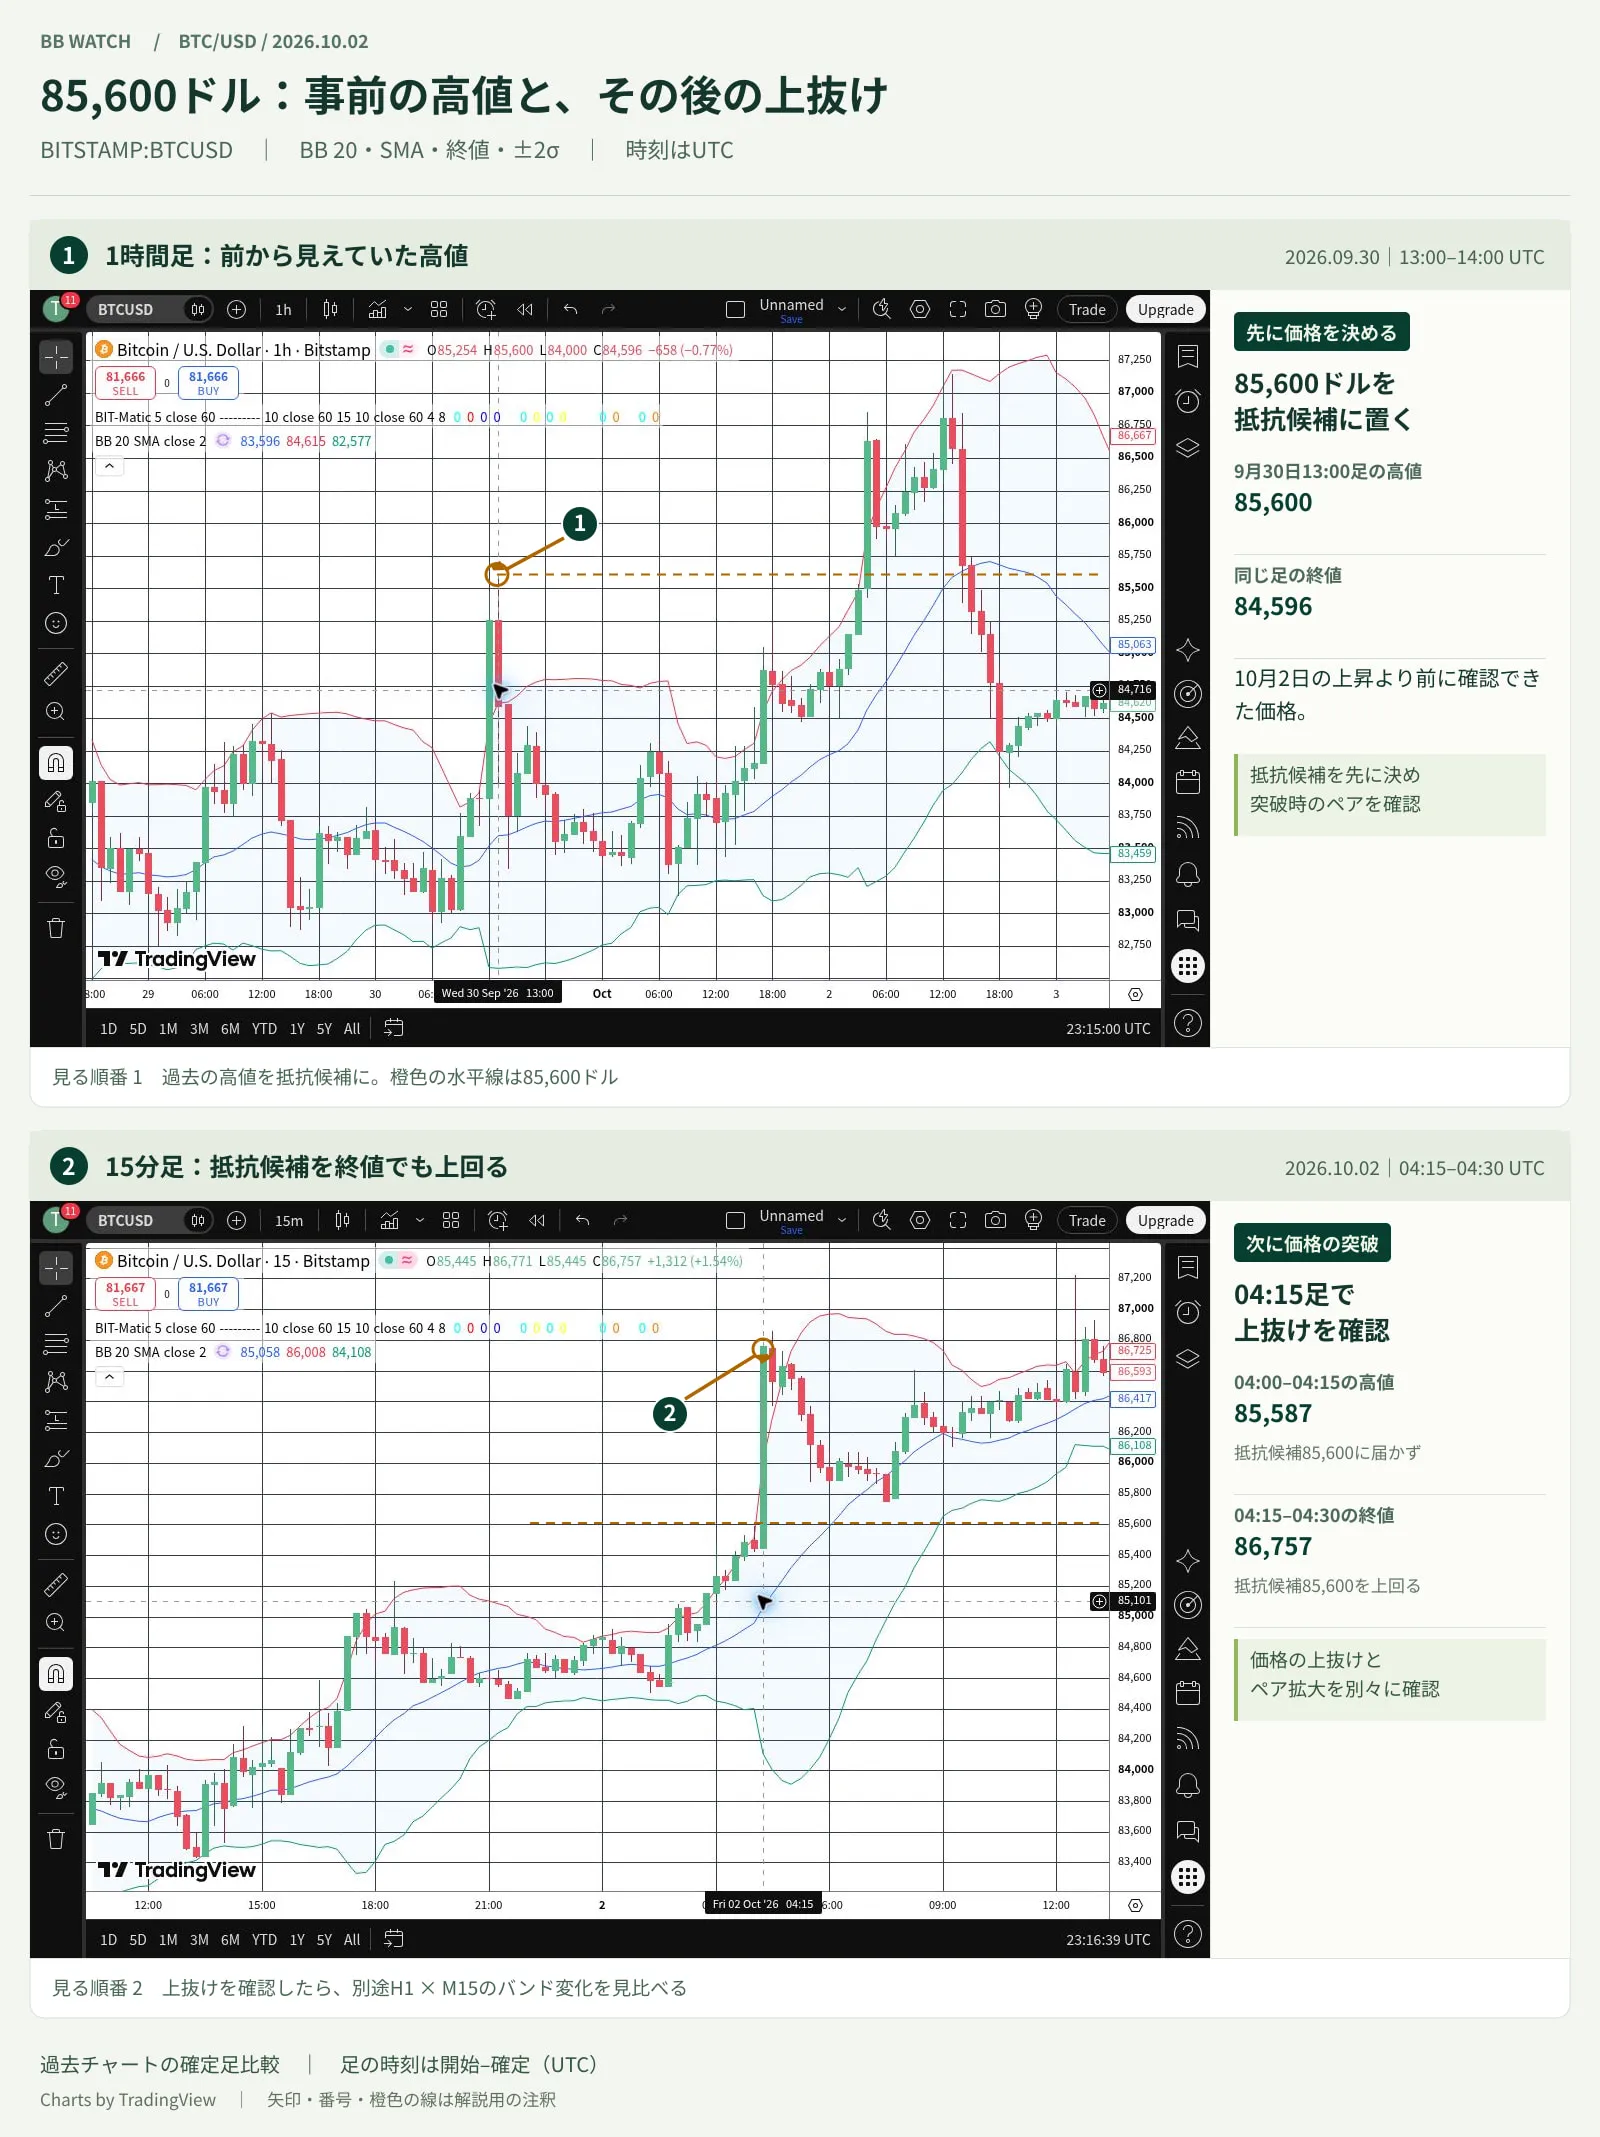
High of 85,600 dollars on September 30 as a resistance candidate. The M15 from 04:15 to 04:30 on October 2 closed above 86,757 dollars. Charts by TradingView
Wait for a moment when the high price of 85,600 dollars is broken
The current resistance candidate is the high of 85,600 dollars marked on the H1 at 13:00 on September 30. We decide in advance to aim for a move that breaks above this high.
On October 2, the M15 04:00 bar high was 85,587 dollars and did not reach the resistance. The next 04:15 bar surpassed 85,600 dollars and closed at 86,757 dollars. Here we check whether the upward move is accompanied by BB expansion on both H1 and M15.
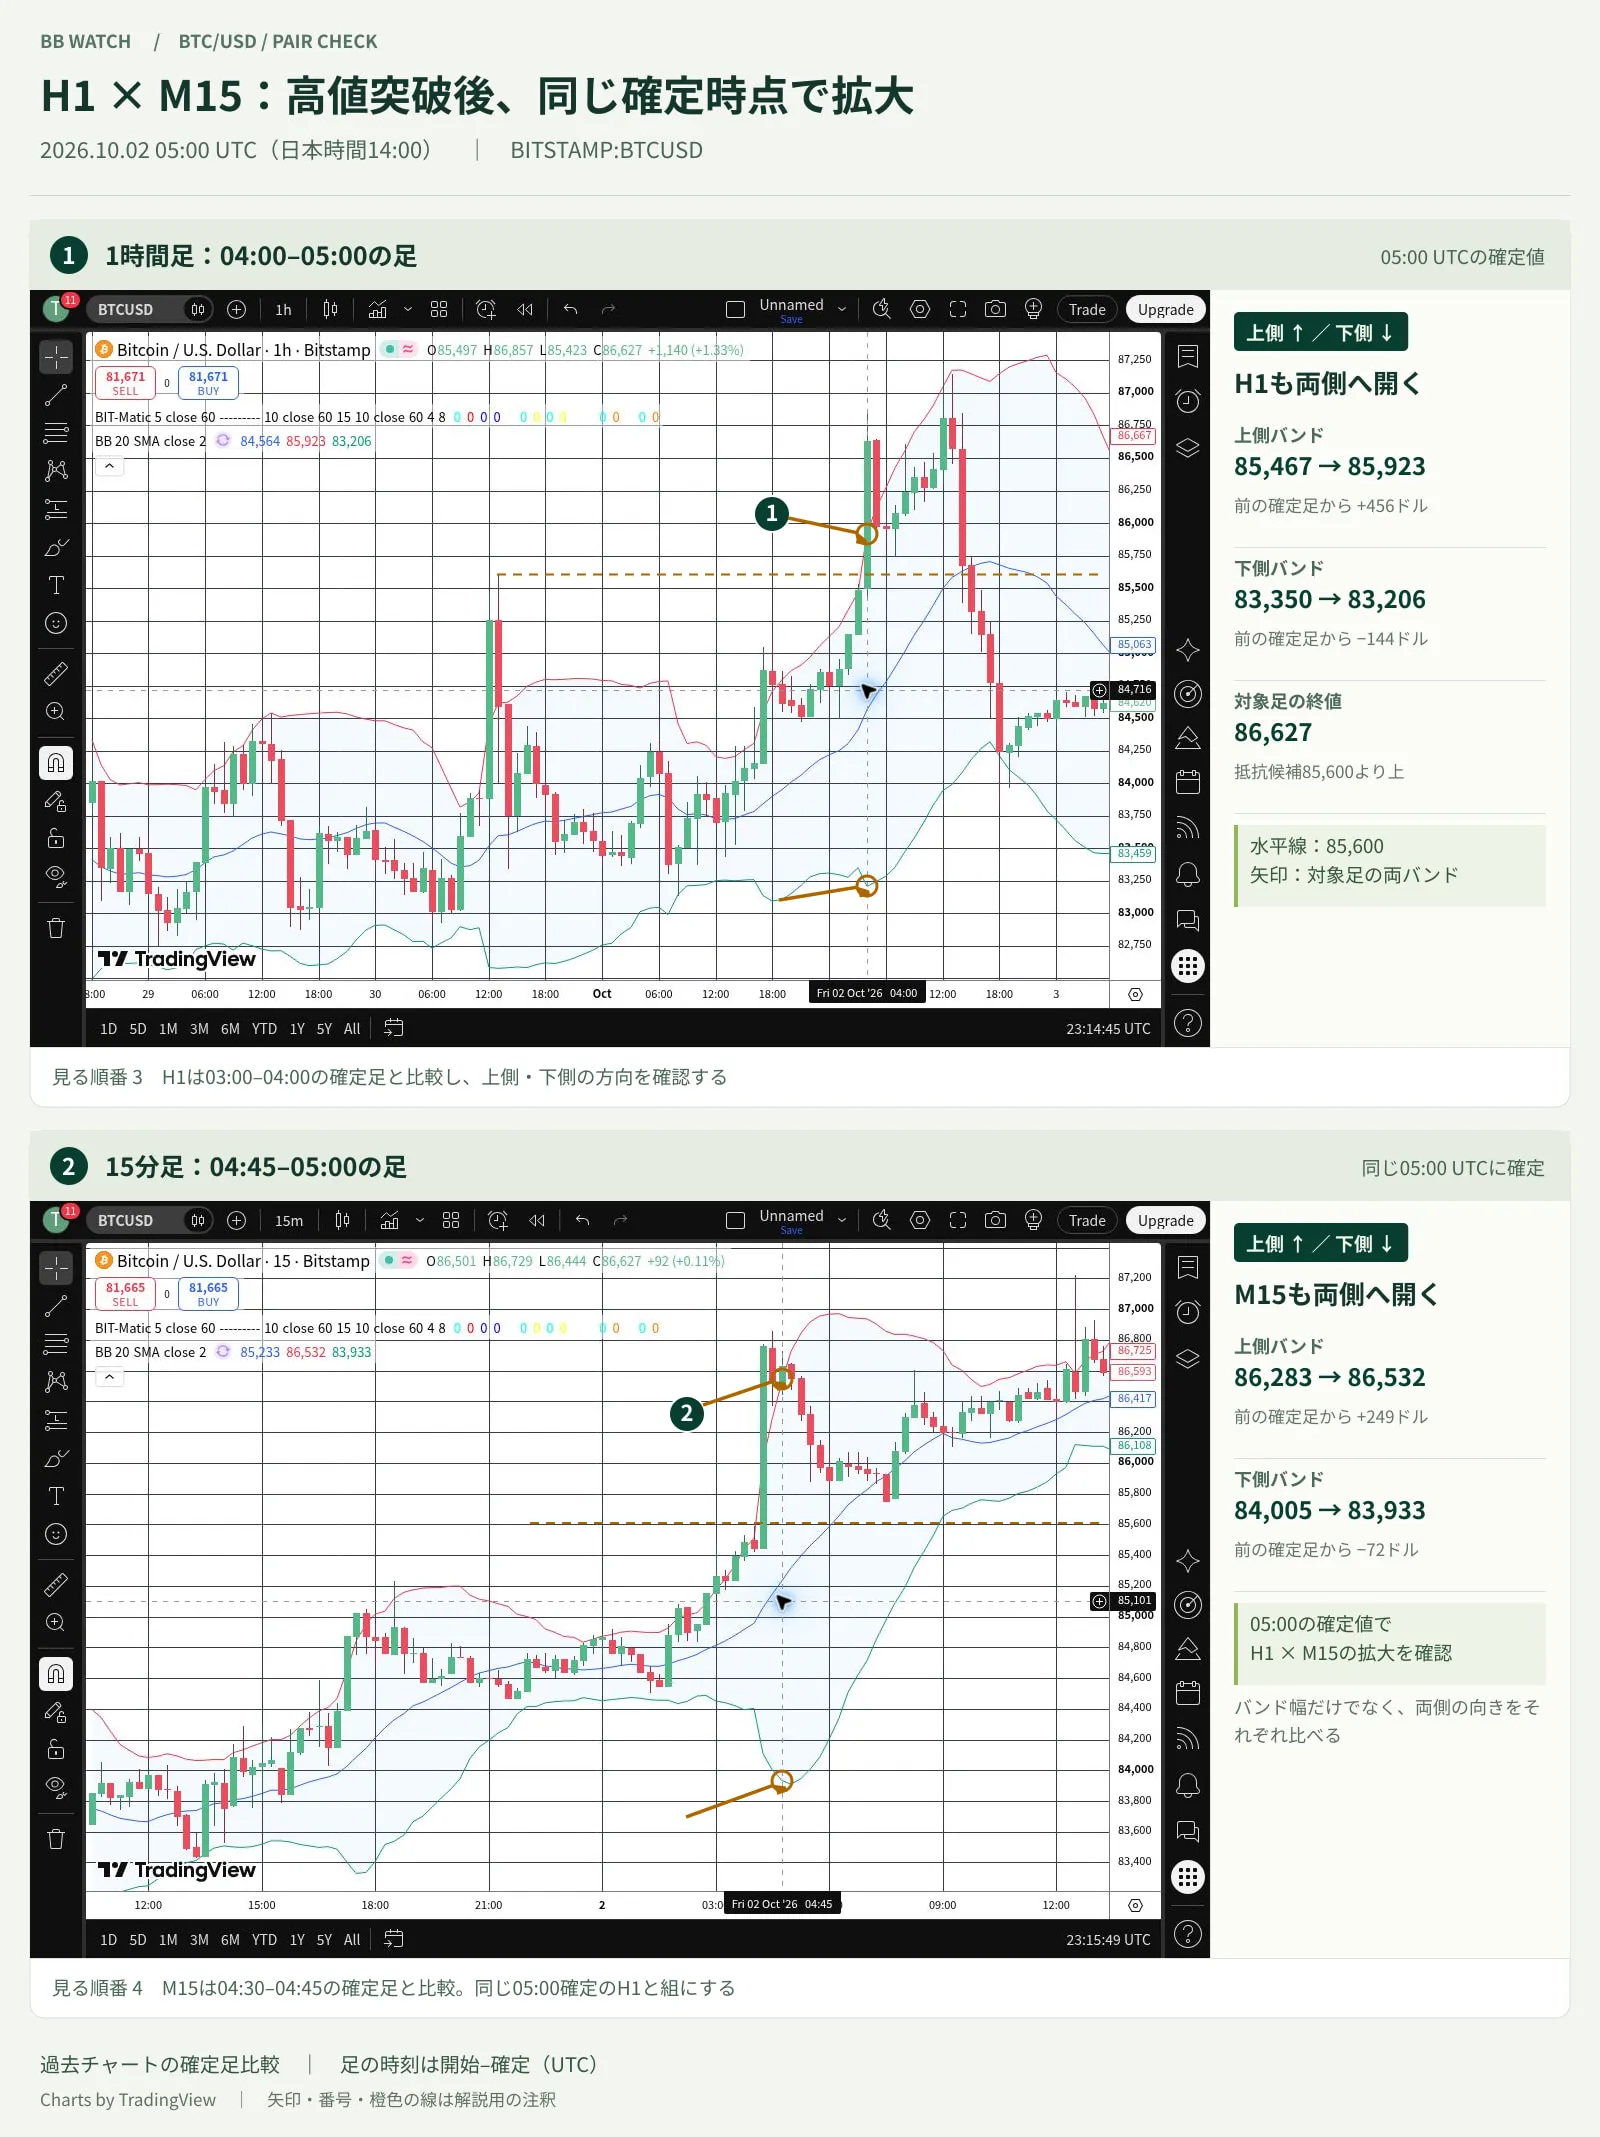
H1 and M15 confirmed at 05:00 on 2026-10-02. Both show the upper band rising and the lower band falling. Charts by TradingView
After both legs expanded, where to buy
Compared with the immediately preceding bar, both H1 and M15 had the upper band rising and the lower band falling at the 05:00 confirmation. The H1 close also surpassed the pre-set 85,600 dollars.
This is a pair-synchronization expansion state, where both legs show expansion. Combined with the breakout of the pre-existing high, this can be used as a reason to place trades in the upside direction.
The close at 05:00 was 86,627 dollars. If you enter here, determine how far your stop loss is and decide participation with a quantity that fits your risk tolerance.
If the distance is large, waiting for a pullback is an option. If it pulled back but stayed above 85,600 dollars and then moved higher again, confirm the pair’s expansion. This process helps you find a tradable entry.
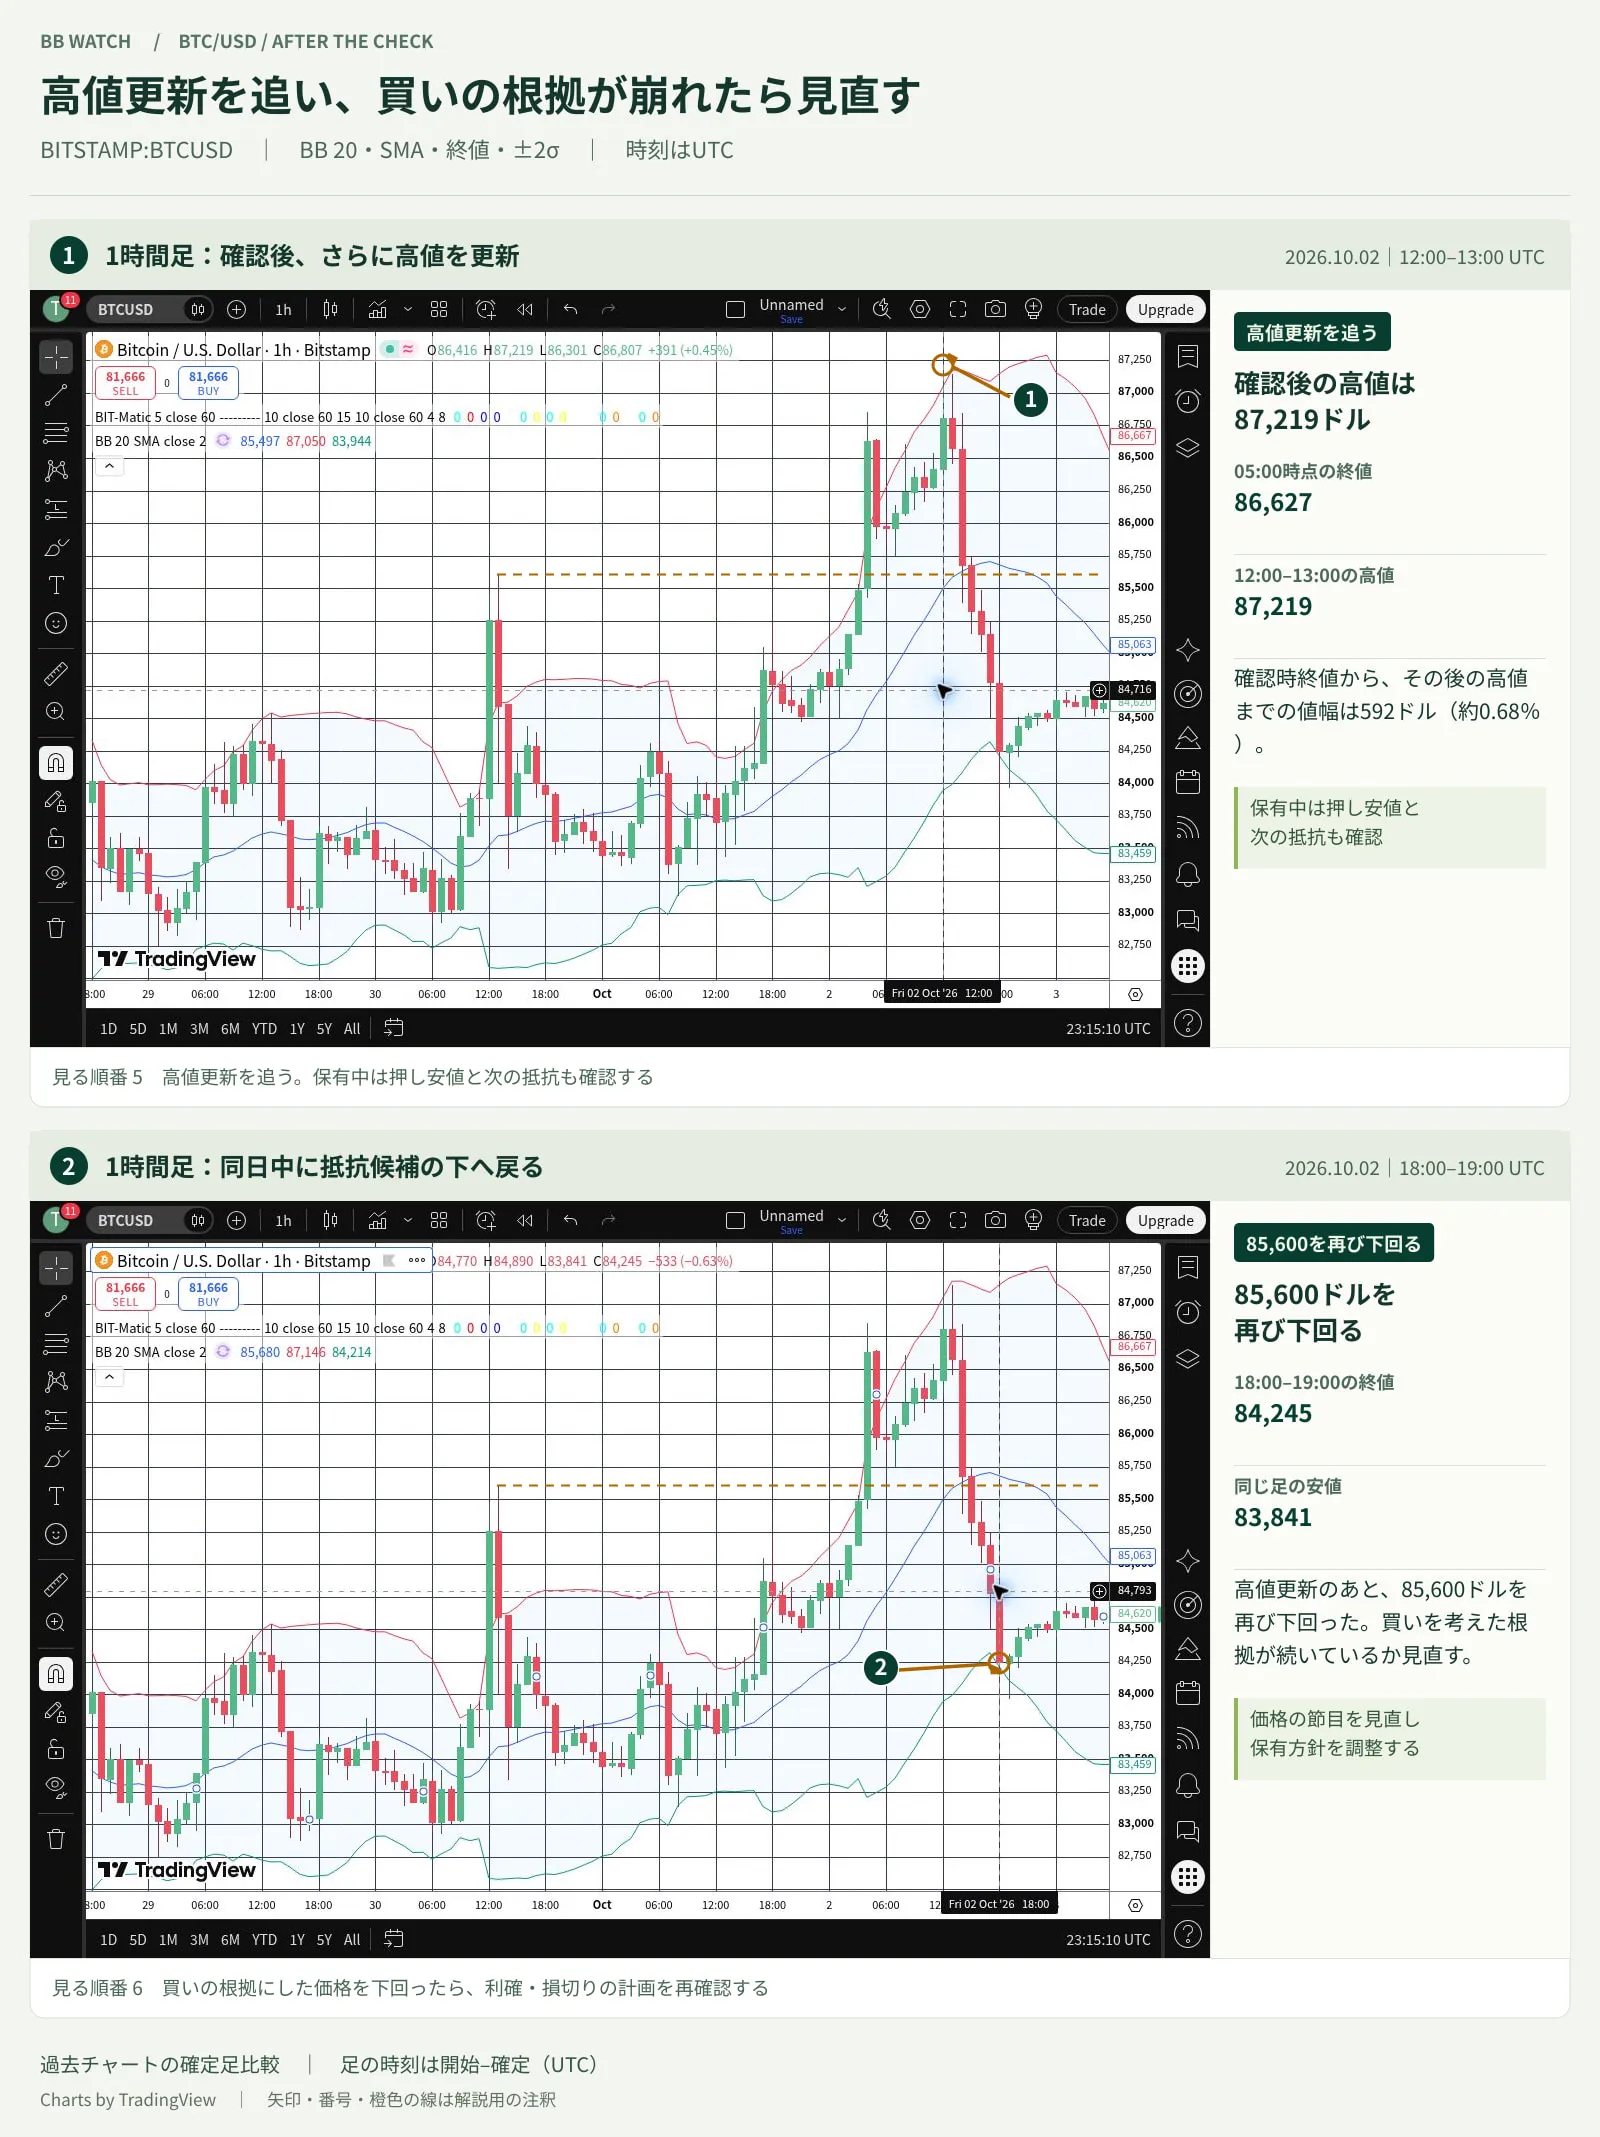
After confirmation, the price rose to 87,219 dollars. Then, between 18:00 and 19:00, the H1 again fell below 85,600 dollars to close. Charts by TradingView
After the extension, also prepare an exit plan to protect profits
Later, the H1 reached 87,219 dollars by 12:00, which is 592 dollars above the 05:00 close.
If you bought and held, decide where to protect profits during the price rise. For example, you could follow management steps like the ones below.
1. If you’re in profit, check the most recent M15 pullback low and whether the pair’s expansion continues.
2. If the high stops rising and you break the short-time support, consider partial take-profit or raising stops. Decide these criteria before entering.
3. If price falls below 85,600 dollars, reassess the rationale for maintaining the breakout.
85,600 dollars is a level to re-verify the breakout rationale. You do not need to wait for profit protection exactly at that price. Set separate risk-management levels aligned with your trading rules, such as the pullback low after entry.
That day's 18:00 H1 closed at 84,245 dollars. It broke below the prior high and could not hold the breakout price. Even if the pair had expanded initially, you should continue to confirm whether the price still meets the long-side conditions while holding.
To compare pairs on the same screen
BB Watch is a tool that displays the BB width and changes for the chosen timeframes in MT5 side by side on a Windows screen. If you place the target pairs on the same screen, you can reduce the effort of remembering the prior state as you switch bars.
When approaching resistance, compare whether only one short-term bar moves or whether the other leg is expanding as well. If the pair has not yet followed, do not jump on breakout alone; re-check your setup criteria. This helps you avoid false signals. After entering, monitor the pair’s changes and price progression to inform holding and profit-protection decisions.
The current H1 and M15 are a single combination. Do not fix the pairs; choose them to fit your method and the wave you are aiming for. First decide the target location and direction, and place the pairs you will use on BB Watch for that scene. When the expected price movement occurs, you can verify the changes in both legs on the spot.
Other scenes where the breakout was reversed can be compared withthe July 15 example where BTC’s prior-day high breakout failed.
This time’s confirmation values
The subject is BITSTAMP:BTCUSD. BB uses a period of 20 with SMA, close price, and ±2σ bands.
H1 comparison from 03:00–04:00 to 04:00–05:00. Upper band: 85,467 → 85,923 dollars; Lower band: 83,350 → 83,206 dollars.
M15 comparison from 04:30–04:45 to 04:45–05:00. Upper band: 86,283 → 86,532 dollars; Lower band: 84,005 → 83,933 dollars.
Both comparisons are confirmed at 05:00. The times like "04:15 bar" in the main text refer to the start times of the bars.
Sources and confirmation range
Charts by TradingView
View chart sources (TradingView)
This is a review of confirmed bars using TradingView's history view. The initial real-time times and the BB Watch display at that time are not confirmed. The trading and profit-protection steps are examples of decision procedures and do not indicate actual fills or performance. Prices are shown as whole dollars on screen, and prices and BB values may differ depending on MT5 data sources. Since losses can occur, please judge according to your own trading rules.