

Aim to break through the previous day's high for BTC, and step back if it fails. Example of BB utilization on July 15
This article aims to catch a wave that breaks the high on a 4-hour chart, using an example that looks at the 1-hour and 15-minute charts in a paired manner. The combination of timeframes is just one example; you should choose according to your own method and the wave you are targeting. As the price moves in the intended direction and expansion occurs in the chosen pair, use that movement as the basis for entry.
First, decide on the situations to set up trades, such as range breaks or corrective waves after a trend has broken. If you are aiming to break above a high, the price that breaks through can be used for continued holding. As long as it is supported from above, aim for expansion; if it returns downward and cannot recover, step back. Build the entry and exit from the same price point.
There are moments on BTC/USD on July 15, 2026, where this procedure is easy to consider. While the daily BB width widened, the 4-hour chart broke its prior day high. On the next candle, the price fell back below the level it had broken.
Which 4-hour wave to target, what to base the entry on, and how long to hold—consider a procedure that looks at the price action on the daily and 4-hour charts and uses the 1-hour and 15-minute charts. The following trades are a hypothetical construction, with UTC dates/times and prices in USD.
To target a pullback on the daily chart, press two highs
At that time, the daily chart had pulled back from the May high region toward late June. On July 14, it closed around $65,000, and the BB width expanded about 6.7% from the previous day. On the 15th, basing on this daily chart, you can look for a buying opportunity in shorter timeframes.
There are two prices to press in advance.
・High to clear for now: $65,056.3
・Back to the 6/15 retracement high that could act as the next resistance: $67,263.5
Consider buying from the point where the previous day’s high is exceeded, and assess how much price action remains beyond that. Dividing the price this way clarifies which portion of the daily pullback you are aiming for.
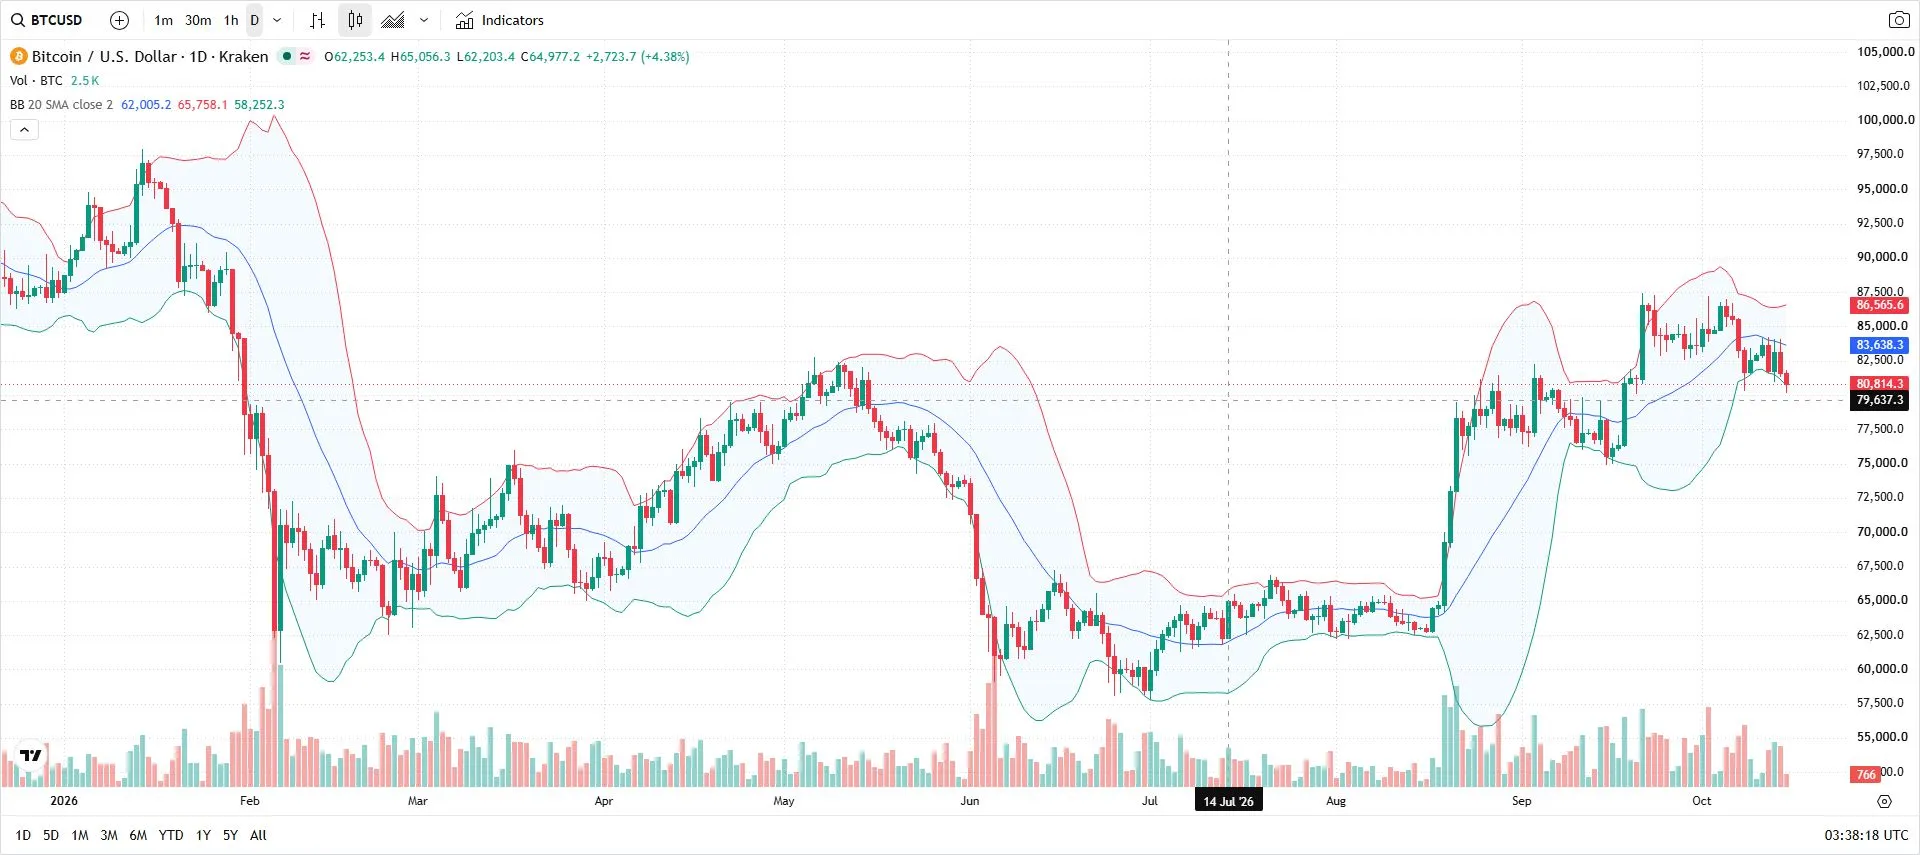
Daily chart context. The vertical line marks July 14, 2026. Treat the prior day’s high of $65,056.3 as the immediate breakout level, and the level above it at $67,263.5 as the next resistance candidate.
KRAKEN:BTCUSD/Charts by TradingView(https://www.tradingview.com/)。Dates and times are UTC.
From the breakout of the previous day high, aim for a 4-hour wave
The 4-hour period from 12:00 to 16:00 on the 15th broke above the previous day’s high and closed at $65,369.4. The high was around $65,500, and it surpassed the $65,056.3 level observed on the daily chart.
What we aim for here is a 4-hour wave that moves up through the daily pullback while exceeding the previous day’s high. Use the next retracement high as a target for the upside, and monitor whether the price can stay above the broken level. The BB width for this candle was $4,070.0.
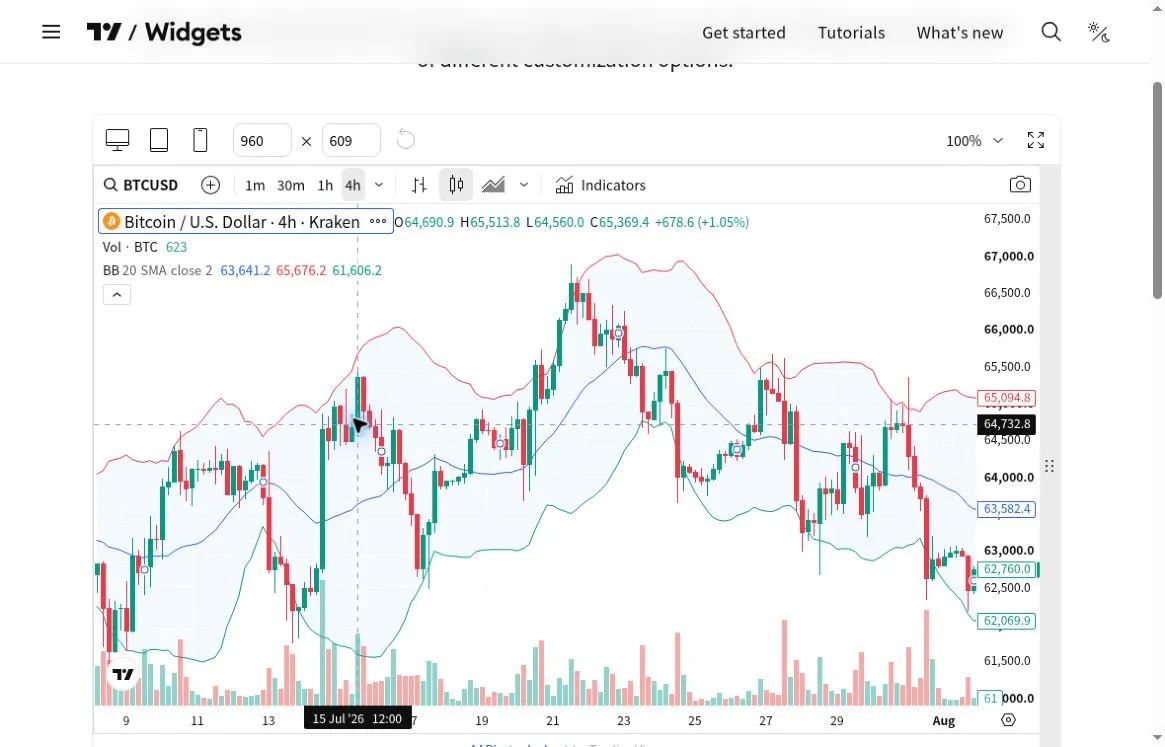
The 4-hour chart at 12:00 on July 15, 2026 (ending at 16:00). The close of $65,369.4 is above the prior day high of $65,056.3. Follow whether the price can maintain above the broken level.
KRAKEN:BTCUSD/Charts by TradingView(https://www.tradingview.com/)。Dates and times are UTC.
From here, follow the same type of scenario to verify the entry basis. Place BB Watch with 1-hour and 15-minute charts side by side, and watch for the price to move above the previous day’s high. The expansion in both legs of the pair is used as the basis for the entry into the 4-hour rising wave.
Even if you break through the previous day’s high, if only the 15-minute chart expands and the 1-hour chart does not, be cautious of a break-and-false move that returns. Do not chase the buy; wait to see if the price can sustain the level that has broken. Then confirm pair synchronization when both legs expand, and consider entering.
This approach — selectively confirming the breakout before entering — is a way to support avoiding false breaks. The observed daily and 4-hour chart measurements explained here will be used in the subsequent review of holding conditions.
Before entering, decide on a stop loss if the breakout level is breached. If you believe the price can hold and buy, but it returns downward and cannot move higher, that movement becomes the condition to exit. Determine the position size according to the stop range, and also verify that the potential price move to the next resistance aligns with the position size.
If you have not yet bought, you can wait for a pullback after the breakout and look for a supportable shape to re-enter. If you already own, decide whether to continue holding using the same level. Even after entering, set up a framework where the prices you watch are defined.
If the next candle breaks the previous day’s high, return to the established conditions
The following 16:00–20:00 4-hour period closed at $64,926.0, meaning it retreated below the previous day’s high.
Meanwhile, the BB width widened to about $4,214.8, an increase of approximately 3.6%. The upper band moved higher, while the lower band moved downward.
Although the BB upper and lower bands widened, the price returned below the previous day’s high. The premise of a breakout buy remained broken. What to do here is to return to the previously decided price level and reassess the holding.
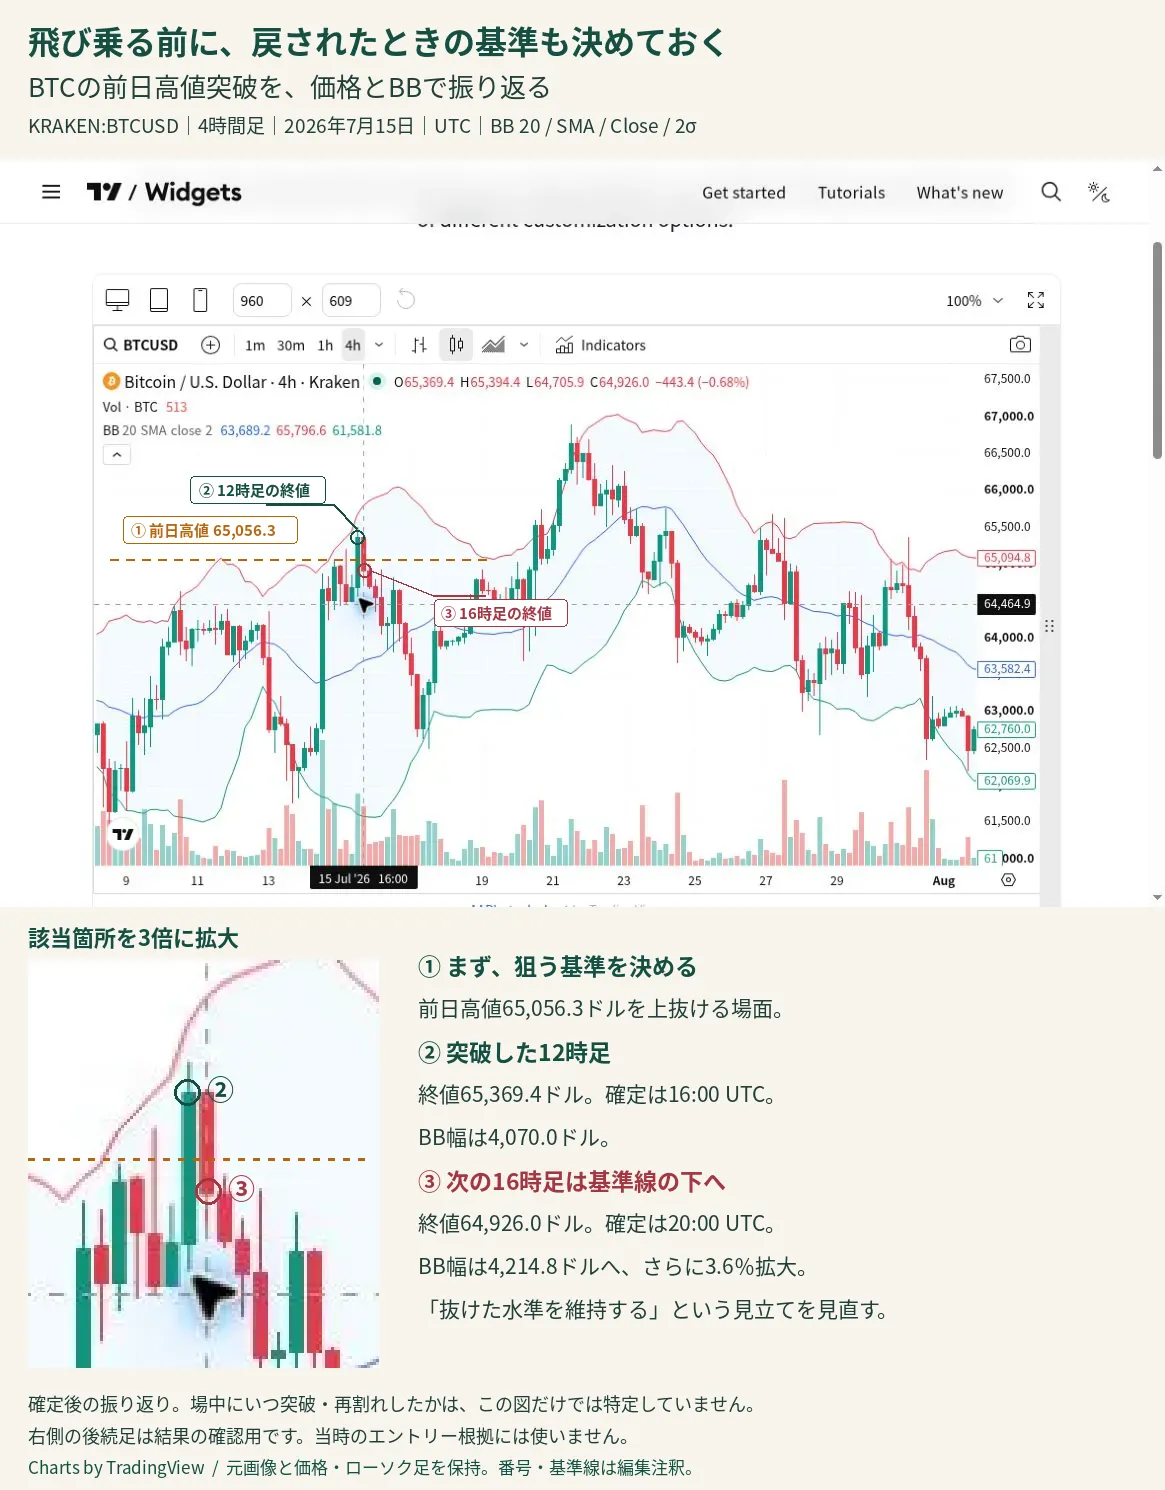
Figure ① shows the orange baseline at the prior day high of $65,056.3. The 12:00 candle ② broke above at $65,369.4, and the 16:00 candle ③ returned below the baseline at $64,926.0. Even with a widened BB, this is a scene where you monitor whether the price still supports the bullish premise. The 12:00 candle is confirmed at 16:00 UTC, and the 16:00 candle at 20:00 UTC. The numbers and the orange line/arrows are annotations for explanation.
KRAKEN:BTCUSD/Charts by TradingView(https://www.tradingview.com/)。Dates and times are UTC.
If your rule is to exit when the close breaks the previous day’s high, this condition is met at this point. If you wait for a pullback to re-enter, monitor whether you can recover $65,056.3; if not, exit. Also decide a loss limit for the wait beforehand.
If you were about to enter now, hold off on buying for the moment and wait for a shape that is supported by a new breakout above the previous day’s high. If you determine that the 4-hour rising wave can be targeted again from there, re-check the 1-hour and 15-minute expansion. When you re-enter, build the case from both the location and the pair.
Understanding why BB widens makes it easier to use with price
BB width reflects the dispersion of prices over the most recent 20 bars. Even if a candle moves lower, if the dispersion including past prices widens, the width increases.
Therefore, in entries, confirm both the direction you are targeting and the pair’s expansion together. After buying, continue to monitor whether you are protecting the level you aimed for. On July 15, the breakout from the previous day high moved to confirm whether that breakout could be maintained. If price loses the holding condition, even with a widened width, return to the predetermined exit condition.
It should be noted that the retracement did not reach the June retracement high of $67,263.5. The exit here is constructed not by assuming it hit June’s high, but by recognizing that the immediate breakout level was lost.
By deciding where to target, the next buying opportunity becomes easier to wait for
In this example, the aim was for a 4-hour rising wave after breaking the previous day high, and the entry basis was the expansion of the 1-hour and 15-minute charts. While supported from above, aim for continuation; if it returns downward, exit according to the predetermined conditions. Do not insist on a single entry; you can pursue the next opportunity using the same price.
Comparing selected pairs in real time with BB Watch helps verify whether the entry conditions align in the targeted moment. By using it in accordance with your method, you can clarify what to wait for before entering.
For those looking to find buying opportunities within daily pullbacks on shorter timeframes or wanting to use BB for holding management after entry, please see the product page for display and usage details.
BB Watch product page
Compare the target breakout across pairs. See BB Watch display and usage
Organize the decision flow for the next setup
From resistance levels and pair expansion, return to the basics of considering entries
In the August wave that extended from the breakout, also confirm the decision to protect profits
Verification conditions and sources
Using a historical chart of KRAKEN:BTCUSD on TradingView. BB uses a 20-period basis, SMA, closing price, and +/− 2σ; width is the difference between the upper and lower bands. The expansion rate is based on comparison with the immediately previous confirmed candle, not price rise or return percentages. Treat resistances, supports, and buy/hold/exit as hypothetical for explanation.
The confirmed values in the text are determined after each candle closes. The daily chart confirms at 00:00 the following day, and the 4-hour chart confirms after four hours from the start. There are methods to enter during the formation, but the final values shown are not used as intraday values. The vertical lines and date labels in the figure refer to support and resistance levels; the subsequent candles to the right and current price are not included in the explanation. The horizontal dashed line is a crosshair and not a line depicting the resistance/support levels in the text.
The images and numbers are for later confirmation and are not based on BB Watch records or real trade performance at that time. The observations come from daily and 4-hour charts. The 1-hour and 15-minute states are unconfirmed, and the pair-based setup is described as an example of usage. The start time/order of expansion, intraday price movements, and causes of retracements have not been verified. Values may differ depending on the MT5 source. When trading, decide your loss tolerance and follow your own rules.
https://www.tradingview.com/widget-docs/widgets/charts/advanced-chart/