

Aiming to break above the retracement high of BTC and protect the extended gains. How to use BB Watch in the August market
Decide where you want to buy and wait. When it starts moving, ride that wave. After it extends, consider how far you want to keep the profit.
In this article, we aim for the 4-hour wave and show an example of using the 1-hour and 15-minute pairs for entries. Choose the time-frame combination to fit your method and the wave you are targeting. As price moves in your direction, and an expansion appears in the chosen pair, you compare the pair changes in real time with BB Watch to justify the entry.
What to decide first is which time-frame wave you want to take. This presupposes that price is in a situation where you can consider an entry, such as a range breakout or a correction after a trend has broken.
Based on the daily and 4-hour charts of BTC/USD as of August 2026, we will look from the scene to hold management. The entry procedure using the 1-hour and 15-minute charts is described as a similar process for similar situations. The following buys/sells are a hypothetical construction. The date and time are UTC, and prices are in US dollars.
First, decide the breakout points to target
On the daily chart, after falling from the May high area to the end of June, price had recovered. What to watch here is the return high of 67,263.5 dollars reached on June 15.
The close on August 18 was around 64,700 dollars, still below this high. If you’re considering buying, you’re waiting for “whether you can break above the return high and move up.” Deciding this location beforehand makes it clear what to verify when the price starts to move.
The most recent daily BB width widened by about 3.3% from the previous day. Once a change appears on the daily chart, the next step is to track the 4-hour movement and the breakout of the return high.
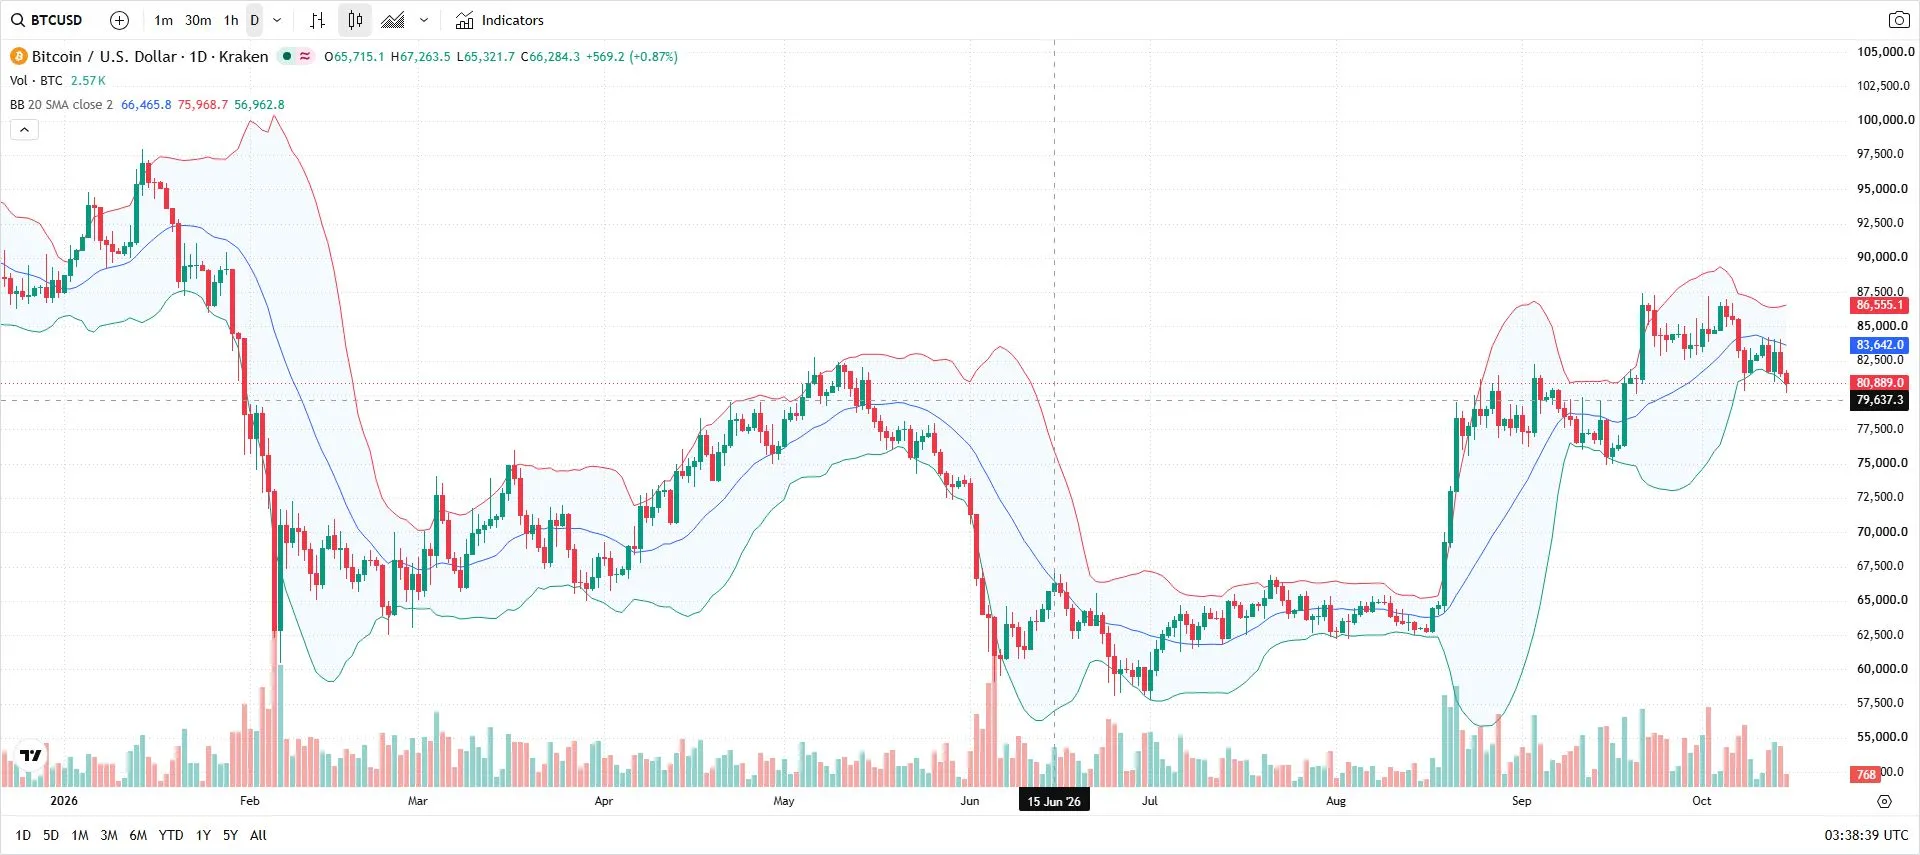
Daily chart background. The vertical line is June 15, 2026. View the return high of 67,263.5 dollars as a breakout point to buy.
KRAKEN:BTCUSD/Charts by TradingView(https://www.tradingview.com/)。Dates and times are UTC.
August 19, a major expansion at the breakout of the return high
From 12:00 to 16:00 on the 19th, the 4-hour chart rose above the return high and closed at 68,539.7 dollars. The high reached about 69,600 dollars. The close also remained above 67,263.5 dollars.
In this leg, the upper BB rose while the lower BB fell, creating a wide expansion up and down. The BB width expanded by about 82.9% from the previous bar.
This is the moment when price broke above the return high on the daily chart and the 4-hour rising wave extended. In this actual measure, we confirmed the breakout and BB widening on the 4-hour chart. When aiming for such waves next, we consider the entry justification using the 1-hour and 15-minute charts.
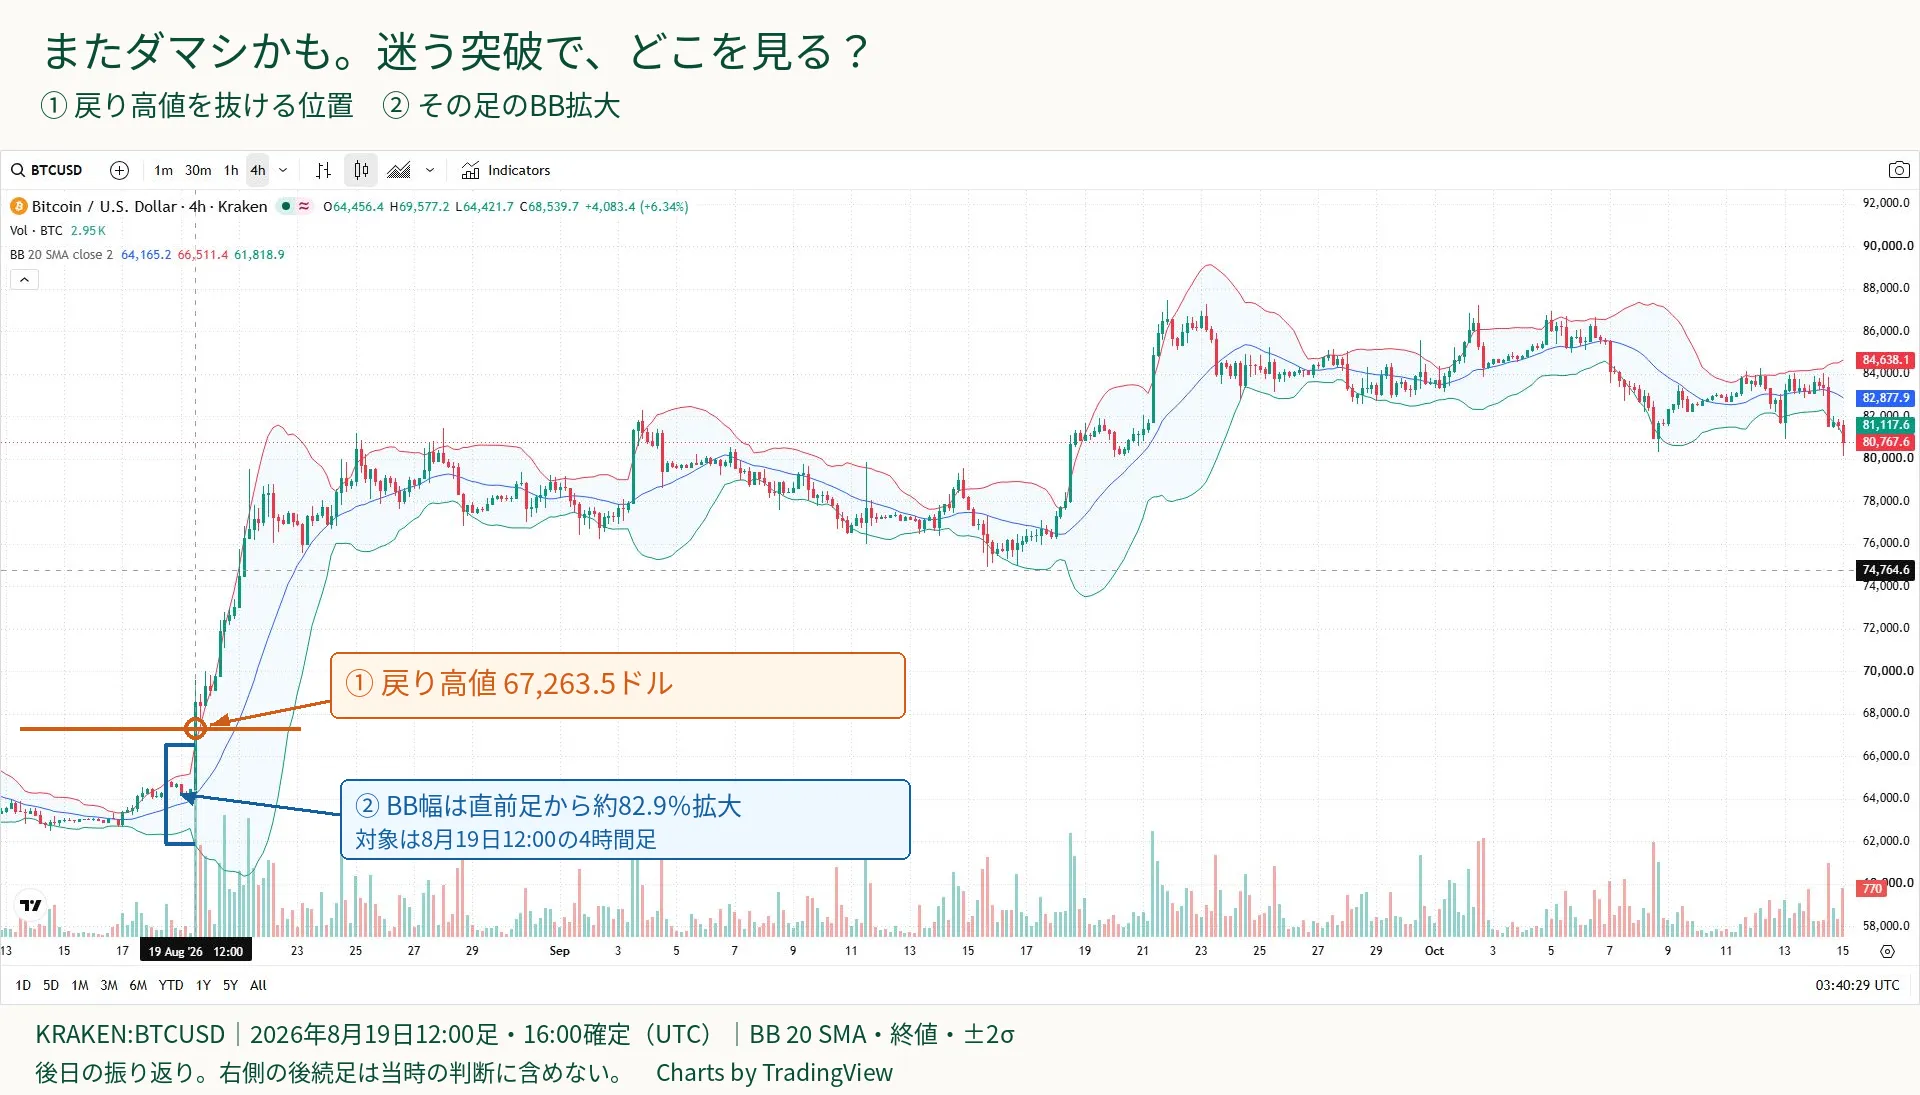
① The June return high of 67,263.5 dollars, a breakout target. ② The BB width on the breakout 4-hour bar, expanding about 82.9% from the previous bar. This is a moment to view the price action that breaks the target level in conjunction with the BB expansion. For the August 19, 2026, 12:00 start to 16:00 close (UTC), the close was 68,539.7 dollars. The orange line, blue parentheses, and arrows are explanatory annotations.
KRAKEN:BTCUSD/Charts by TradingView(https://www.tradingview.com/)。Dates and times are UTC.
Confirming the basis to enter the 4-hour wave with the 1-hour and 15-minute charts
If you are aiming for similar breakouts of the return high, arrange the 1-hour and 15-minute bars side by side in BB Watch in advance. Decide in advance the scenario to target the rising wave on the 4-hour chart, and verify the price action within that framework in a paired manner.
When price breaks above the return high and moves up, expansions appear in both the 1-hour and 15-minute charts. This movement serves as the entry justification. The state where both legs show expansion is confirmed as pair synchronization.
Even if the high is breached, if only the 15-minute chart widens and the 1-hour chart does not expand, be wary of a false breakout that returns after the initial move. Do not chase it; wait for price to stay above the high and for the pair to widen in sync. This is how BB Watch helps you avoid false breakouts by assisting judgment.
If you enter after a pullback, confirm the pair near the breached high as it supports and attempts to move higher again. Use the intended 4-hour wave and the expanding pair that will actually allow entry together.
Before entering, decide how to use the breached price
If you buy on this breakout, the next important factor is how to handle 67,263.5 dollars. If price holds above the resistance area, there is a reason to aim higher and hold. If price pulls back and cannot move higher again, you can close the buy.
If you predefine your stop-loss conditions, you won’t be forced to increase the buying quantity during a wide BB expansion. Consider the amount you can tolerate, matching the distance from entry to stop-loss.
There are methods to enter during the breakout or to wait for a slight pull. In this 4-hour close, price has already moved away from the breached level. If entering from there, compare the potential price move to the next resistance and the distance to stop-loss. If conditions don’t match, wait for a pull to be supported. In this way you can choose where you can enter while watching the same ascent.
From the daily chart onward, determine the wave to target on the 4-hour chart. When entering, confirm the 1-hour and 15-minute expirations. If you line up this pair in BB Watch, you can verify your entry criteria while the price is moving.
If the rise continues, confirm the reason to hold
Subsequently, the daily close on August 21 was around 78,300 dollars. From the return high breached on the 19th, price moved significantly upward. The daily BB width also widened by about 59.7% from the previous day.
If you held a long position, consider how far you should chase the rising wave. Use the breached level and the subsequent pullback lows as supports while checking whether price can push higher. By comparing daily and 4-hour charts while holding, you can chase the big wave while noting near-term changes.
Next, you want to break is the most recent high on the 21st of 79,511.1 dollars. Higher up, around 80,000–83,000 dollars seen in May, and the May 10 high of 82,436.6 dollars also loom. First, can you test the most recent high? With an eye on the prices in the higher high zone, you also want to prepare how much profit to keep.
August 22, preparing to protect profits from the 4-hour contraction
As of 16:00 on the 22nd, the recent confirmed daily chart remained wide. Meanwhile, the BB width on the immediately preceding 4-hour bar contracted by about 8.8%, and the close was 76,966.8 dollars.
While the daily chart still shows a large expansion, the 4-hour chart shows a contraction. By confirming the distance to the recent high and the low at hand, you can decide to take partial profits on your long position or raise the stop-loss level for the remaining quantity.
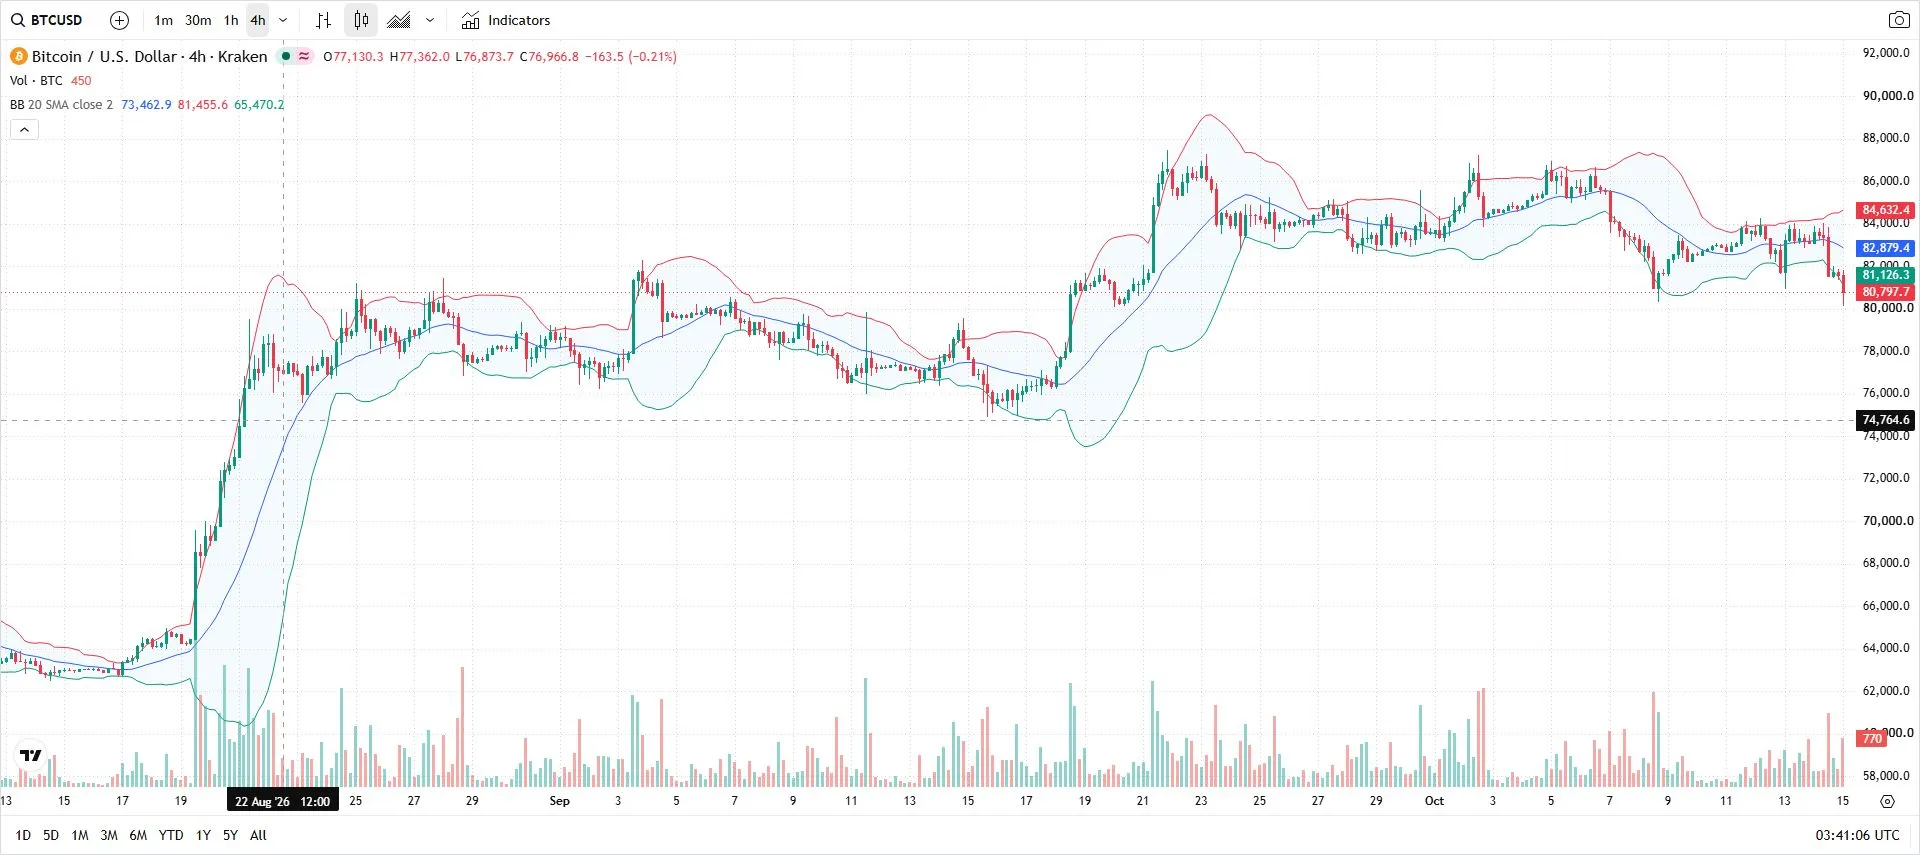
4-hour chart at 12:00 on August 22, 2026 (ended at 16:00). Close 76,966.8 dollars. BB width contracted by about 8.8% from the previous bar, showing a different change from the daily chart.
KRAKEN:BTCUSD/Charts by TradingView(https://www.tradingview.com/)。Dates and times are UTC.
The low of this 12:00 bar was 76,873.7 dollars, holding above the previous bar’s low of 76,533.1 dollars. Since the low at hand has not yet broken, you can secure part of the profits and aim for a renewed rise toward the recent high with the remainder.
For example, use the remaining 76,533.1 dollars to manage the buy. If that low is protected and the 4-hour bar widens again toward the high, extend the remainder. If the price falls below the low and cannot recover, close the rest. In this way you can leave room for upside while setting profit-protecting conditions.
While holding, compare daily and 4-hour changes, reassess the price and position size, and if you intend to add new buys, look for a place where the next 4-hour rising wave can be targeted, and check the 1-hour and 15-minute expirations. Even after deciding to protect profits, your next setup depends on the waiting conditions for the next entry.
Follow the same procedure from entry to protecting profits
From the actual charts of the daily and 4-hour, we observed the breakout of the return high and subsequent contraction. Based on that, we explained the procedure of using the 1-hour and 15-minute expirations as entry justification when aiming for similar 4-hour waves.
Choose the target scene in advance, wait for the expansion of the pair that fits your method, and after entering, manage the hold by price and time-frame changes. If you incorporate BB Watch into this flow, you can decide what to wait for and what to move on the basis of your entry criteria.
For those who want to use the changes in the chosen time frame to assist entry and hold management. The display and how to implement can be seen on the product page.
BB Watch product page
Next, read the scenes you want to confirm
Before entering, proceed to confirm resistance and pair expansion
In the July example where breakouts did not continue, confirm the condition to take profits
Verification conditions and sources
Using TradingView’s KRAKEN:BTCUSD historical charts. BB uses a 20-period, SMA, closing price, and 2σ up and down; width is the difference between the upper and lower bands. Expansion/contraction rates are based on comparison with the immediately prior confirmed bar, not on price rise or profit rate. Whether resistance or support, entry/holding/profit-taking are hypothetical for explanation.
The confirmed values in the text are known after the end of each bar. The daily bar is confirmed at 00:00 the following day, the 4-hour bar four hours after it begins. There are methods to enter while forming, but the final values shown are not intended as intraday values. The vertical lines, date labels on the diagram, and the right-side subsequent bars or current values are not included in the explanation. The horizontal dash line is a crosshair, not a line depicting the resistance/support levels in the text.
The images and numbers are for later verification and do not reflect BB Watch records or actual trades at that time. Actual measurements are on the daily and 4-hour charts. The state of the 1-hour and 15-minute charts is unverified, and the pair-based entry described is an example of usage. The start time and order of expansion and intrabar price moves are not reproduced. Prices and BB values may differ by MT5 provider. When trading, determine your loss tolerance and follow your own rules.
https://www.tradingview.com/widget-docs/widgets/charts/advanced-chart/