How to Create a Trading Plan Learned From a Currency Exchange Broker|Chapter 22: Incorporating the Three-Wave Theory into USD/JPY Market Analysis (15) [Toshirō Asano]
Toshio Asano Profile

Asano Toshirou. A former employee of Tokyo Forex (Foreign Exchange Brokerage) in the Tokyo Short-Term Financial Group, with experience at Tokyo Forex Corporation and at EBS (now ICAP), which boasted over 80% market share in foreign exchange trading worldwide, among others. He has firsthand experience of historic markets such as the 1985 Plaza Accord, the ensuing era of yen appreciation, the bubble burst, and the Euro introduction in 2000, shaping his market perspective. He has since founded two FX trading companies and worked as a dealer for a private FX fund. Currently, he writes for the daily blog of the Investment School Group. He is also a strong advocate of clear, easy-to-understand video works that utilize his skill in video editing.
This project will have Toshirou Asano teach his trading methods and market perspective construction based on his own experience and knowledge without leaving anything out. As before, he will continue to analyze recent and future USD/JPY market conditions and present the most suitable trading plans.
*This article is a reprint/edit of an article from FX攻略.com February 2019 issue. Please note that the market information described herein may differ from current market conditions.
The weekly chart is gradually aligning for a self-sustaining bullish trend
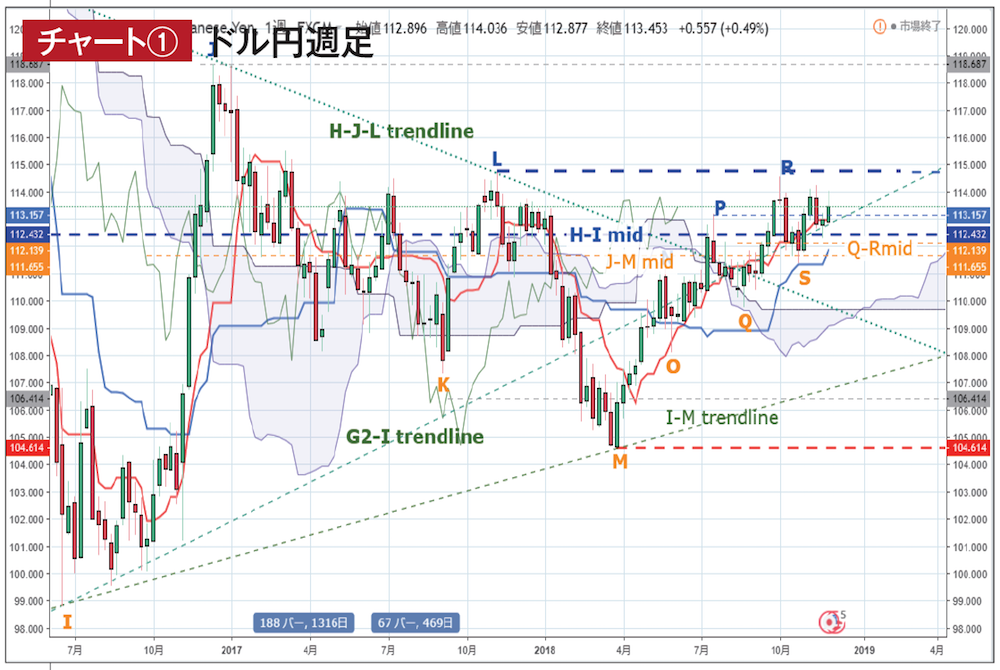
Source:USDJPY chart by TradingView
First, let's look at the weekly chart (Chart ①).
By the time of the previous issue, the weekly chart had already formed a pullback for R–S. Even after four weeks since then, prices have not broken through either the high R or the low S, and the target low for the conversion line rose passively to 112.963 yen and then moved horizontally, indicating a range-bound market. The target high for the following week temporarily fell to 112.805 yen as the high shifts to the next week, but the market is gradually shifting toward a self-sustaining upward phase again.
Meanwhile, the baseline line will continue to rise passively until the target low moves to Q, reaching 112.139 yen at the Q–Rmid. The H–Imid level around 112.432 yen, carrying both the conversion line above and the baseline line below, seems to become a stronger and more important support band than before.
When pursuing triphasic movements, going forward we will watch M-originated M–P–Q–X, M–R–S–X (X is the maximum time), in addition to O-originated O–P–Q–X, O–R–S–X, and Q-originated Q–R–S–X patterns. The O–P–Q–X pattern concluded on time with a second top after the high R as a bearish week, but it appears to be continuing its upward wave smoothly, returning above the conversion line in the most recent week without a large drop.
In any case, the time limits for the M-originated triphasic and the O–R–S–X waves are a bit ahead, so the initial focus should be on Q–R–S–X, occurring in the following week and four weeks later.