
After the Goto Day midpoint quote, does the dollar/yen tend to fall? Has this continued to today? Counted over 36 years and 9 months of public data (1990–2026)
“On Gotō days (the 5th, 10th, 15th, 20th, 25th, and month-end), the dollar-yen tends to rise toward the 9:55 official fixing, and after the fixing it tends to fall.” This is a well-known story in FX. However, it is often said that the well-known price movement biases tend to shrink over time (in a U.S. stock study by McLean and Pontiff (2016), they reported that out of 97 biases announced in papers, on average about 60% became smaller after publication). From when and to what extent has this bias persisted?
I am the “Verification Sommelier” who lists indicators and e-books (EA is under review). In previous gotō-day articles, I counted from 2015 onward using MT5 1-minute data. This time, using prices published by banks and central banks, I count back to 1990.
Previous articles:https://www.gogojungle.co.jp/finance/navi/articles/127985
First, the conclusion
・On gotō days, the afternoon price tends to be lower than the official fixing. If you count the “17:00 rate − fixing” using the Bank of Japan’s 17:00 USD/JPY price, gotō days average is −8.5 pips, other days are −3.9 pips, giving a difference of −4.6 pips (January 1998–September 2026; t value −4.6 indicates a magnitude unlikely to occur by chance. See “how to count” for details). The negative bias on other days is mainly because the fixing price is normally a little higher than the market price (confirmed using market prices from 2015 onward).
・When divided by period, 1998–2007 −5.0, 2008–2015 −3.5, 2016–September 2026 −4.9 pips, with no clear sign of decreasing.
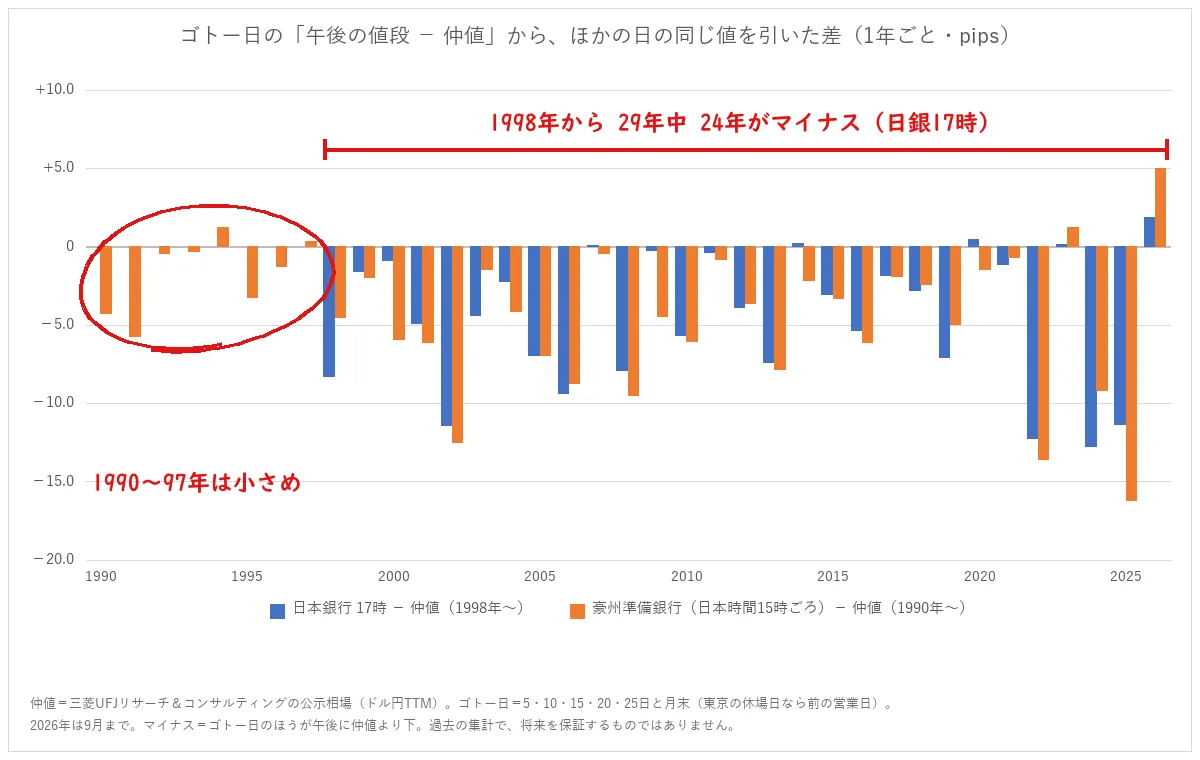
・Regarding “still now,” for each year in the 29-year span (through 2026 September), 24 years were negative; among 2020–2026 seven years were positive (2020, 2023, 2026). However, the year-to-year difference has about ±12 pips error, so summarizing 2020–2026 September yields −5.3 pips (t = −2.4).
・Using the Australian central bank (RBA) quotes (14–15 JST) allows extension back to 1990. From 1998 onward, the difference with the BOJ is similar (−4.7 to −5.3 pips), but 1990–1997 shows a smaller gap (−1.7 pips; excluding extreme days, −2.9 pips).
・However, not every time. Days where the fixing was below the fixing at 17:00 occurred on gotō days 61.5% and on other days 55.2%. Against a daily variation (standard deviation around 37 pips), this bias is small.
・If you divide by market price (since 2015), among the −4.9 pips difference in that period, an estimated about 70% (range 30–80%) came from the market price dropping after the 9:55 fixing, and about 30% came from the fixing price being higher than the market price (numbers exclude intervention days; the counting continues as described). These exclusions are not predictable in advance, so they cannot be used in actual trading.
How we count
・Fixing rate: the publicly quoted rate by Mitsubishi UFJ Bank (USD/JPY TTM). Past values are published by Mitsubishi UFJ Research & Consulting (the 1990s values come from the predecessor Tokyo Bank, etc.). January 1990–September 2026.
・Afternoon price: ① The Bank of Japan’s “Tokyo market USD/JPY spot as of 17:00” (from 1998 onward) ② The Australian Reserve Bank’s daily 16:00 (Sydney) rate-converted USD/JPY (Japan time 15:00; when Sydney uses daylight saving, 14:00) (1990–).
・Morning price: Bank of Japan’s “as of 09:00” (1999 onward).
・Gotō day: 5, 10, 15, 20, 25 and month-end. If it falls on Japan market holidays (weekends, holidays, Dec 31–Jan 3), the previous business day is used.
・One day’s value is “afternoon price − fixing” in pips (0.01 yen), and “gotō day average − other days’ average” is called the “difference.”
・The fixing price is determined by the banks each morning around 9:55 and is not a price you can trade at directly. The fixing price is usually a little higher than the market price; if it were higher by the same amount every day, the “difference” would vanish (whether gotō days are higher is counted in Result 2).
・In results 2–4, days when the market price at 9:55 moved sharply and the fixing was readjusted (line of distinction: days when the fixing price and 9:55 price differ by more than 1 yen) were excluded (from 2015 onward, 15th). The fixing on days readjusted is not at the 9:55 price, so “after the fixing” cannot be measured, since interventions are government buy/sell; this exclusion is added after the initial counting (numbers that do not exclude are also written later). Since these days cannot be predicted in advance, they cannot be excluded in actual trading.
・t values indicate how many times larger the difference is than what would be expected by chance (the larger the duration, the smaller this range). If the absolute value exceeds 2, it is unlikely to be due to chance, and if it exceeds 3, it is almost certainly not due to chance.
・Numbers are rounded (some subtractions do not exactly equal 0.1).
・The line deciding “continuing vs fading” was set before counting (t values are measured using the magnitude with the plus/minus removed; both can occur).
Continuing = the overall difference aligns with the expected direction for 3 or more of the periods (1990–1997, 1998–2007, 2008–2015, 2016–September 2026; BoJ data starts in 1998, so there are three periods).
Fading = the slope of the line drawn through year-to-year differences approaches 0 with t value ≥ 2, or the last period’s t value is less than 2.
Result 1: 28 years 9 months, clearly not getting smaller
・BOJ 17:00 − fixing (gotō day − other days): 1998–2007 −5.0 pips (t −2.8) / 2008–2015 −3.5 pips (t −2.1) / 2016–2026 September −4.9 pips (t −3.1) / all periods −4.6 pips (t −4.6)
・RBA (Japan time 14–15) − fixing: 1990–1997 −1.7 pips (t −1.0) / 1998–2007 −5.3 pips (t −3.9) / 2008–2015 −4.7 pips (t −3.7) / 2016–September 2026 −4.7 pips (t −3.8) / all periods −4.2 pips (t −6.1)
・Slope of the year-to-year linear regression: BoJ +0.004 pips/year (t +0.04), RBA −0.06 pips/year (t −1.0). Neither has a clear slope (the “fading” line trends toward 0 with t ≥ 2).
・There is an error of ±3.1–3.5 pips (95% range) in the BoJ period-to-period differences, and about half of the changes cannot be distinguished. It cannot be said that they “continued at the same magnitude”; at best, we can say “they have not clearly become smaller.”
・Even if you exclude the days of FX interventions published by the Ministry of Finance (170 BoJ days with BoJ prices), the overall period remains −4.7 pips (t −4.8), with almost no change.
・If you exclude extreme days by ±1% up/down, BoJ shows −6.0/−4.5/−3.6 pips across periods, suggesting a minor fading trend; however, the difference between the first and last periods has t-value of 1.2, within error.
・Using the same exclusion method, the RBA shows −2.9/−4.5/−4.5/−4.1 pips across periods. 1990–1997 yields t = −2.3, which is more pronounced than when not excluding (t = −1.0).
→ With the pre-set counting lines, both show “continuing = yes; fading = no.”
So far this is historical aggregation; future results are not guaranteed. These aren’t tradable prices (nor accounting for spreads or other costs). The rules using the 9:55 price after gotō days (through 11:30) and 11 years 9 months from 2015 onward are summarized in the e-book and indicators (Fixing and Tokyo morning rules [e-book]:https://www.gogojungle.co.jp/tools/ebooks/87687/ After-fixing signal:https://www.gogojungle.co.jp/tools/indicators/87539)。
In the continuation, we count: ① “Contents of the decline” divided by market price, ② the days that moved the average between 2010 and 2014, ③ the result of counting the rise before the fixing from 8 o’clock.