

20 items to check before buying EA and dangerous answer combinations
I am the director of the FX Grail Research Institute. I am a 50-year-old systems engineer, recording how I test automated trading methods that look like they might win against past data and break them down.
In the articles from September 26 and 29, I read the numbers on the product pages one by one. Today, before buying an EA (a program that automatically conducts FX trading), I will read the 20 items you should look at, in combination.in combinationI will read them.
September 26 article “What is PF? Three cases where the product page PF 1.5 would still be in the red”:https://www.gogojungle.co.jp/finance/navi/articles/126730
September 29 article “Reasons why a 90% win-rate EA is dangerous”:https://www.gogojungle.co.jp/finance/navi/articles/126847
The numbers appearing in these articles are all calculation examples for explanatory purposes.They are not my own verification results or performance.
Conclusion
If you view the product pages item by item, each one may appear to pass. The danger lies in,when you have answers that you miss one by one, but they overlap.
Therefore, I will follow the two rules below.
- Before opening the product page, write down in advance “I will not buy if this is the answer.”
- Doubt the gap between the product page’s performance and the real trading results
In the free section, I will show the five groups of the 20 items and one of the riskiest combinations, using a calculation example.
If viewed one by one, three answers that look good
Suppose a certain EA’s product page includes the following three items. These are calculation examples for illustration.
- Description of construction: if you lose, you double the size of the next trade
- Recommended funds: 100,000 yen
- Performance: profitable after 100 trades
The first is a martingale (increase the trade size after every loss). No matter how many times you lose, if you win once next, you recover the losses and turn a profit. Read only this part, and it looks reassuring.
The second is the recommended margin (funds suggested to operate that EA). With 100,000 yen, you can start with a small amount of capital.
The third is the number of trades. If you are profitable after 100 trades, it may not collapse immediately.
Stacked, you burn through funds after 7 straight losses
I calculate the three together. Let the first loss be 1,000 yen. The amount is after deducting trading costs (the difference between bid and ask and fees).
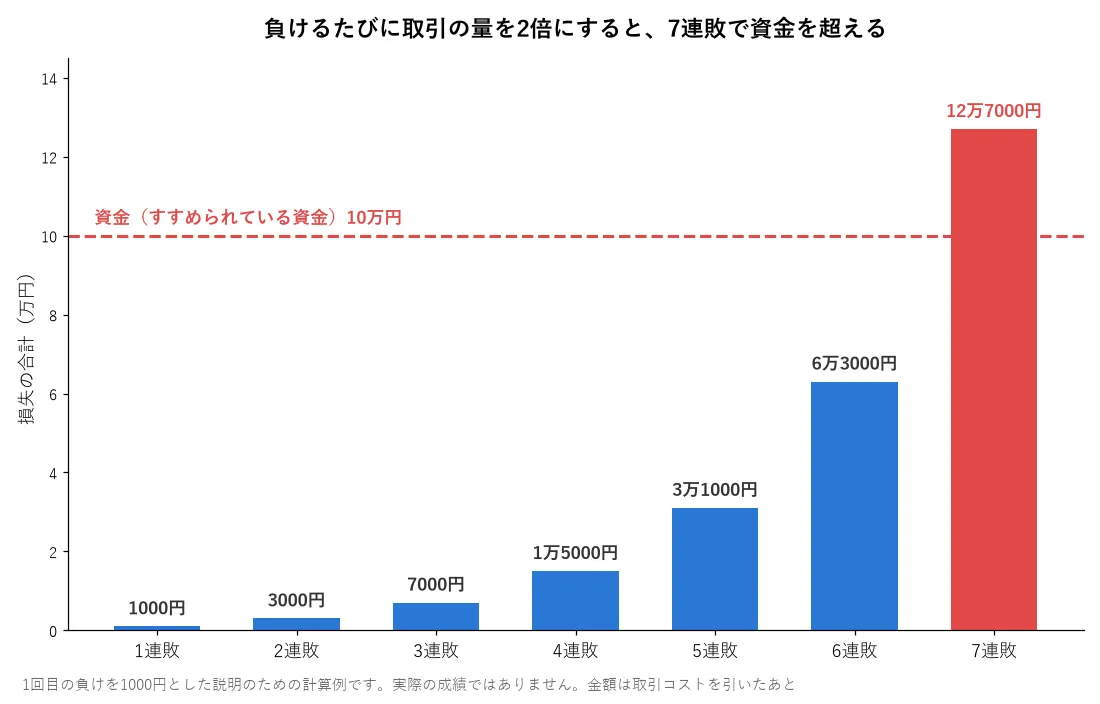
Because the trade size doubles with each loss, the loss amounts also double: 1,000 yen, 2,000 yen, 4,000 yen, … The total loss after six consecutive losses is 63,000 yen.
After six consecutive losses, remaining funds are 37,000 yen. The seventh trade, if you lose, will reduce funds by 64,000 yen.If you have seven straight losses, the total loss reaches 127,000 yen and exceeds the 100,000 yen of funds.“You can recoup with the next win” only if you still have funds left to cover the next loss.
So, how often does seven straight losses occur? Assume win rate is 60%. You lose about 4 times out of 10 trades.
The probability of seven consecutive losses starting from any one point is about 0.16%. About 1 in 600, so it seems rare.
However, with more trades, the story changes.The probability that seven straight losses occur at some point within 100 trades is about 9%. Within 1,000 trades, about 63%.
In other words, even if the 100-trade result is in the black, that might just mean seven straight losses haven’t occurred yet. If you continue the same setup to 1,000 trades, there is more than a 60% chance somewhere you will encounter seven straight losses. If the funds haven’t reached 127,000 yen by then, you will go over the funds.
The hardest to watch is a combination where funds can disappear all at once
Among the 20 items, what I weigh the heaviest is the overlap of, as in the above example,a pattern where losses can occur all at once, funds that cannot withstand that, and a short, not-yet-seen performance.
Reason: there is no time to stop. If losses build up slowly due to trading costs, you can stop when performance worsens. This shape can wipe out funds in a single day of a losing streak, so by the time you notice, it’s already over.
A setup that does not cut losses (no set stop) can also take this form.
The martingale setup, where you increase buys without cutting losses, can also produce this shape. Which answer overlaps with danger will be described for each combination in the paid portion.
The 20 items are grouped into 5 clusters
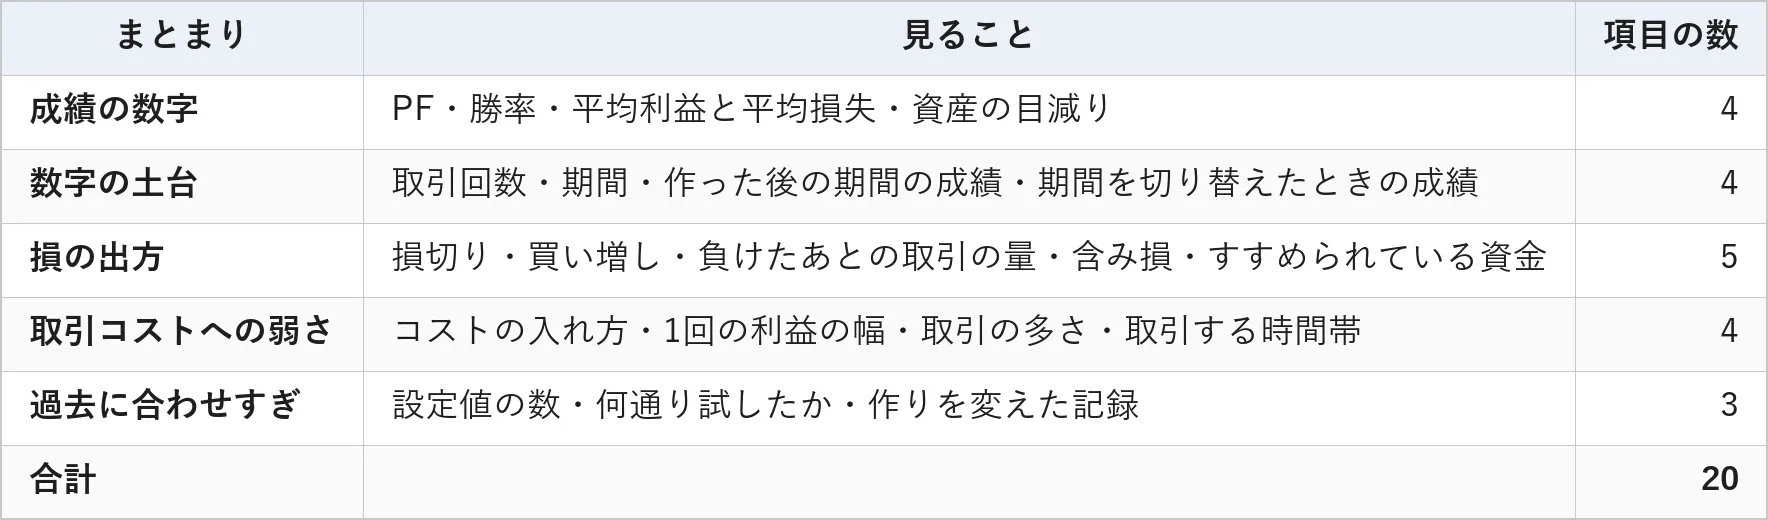
Even within clusters, dangerous combinations are not found. The martingale example above spans two elements of the “loss pattern” and the “base numbers” of the number of trades.
Two ways of thinking
Decide the criteria first.If you decide the criteria after seeing good numbers, the criteria loosen. You might think, “If PF (the ratio of total profit to total loss; below 1.0 means red) is this high, maybe fewer trades are okay.” Therefore, before opening a product page, write down “I will not buy if this is the answer.” It’s the same method I use to decide what to discard before evaluating my own tests.
Doubt the gap with real trading.The performance on product pages is from backtests or records under fixed conditions. In real trading, costs can widen during certain hours, etc., causing the performance to differ. I now compare the results of my validation program with the trading software’s validation function for each trade to measure the gap. I have not published numerical results yet, but you can already doubt that performance will shift depending on conditions before buying.
What’s included in the paid section (980 yen)
- A list of six risky combinations, the reasons for each, and how to verify them on the product page (high win rate, increased trade size after losses, averaging up, vulnerability to trading costs, overfitting to past data, performance over time)
- Tables showing the probability that seven straight losses occur somewhere according to win rate and number of trades, and a table showing how many consecutive losses one can withstand given multiple of the first loss funds
- Calculation example where the floating loss from averaging up does not appear in realized profit
- Procedure to recalculate PF by adding trading costs from the product page’s average profit and loss
- Examples of how to write benchmarks and a flowchart for pre-purchase checks
- Bonus: 20-item confirmation table (where to look and possible dangerous answers; space to copy)
Even the free portion allows you to distinguish today’s martingale and small-fund combinations.
In conclusion
At FX Grail Research Institute, when you see good numbers, our first step is to search for the conditions under which they will collapse. In today’s example, the collapse condition was “the total loss from a losing streak exceeds the funds.”
The calculations and figures in this article were created with AI, and all numbers are double-checked by a program.
We do not promise a method that guarantees success. But we believe the Grail exists and are continuing to search for it.
The Grail I’m looking for is a buy/sell rule that does not break even when including trading costs, even for periods you haven’t yet seen. A martingale that looks good after 100 trades might be a fake if seven straight losses hasn’t occurred yet.
Even a fake that looks acceptable one item at a time reveals its true form when you add the answers together. Write down the “no-buy” answer before opening the product page, read by layering the answers. Just that can eliminate one fake. Each fake you eliminate brings you one step closer to the Grail.
Glossary
- EA: A program that automatically conducts FX trading
- PF: Total profit from winning trades ÷ total loss from losing trades. Falls below 1.0 means red
- Win rate: Ratio of winning trades to total trades
- Martingale: A method that increases the next trade’s size after a loss
- Recommended margin: Funds advised to operate that EA
- Stop loss: Automatically close a position when losses reach a predetermined line
- Namping: Increasing purchases without cutting losses on losing trades
- Floating loss: Unrealized loss on trades not yet closed
- Setting value: The numbers within the trading rules
- Trading costs: Money incurred each trade, including the spread (difference between bid and ask) and fees
※This article is not financial advice. All numbers are calculation examples for explanatory purposes.