
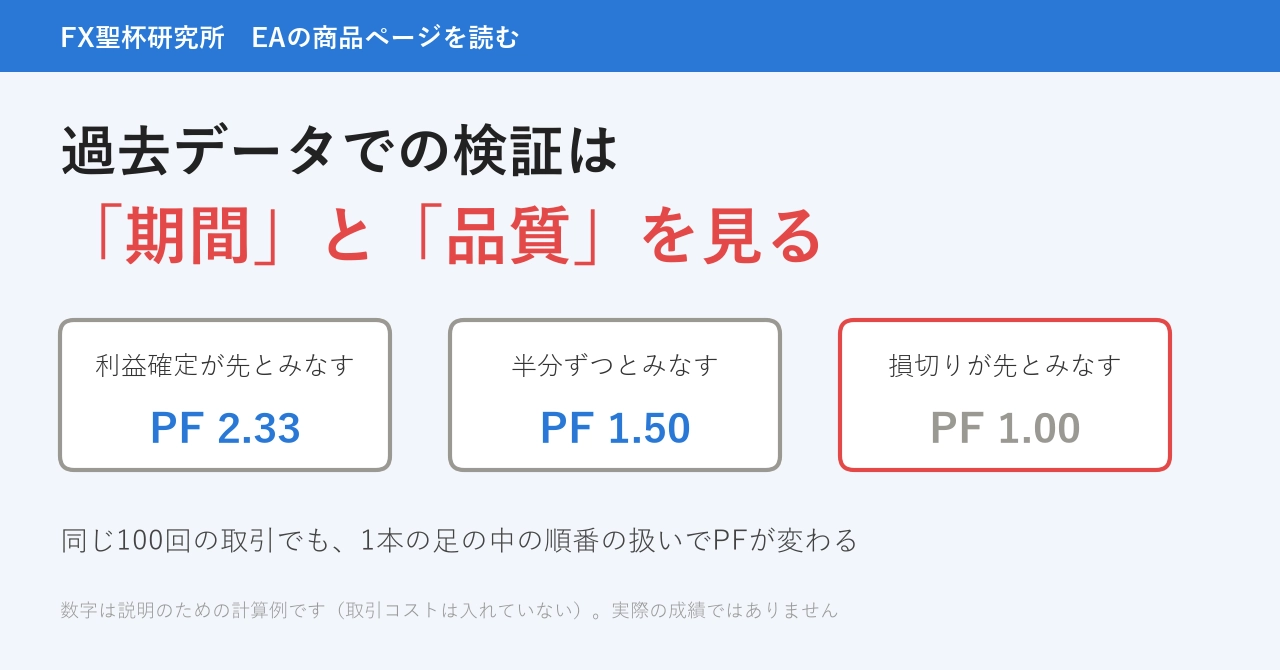
Validation using EA's historical data looks at "period" and "quality." A calculation example where the same 100 trades yield PF of either 2.33 or 1.00
I am the director of the FX Holy Grail Research Institute. I am a 50-year-old system engineer, and I keep a record of validating automated trading methods that seem to have a winning edge using past data and breaking them down.
On the product page for an EA (a program that automatically executes FX trades), there is a tab named "Backtest." Backtest refers to validation with past data. Today, I want you to look at two numbers before the performance on past data: the "Period" and the "Quality."
All the numbers appearing in this article are calculation examples for explanation.They are not my own validation results or performance.
Conclusion
The performance of validation on past data depends onhow long you tested for, and how fine the data wasand this changes how trustworthy it is.
There are two numbers to look at.
- Period:From which year and month to which year and month you tested
- Quality:How fine the data used for validation was (expressed as a percentage)
The second item is easy to overlook.If the quality is low, the way wins and losses are counted for the same trades can change. In the calculation example, the same 100 trades could yield a PF of 2.33 or 1.00.
What is validation on past data
Validation on past data (backtest) runs the EA on past price movements to produce “what performance would have been if it had run during that period.” This is done with the trading software’s validation function.
What matters here is:the trading software can only reproduce past data down to the granularity you have on hand.
Only using hourly bars cannot tell which comes first
Past price data is stored as a sequence of open, high, low, and close at fixed time intervals. This unit is called a "bar" (candlestick).
Trading software (MT5) typically uses bars as fine as every minute, but for clarity here I will explain with hourly bars. The order within a minute bar is the same issue.
Here is a calculation example. Imagine an EA that buys USD/JPY and closes the profit when it rises by 5 pips, or closes the loss if it falls by 5 pips (if it hits the predetermined line, it closes automatically). One pip equals 0.01 yen.
In one hourly bar, suppose the high is 7 pips above the buying price and the low is 7 pips below. Both the profit-taking line and the stop-loss line have been reached.
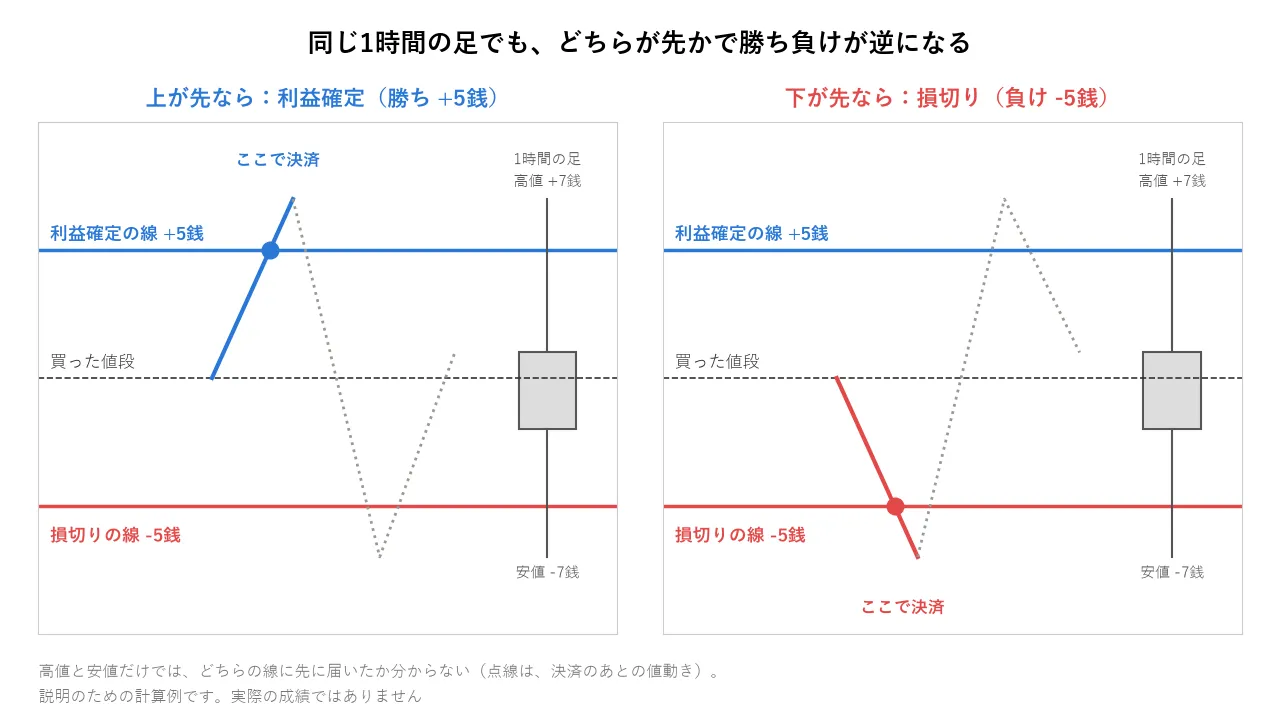
If the price moved up first, you have a win at the take-profitwin. If it moved down first, you have a loss at the stop-lossloss. Just the high and low cannot tell which came first.
Whether you count one as first changes PF
PF (the ratio of total profit from winning trades to total loss from losing trades; 1.0 means break-even) is used for comparison.
Condition: 100 trades, trade size 10,000 units (a 0.01 move yields 100 currency units), take profit +5 pips, stop loss -5 pips. Of the 100 trades, 80 have a clear winner or loser (50 wins, 30 losses). The remaining 20 have both lines reached within a single bar, and which came first is unclear. No trading costs are included.
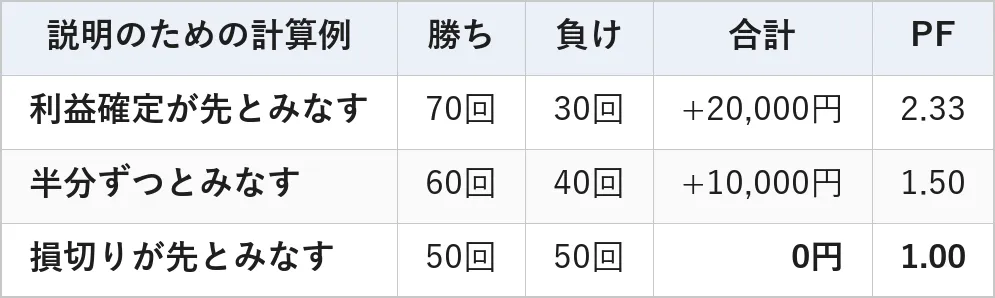
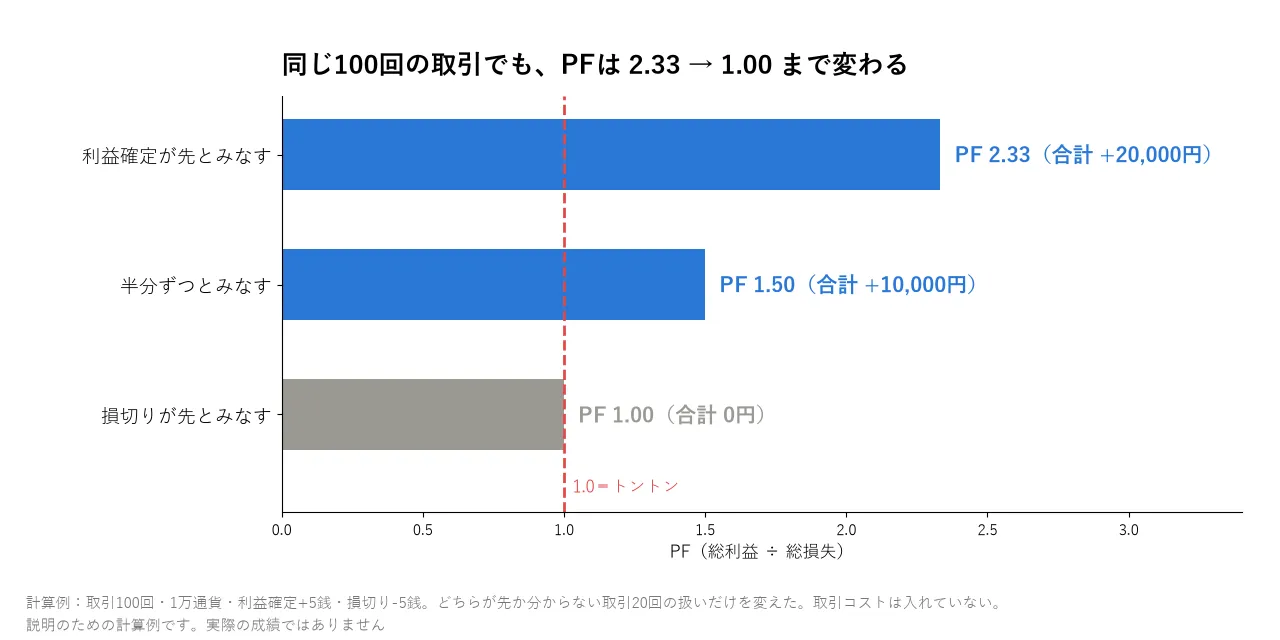
If you count all 20 as “take profit first,” you get 70 wins and 30 losses, PF 2.33, total profit of 20,000. If you count half as take profit first and half as not (10 each), you get 60 wins and 40 losses, PF 1.50, total profit of 10,000. If you count all as stop loss first, you get 50 wins and 50 losses, PF 1.00, total 0 profit. If you include trading costs, you would be in the red.
The same EA, only the counting method for the 20 trades changed.In reality, which one it was cannot be determined without the finer intrabar price movements.
The smaller the target price range per trade, the bigger this effect. In one hour, USD/JPY can easily move more than 5 pips up or down. If an EA targets 50 pips per trade, reaching both lines within one hour becomes much rarer.
What is quality
Quality is a percentage that indicates how finely the price movement data used for validation was aligned. On MT5-based validation reports, this is labeled “History Quality”; on MT4, it is labeled “Modeling Quality.”
If the data is finely aligned, you can reproduce within a single bar who moved first in a way that closely resembles actual price movements. If fine data is missing, the trading software fills in the gaps by constructing the intrabar movements in a fixed sequence. That can cause wins and losses in trades like the 20 trades above to diverge from reality.
The higher the quality, the more trustworthy past data results become.When quality is low, treat the results as being influenced by inferred intrabar movements.
GogoJungle listing rules: the lower the quality, the longer the period required
On GogoJungle, there are rules about the validation period for past data when listing an EA, depending on quality. This is the response I received on September 24, 2026 after inquiring for listing preparation. The wording differs from the FAQ page, so sellers should verify the current policy with GogoJungle at listing time.

If quality is 80% or higher, the validation period must be at least 2 years; if quality is below 80%, at least 7 years. Lower quality requires testing over a longer period.
Note on interpretation:Two years and seven years are minimums for listing.Meeting the minimums and ensuring the performance remains stable in periods not yet observed are separate concerns. In my own validation, I set 12 years of data as the criterion to confirm.
GogoJungle product pages: look here
Product pages have tabs such as “Backtest” and “Forward Test.” I confirmed the tab names on two best-selling product pages on September 26, 2026. When I opened those two pages again on October 1, 2026, the validated period was listed on both, but the quality value was shown on only one. Even best-selling products may not display quality.
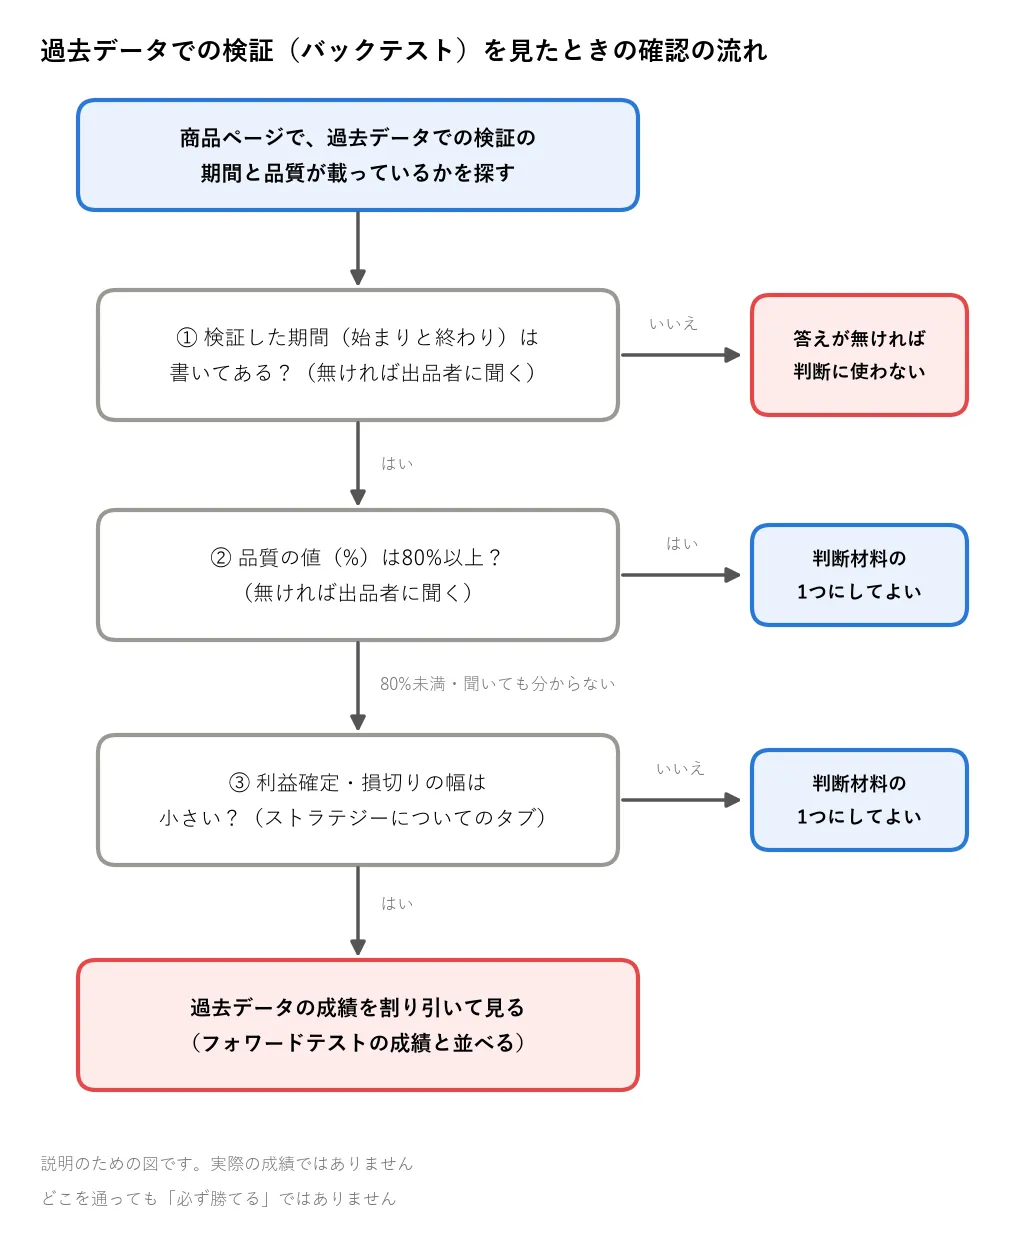
After opening a product page, look for the following two items under the “Backtest” tab, etc.
- The validation period.From which year and month to which year and month. Whether it exactly spans two years or exceeds ten years. If not listed, ask the seller in the “Community” tab; if no answer, do not use that performance in your judgment.
- The quality value (%).In the trading software reports, this corresponds to “History Quality” or “Modeling Quality.” If not listed, ask the seller.
If the quality is under 80% or you cannot obtain it, then look at the “About the Strategy” tab. Here you will find fields for the profit-taking width and the stop-loss width.
The field names are “Take Profit” (width of profit-taking) and “Maximum Stop Loss” (width of stop loss). The smaller this width, the more the performance within a bar can vary as shown in the calculation example above.
At those times, discount the past data performance. Also compare it with the Forward Test results tab. The Forward Test is the performance after listing, using a practice account that does not involve real money, so there is no need to estimate intrabar order. See the September 29 article “Why a 90% Win Rate EA is Dangerous” for cautions about interpretation.
September 29 article:Why a 90% Win Rate EA is Dangerous
In my validations, when in doubt I assume stop loss comes first
In my validation program, if both lines are reached within a single bar and which comes first is unclear,I treat it as stop loss coming first.In the above calculation example, this is the strictest way to count PF.
The reason is that the Holy Grail condition includes “even with trading costs, it does not collapse in unobserved periods.” Methods that look favorable when counted that way may fail in real trading. Only methods that remain after counting the less favorable side proceed to the next step.
Right now, including this counting method, I am cross-checking my validation results with the trading software (MT5) validation results for each trade. This is to see where they diverge. I do not reveal the final numbers until I have checked them.
Finally
In today’s calculation example, the condition for performance to collapse was counting trades where it’s unclear which came first in favor of the more favorable outcome. The same EA can swing from a 20,000 yen profit to break-even simply by changing counting rules.
I generated the calculation examples and diagrams with AI, and I verified the numbers with my own programmatic checks.
I cannot promise that the Holy Grail will be found. Still, I believe it exists and I am seeking trading rules that do not collapse even when counted in the less favorable way. For me, the Holy Grail is a trading rule that does not break even with unobserved periods or with trading costs included.
Small profits from low-quality data depended on how the 20 trades were counted, producing PF values of 2.33 to 1.00. Next time you open a product page, look first to see whether the period and quality are listed before the performance figures. If they are not listed, that itself is a basis for judgment. If you can identify one counting method that looks good, that will narrow down where to look for the Holy Grail.
Glossary
- EA: A program that automatically conducts FX trading
- Validation on past data (backtest): Running the EA on past price movements to produce performance
- Bar: A unit of time (for example, one hour) consisting of open, high, low, and close
- Quality: A percentage expressing how finely the price movement data used for validation is aligned. In MT5, called “History Quality”; in MT4, “Modeling Quality”
- MT5, MT4: Names of FX trading software used to run the EA. They also have backtest capabilities
- PF: Total profit from winning trades ÷ total loss from losing trades. Below 1.0 is loss
- Stop loss: Automatic exit when the price reaches the predetermined line
- Take profit: Width of profit-taking. A tab item in GogoJungle’s “About the Strategy”
- Maximum stop loss: Width of the stop loss. Same tab item
- Sen: 0.01 yen. For a 10,000-unit trade, a 1-pip move moves 100 yen
- 10,000 units: Trading volume unit. For USD/JPY, 10,000 dollars
- Trading costs: Money paid on each trade. The spread between bid and ask, and fees
- Forward test: Performance obtained after listing, by running the EA in a practice account with no real money. On GogoJungle, it runs with no actual funds
※This article is not investment advice. All numbers are calculation examples for explanation.