

Move stop loss, chase the sharp rise, try to recover. MIR A full-feature guide reevaluating GOLD's "usual mistakes"
Right after you buy, GOLD starts to fall.
At first I had decided, “If this dip is broken, I’ll cut.” Yet as the price nears, I move the stop a bit lower. “Since it has fallen this far, it should at least bounce once.” As I watch the unrealized losses, the purpose of looking at the chart shifts from market confirmation to “finding a reason to hold.”
Finally I cut the loss, and this time there is a sharp rally. I buy without waiting for a pullback, wanting to recover the earlier loss. When it retraces a little, I get scared and close the position, then watch the rise that follows. Conversely, because the higher timeframe is down, I continue selling and miss the five-minute chart’s changes.
This is not a specific trading performance but an example of a moment when judgment collapses. If you recognize this, wouldn’t you review the order of confirmations before looking for the next signal?
“I don’t want to lose”, is it delaying confirmations?
I don’t want to realize a loss. I don’t want to miss out. I want to recover today’s defeat.
If that feeling is strong, judgments are pulled more by my break-even level or the previous loss than by price changes. “Where to wait,” “what to confirm before considering,” and “what to skip if it breaks” get rewritten after the trade.
MIRA is an MT5 indicator that places the order of confirmation — waiting price → confirmation on the bar of a completed unit → consideration/omission — on the chart.You can organize confirmation materials to protect your funds before trading.
The following is a full features guide that compares the screen confirmed with GOLD/XAUUSD on Ex〇〇〇 and the implementation/product description. The images were captured on September 17, 2026, on the MIRA 1.5.6 identity-verification edition’s actual chart, including past date specifications. The red moving average line is from another MT5 indicator and is not included in MIRA’s features.
Because the selling version and the edition differ, please check the features offered at the end of the product page when you purchase. The prices and displays are examples at the time of capture and are not current buy/sell instructions.
1. Do not decide based only on immediate price movement — multiple timeframes and Dow structure
Even when the five-minute chart goes up, the hourly and four-hour charts aren’t necessarily the same
MIRA displays the Dow wave formed by confirmed highs and lows, and the押し安値 (pullback lows) and 戻り高値 (retracements highs) that serve as structural references. In addition to the 5-minute chart, you can check the hourly and four-hour charts and view the wave on their own charts. The corresponding timeframes are M1, M5, M15, M30, H1, H4, D1.
It provides material to distinguish “a strong rise” from “the higher-timeframe downtrend structure has finished.” Confirm by checking which candle’s close would exceed the retracement high to end the structure, along with the panel’s conditions and lines.
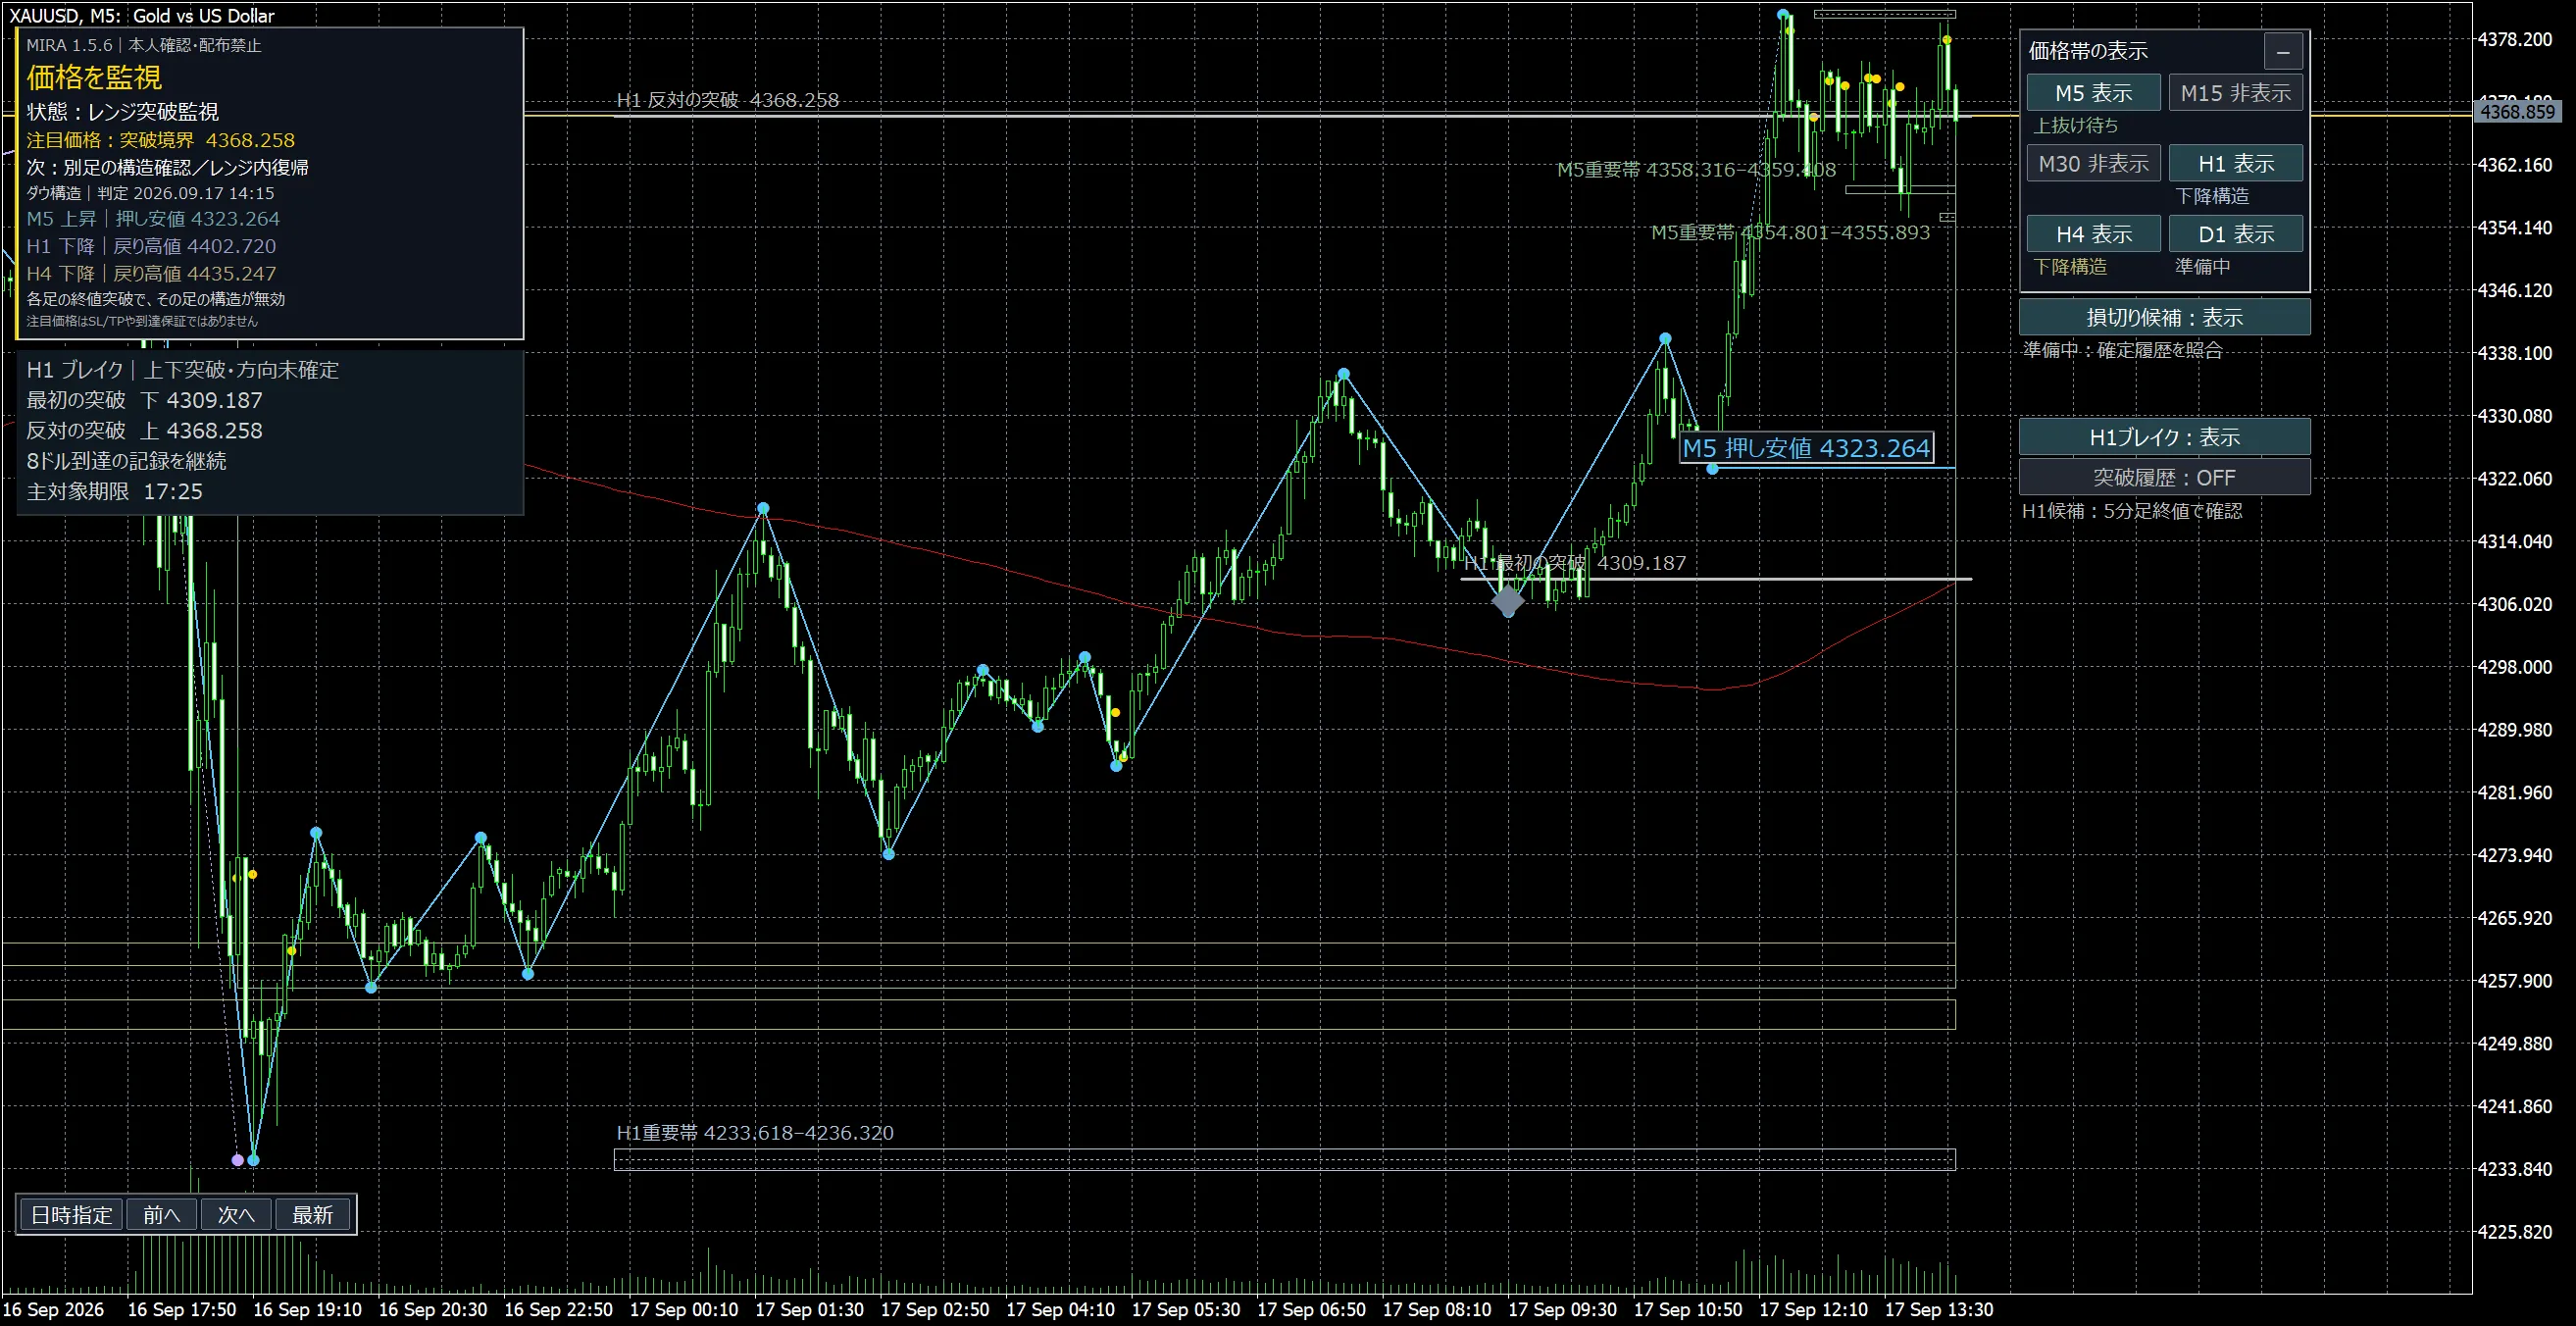
Figure 1 | M5 overall. Monitoring rising structure and range breakout, and the higher-timeframe state on the same screen (as of 14:15 on Sept 17). Click the image to enlarge.
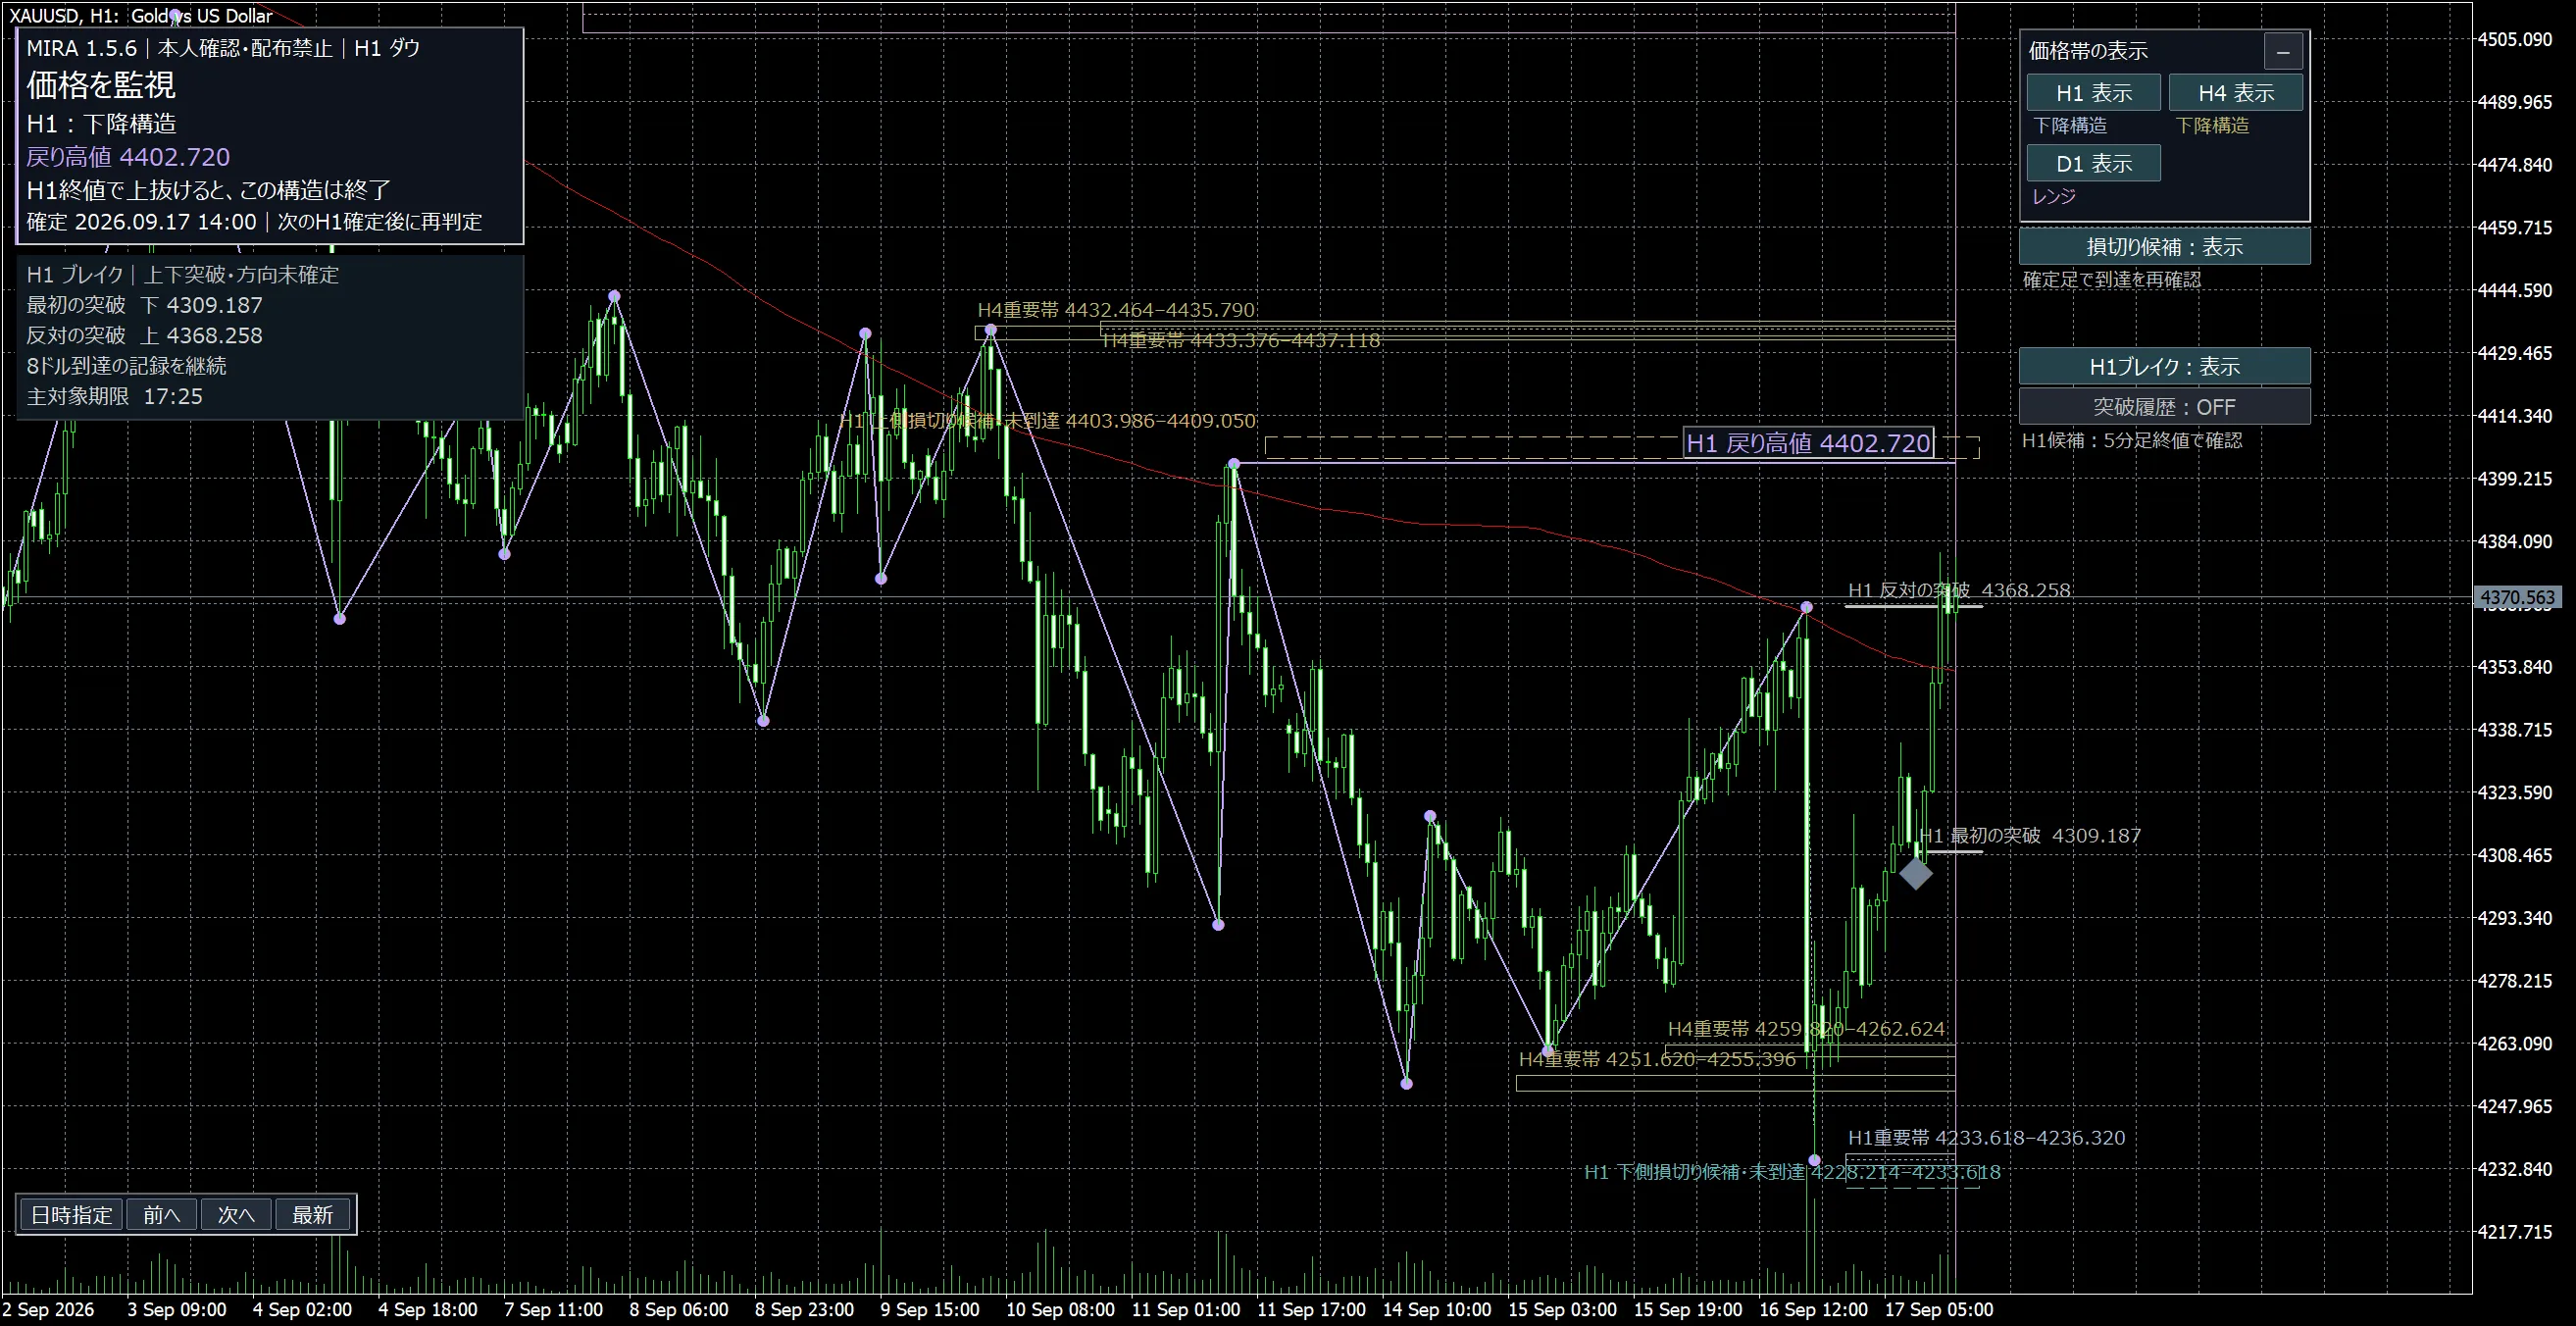
Figure 2 | H1. Confirm the descending structure’s retracement high 4402.720 and important zones on H1/H4. Click the image to enlarge.
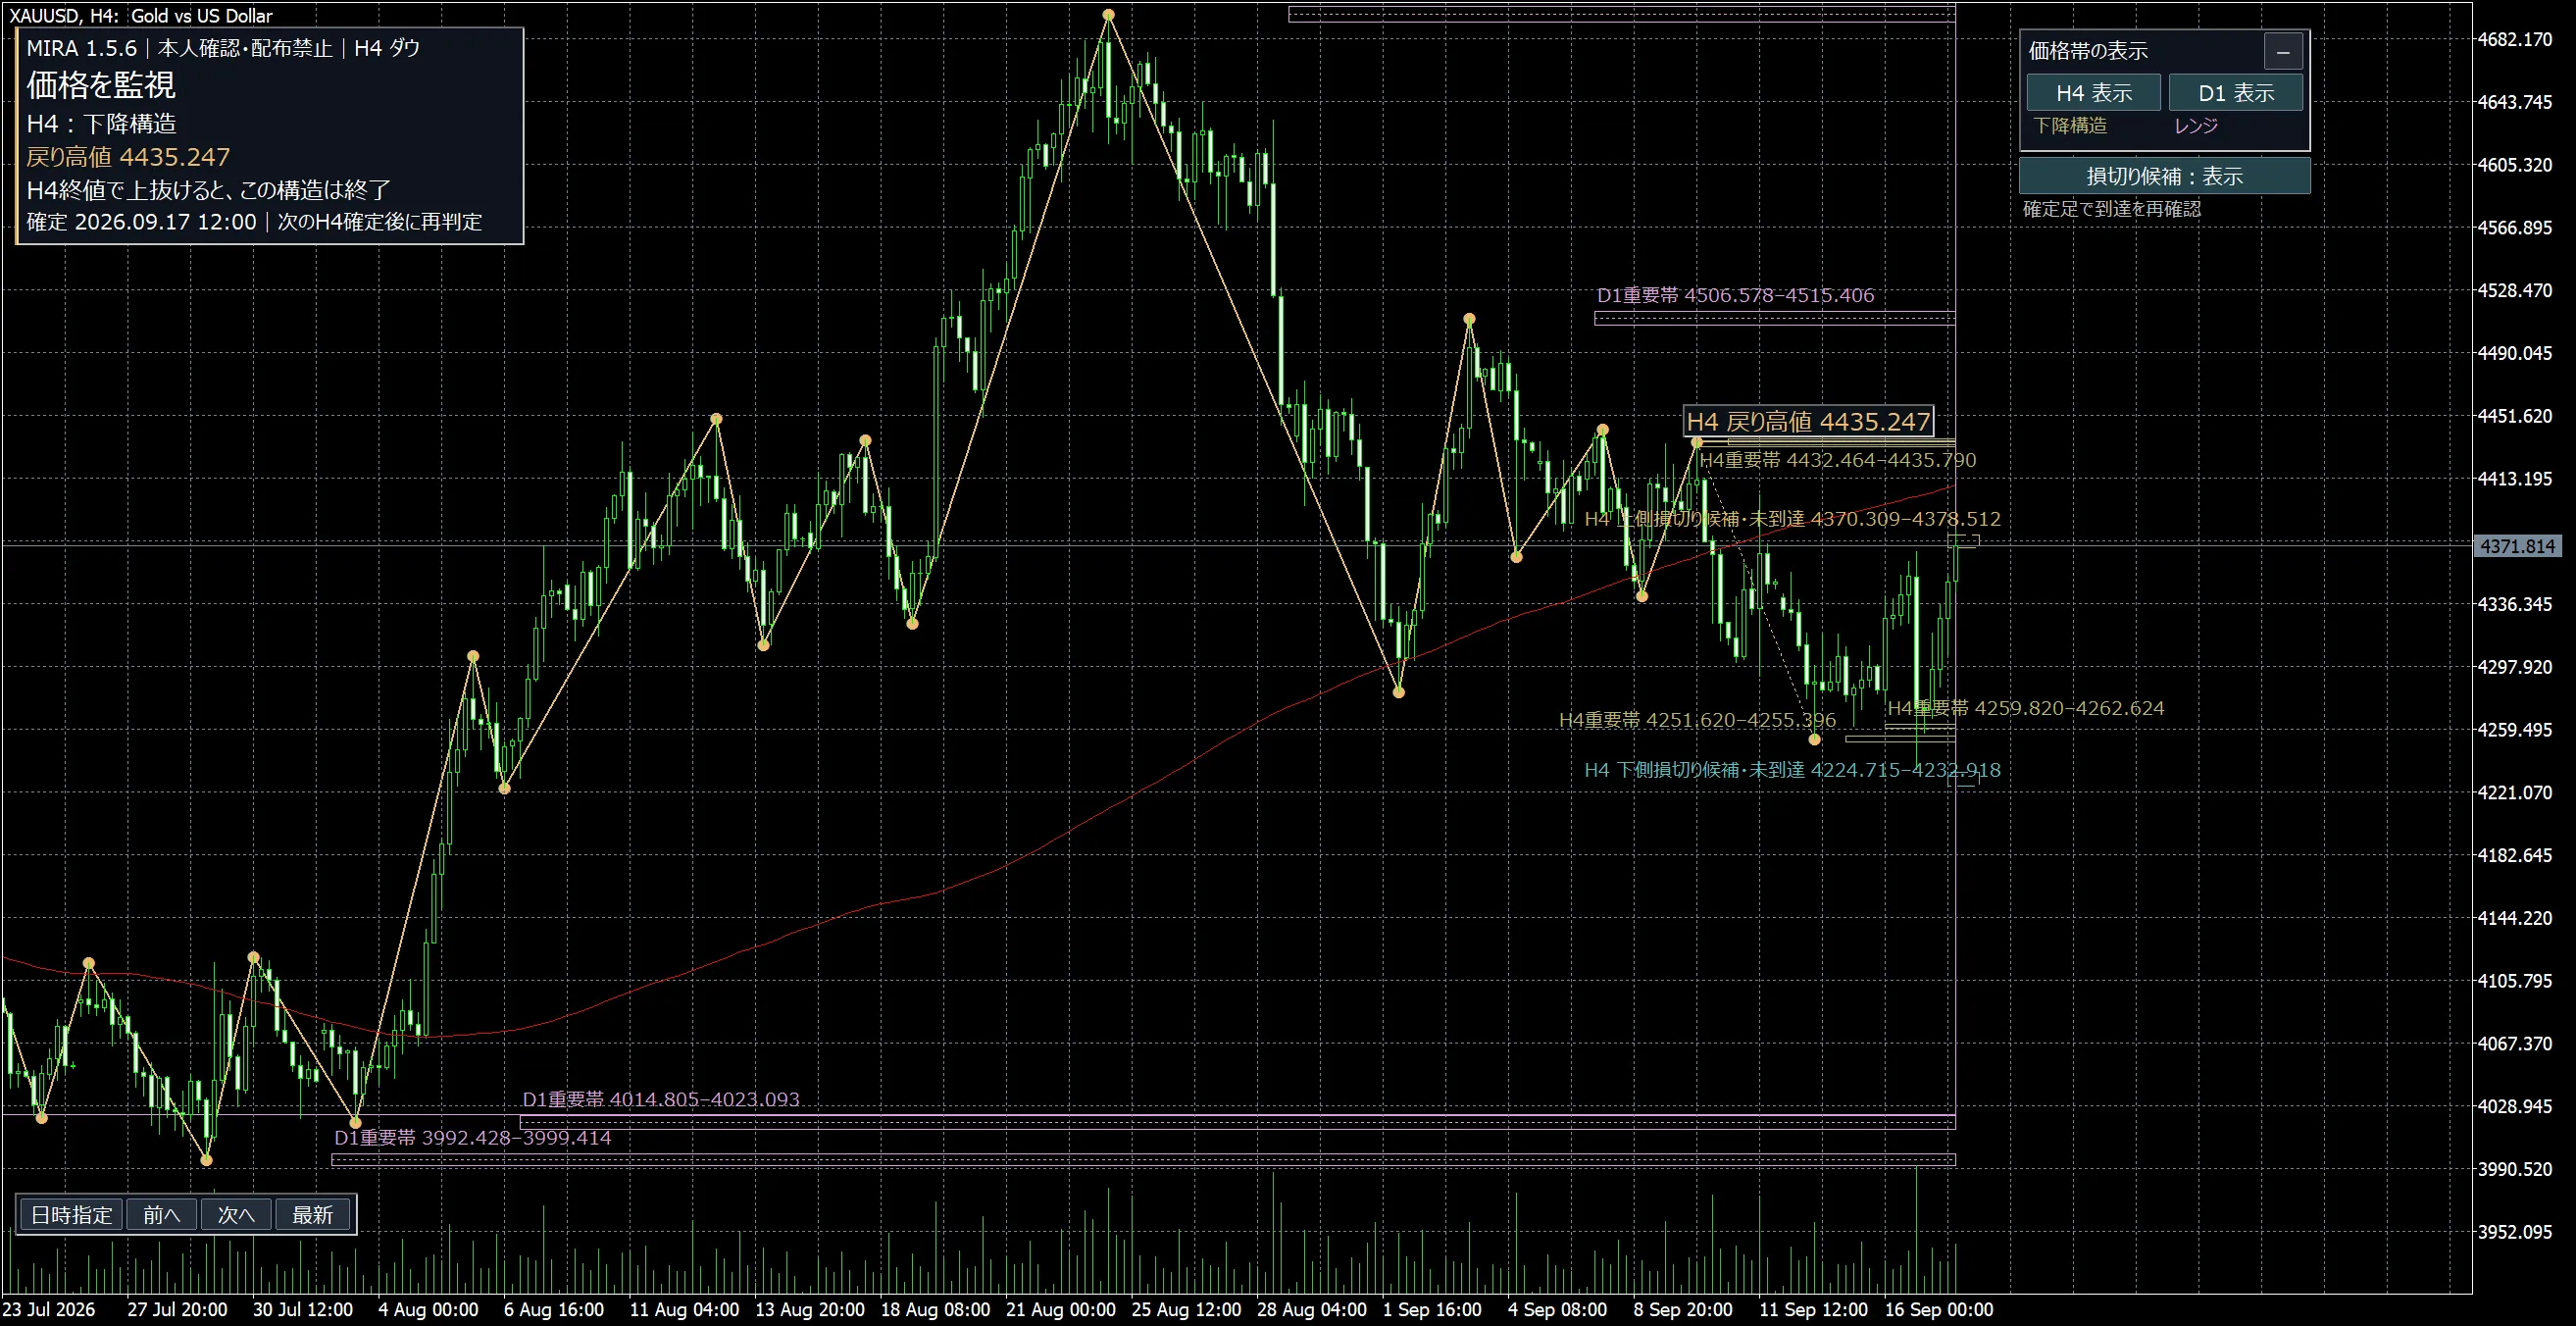
Figure 3 | H4. Display retracement high 4435.247, important zones on H4/D1, and the upper and lower stop-loss candidate bands. Click the image to enlarge.
Habits to avoid:Only looking at timeframes convenient to your position. First check the higher timeframe, then the shorter timeframe used for entry.
2. Don’t jump on “It still has room to run” — important price bands and liquidity candidates
MIRA draws important price bands derived from price structure on the chart. By overlaying bands for each timeframe, you can verify whether short-term moves are approaching higher-timeframe bands or if multiple justifications coincide.
Prices and bands related to liquidity are candidates derived from price structures such as past highs and lows. It does not fetch actual order books or someone’s order sizes.
Habits to avoid:After entering, noticing the next important band and chasing it. Before chasing, check your current position relative to the next band.
3. Don’t treat “just momentarily broke through” as confirmed — range and breakout monitoring
In a range, it shows the boundaries and distinguishes the movement that breaks the boundary from subsequent structure confirmation. Reaching an important band, waiting for breakout to stabilize, confirmation, false breakout, waiting for a new structure, etc., are also materials for judgment and history reading.
The main panel’s “Range Breakout Monitoring” does not immediately decide to buy or sell. It reads the next confirmation conditions, such as confirming with a different timeframe’s structure or returning to the range.
In Figure 1, even though the M5 shows an upward structure, the main panel displays “monitor price” and “range breakout monitoring.” You can verify “direction” and “what to do now” on the same screen separately.
Habits to avoid:Assuming a break is confirmed by the wicks of an active candle. This display exists to prevent hasty judgments until the candle in question is confirmed.
4. Don’t enter to recover losses — main panel standby, monitoring, and consideration
The main decision panel and the M5 upward pressure target the five-minute chart. The main panel for the five-minute chart summarizes the current state, focused price, its role, and the next confirmation conditions. It switches between waiting for pullbacks or retracements, monitoring prices, considering buying or selling, and pausing or rechecking based on structure and conditions.
Rather than reading numbers alone, read what price it is and what you are waiting for. The focused price is not the order price, stop loss, or take profit itself.
Habits to avoid:Searching for justification aligned with your desire to trade. When the panel shows standby, articulate the next confirmation conditions first in words.
5. Don’t keep selling after a decline — rebound vigilance and short-term rise
To verify short-term structure after a sharp drop, it can display ① rebound vigilance, ② signs of short-term rise, Japanese explanations, short-term confirmed waveforms, and short-term pullback lines. It separates vigilance phases from subsequently confirmed short-term structures for observation.
As another feature, there is “M5 Upward Pressure” that detects strong M5 rise during H1 downtrends. It shows a mark of the detection position and a short-term pullback low to monitor.
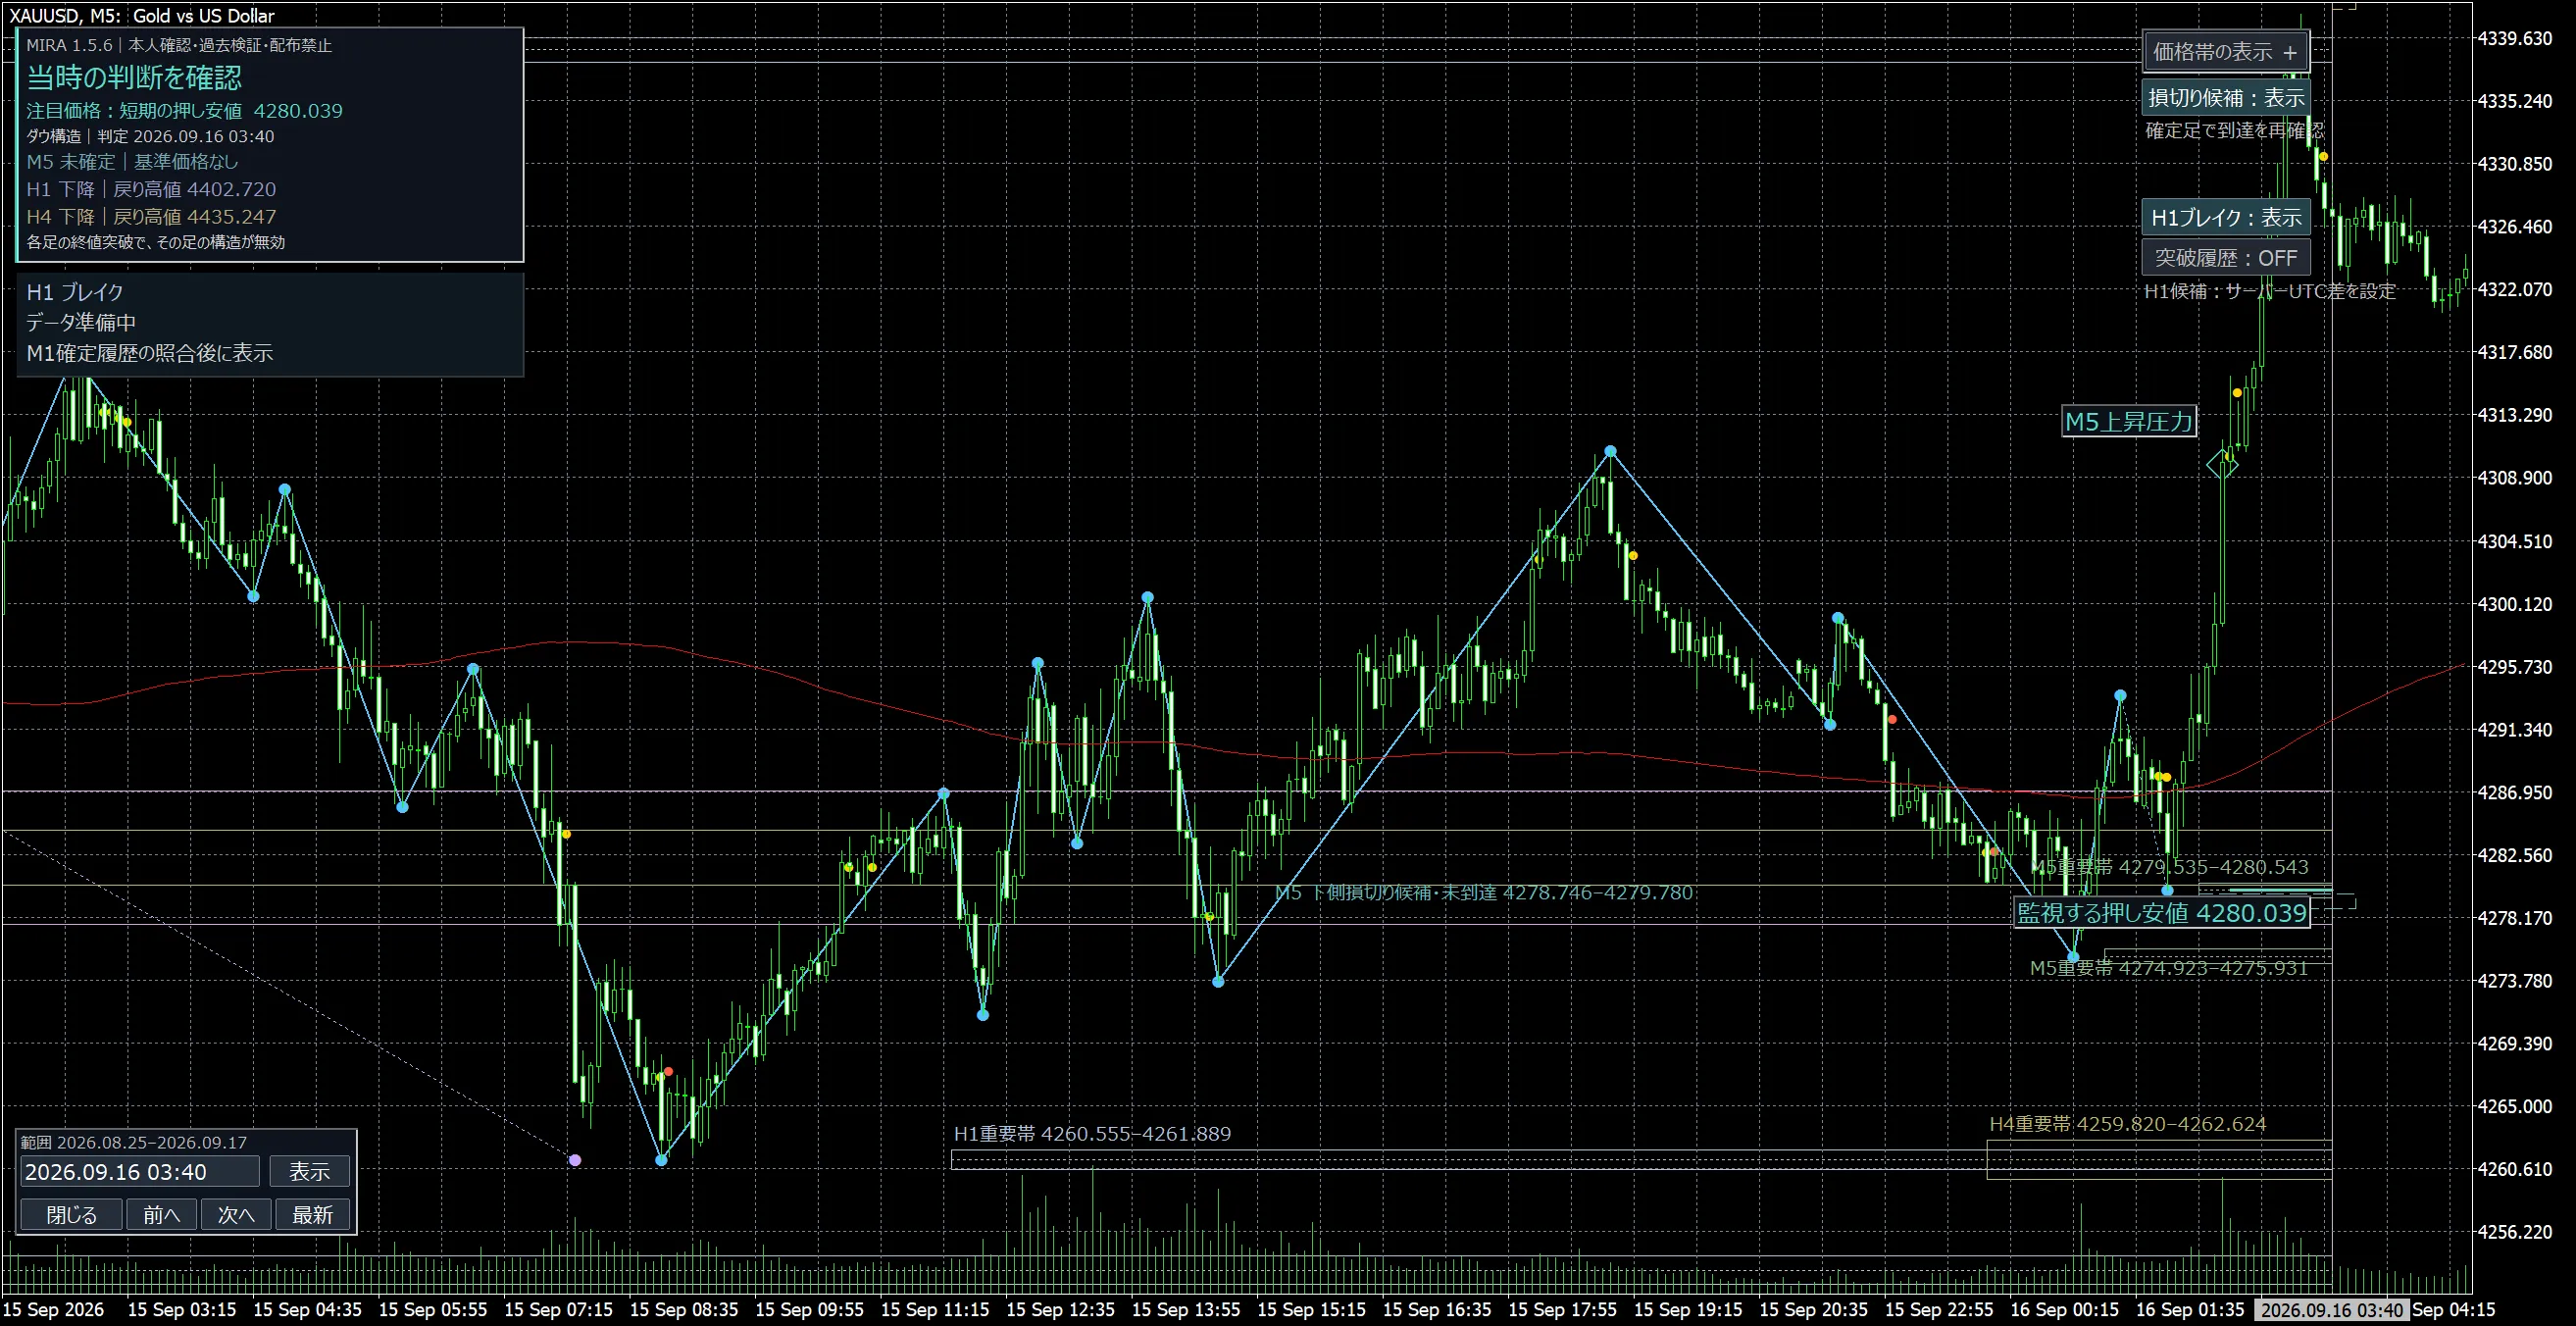
Figure 4 | Past-specified at 03:40 on Sept 16. M5 upward pressure and the monitored short-term pullback low 4280.039. Click the image to enlarge.
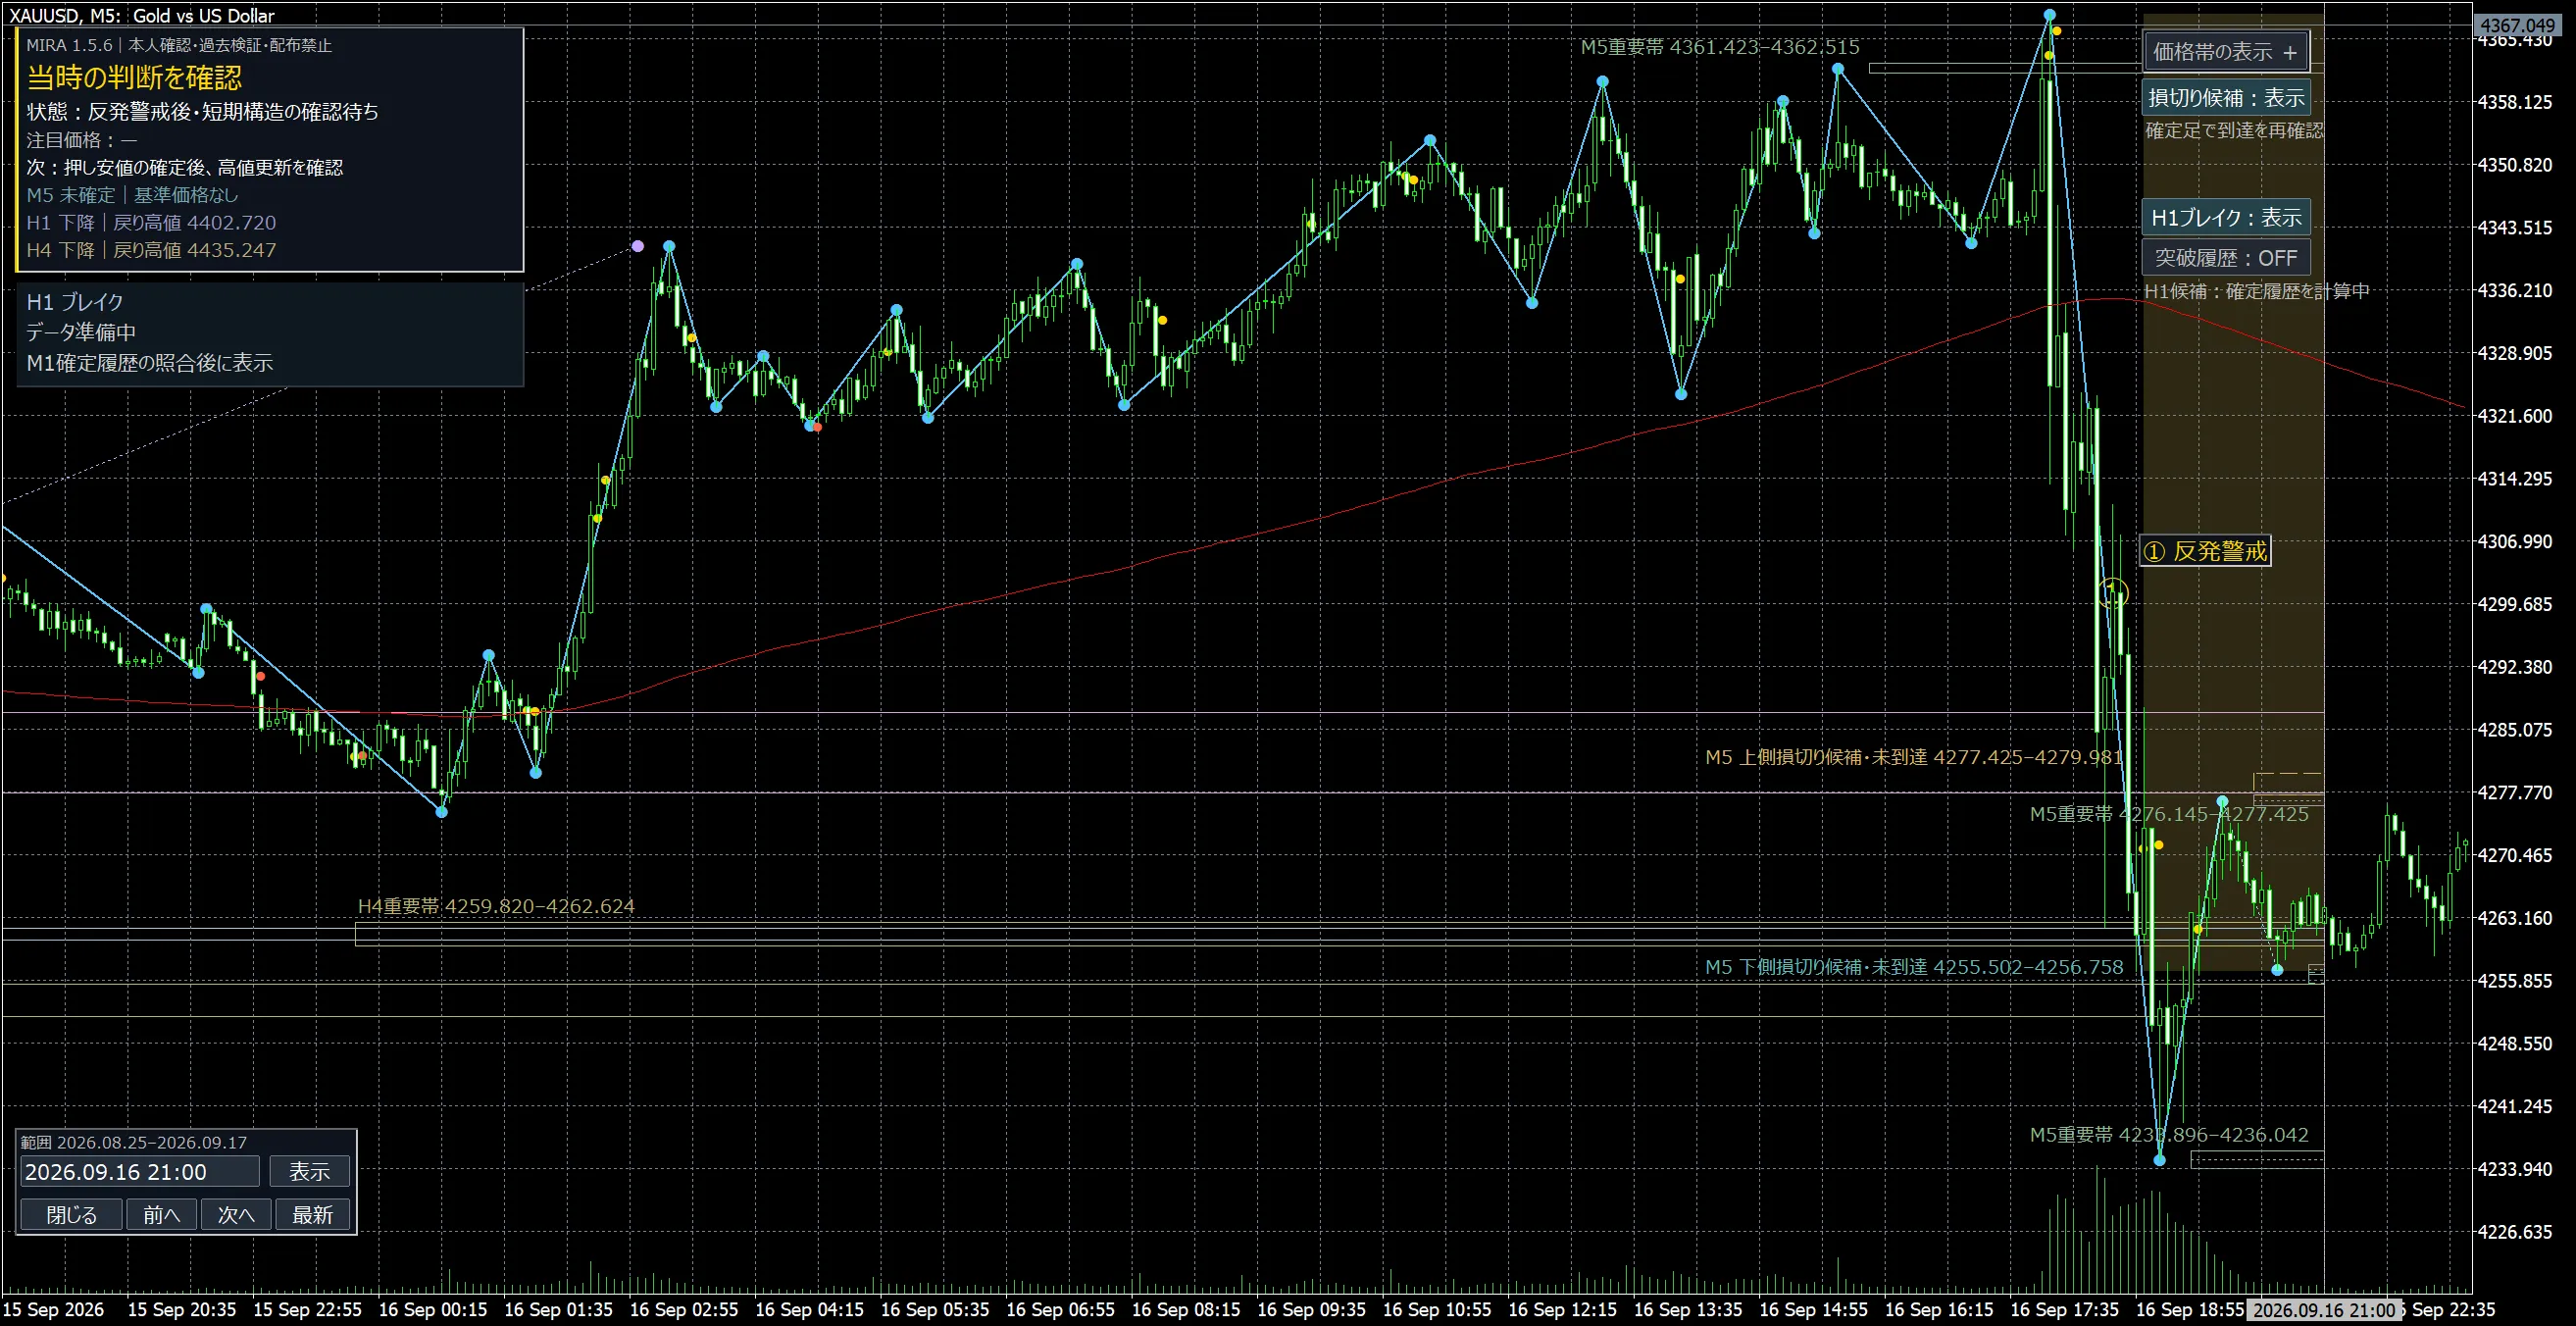
Figure 5 | Past-specified at 21:00 on Sept 16. A scenario where the price continued to fall even after a rebound vigilance. Click the image to enlarge.
Figure 5’s ① is vigilance before an upward confirmation. In this moment, even after the vigilance mark, the price falls. It’s important not to read “buy because ① appeared.”
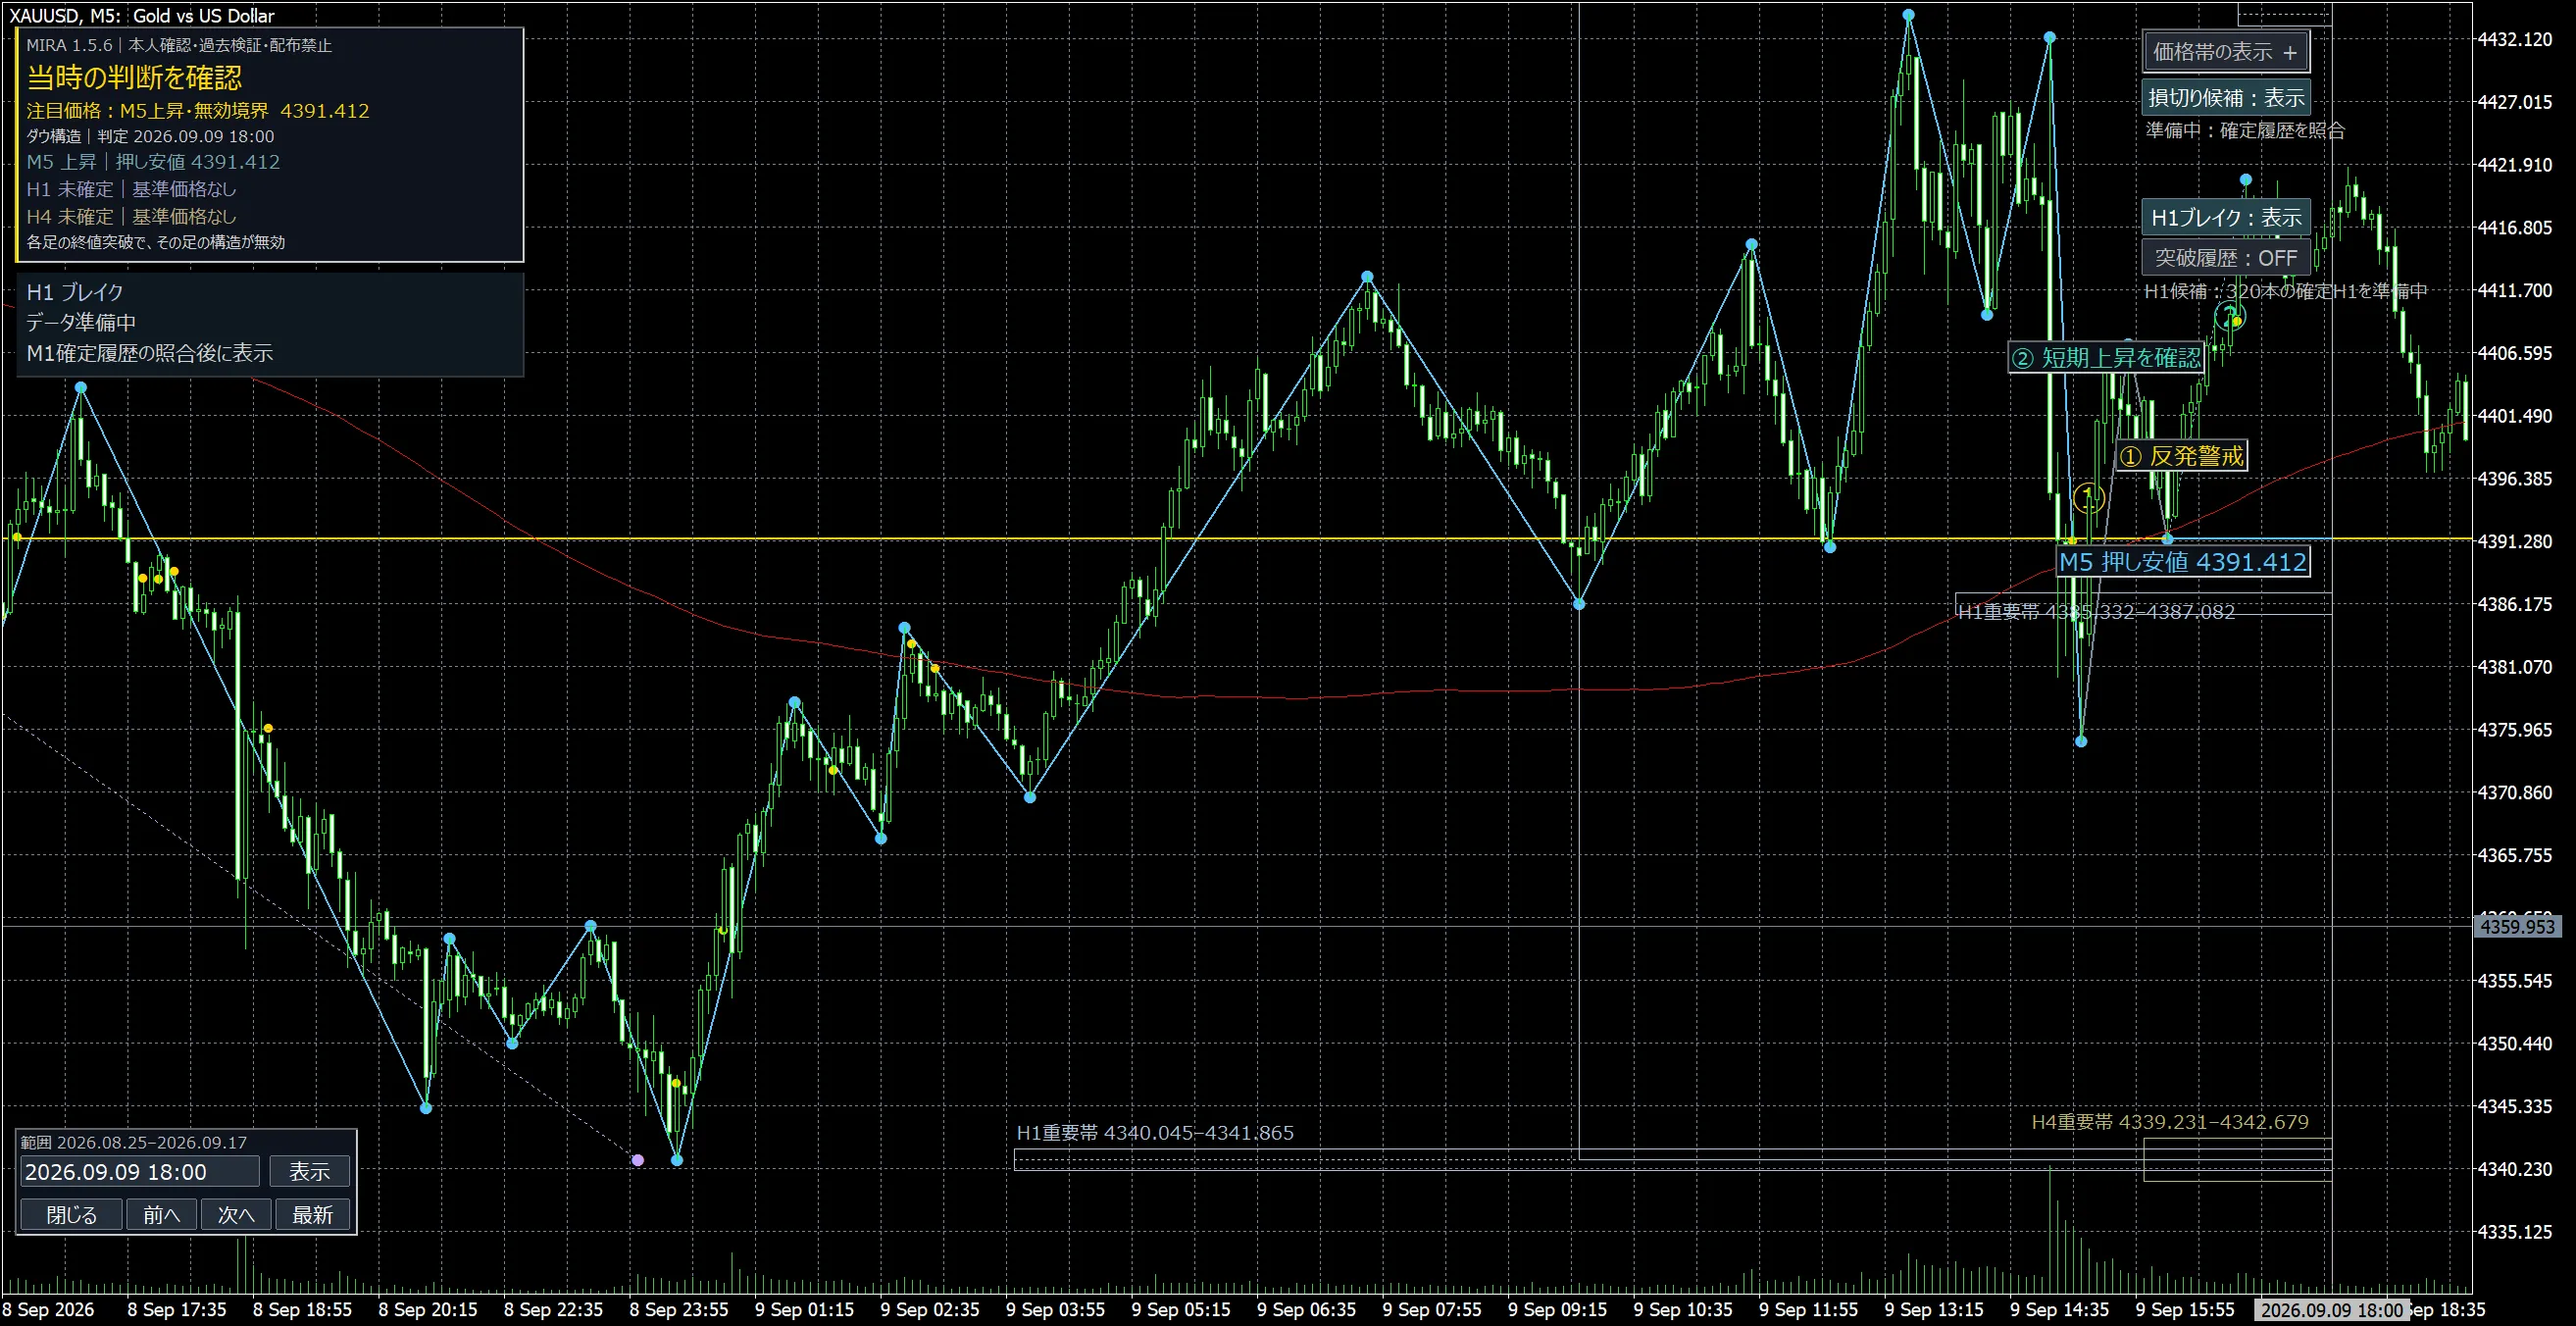
Figure 6 | Past-specified at 18:00 on Sept 9. ① rebound vigilance, ② short-term rise, verified M5 pullback low 4391.412. Click the image to enlarge.
Figure 6 is another moment specified on Sept 9 at 18:00. In addition to ①, you can confirm ② short-term rise, and M5 pullback low 4391.412 is displayed. These are materials for confirming the structure; they do not record orders or profits at that moment.
6. Be aware of places where stops are likely to cluster — stop-loss candidate bands
“Stop-loss candidates” do not auto-set stops for your orders. It estimates and shows locations where price structure may accumulate stops, such as above high prices or below low prices.
Check unseen candidates above and below, and examine nearby candidates or overlaps. You can configure whether to include just a single high/low or to narrow down when multiple nearby extremes exist.
In Figure 3, H4 shows upper and lower unreached stop-loss candidate bands and important bands on H4 and D1. Read candidate bands and important bands by separate roles.
Habits to avoid:Entering without knowing a position where momentum might accelerate, based only on the immediate surge. Candidate bands are observation materials and do not guarantee actual stop orders or attainment/reversal.
7. Do not blur what happens after breakout — track H1 breakout candidates and progress
It shows H1 breakouts up and down and confirms on the M5 close. After confirmation, it displays the breakout price, target price, deadline, and attainment status, and it can switch to review past breakout history.
What you track is whether, within eight hours of the candidate’s issuance, the M5 close reached eight dollars away from the line. Returning to the line does not cancel previously recorded attainment. If path data is insufficient, the judgment is held.
In Figures 1 and 7, the initial downward breakout and the opposite upward breakout occur within the same tracking period, and it is labeled “bothway breakouts — direction undecided.” You can ensure not to emphasize only one direction when breakouts occur in both directions.
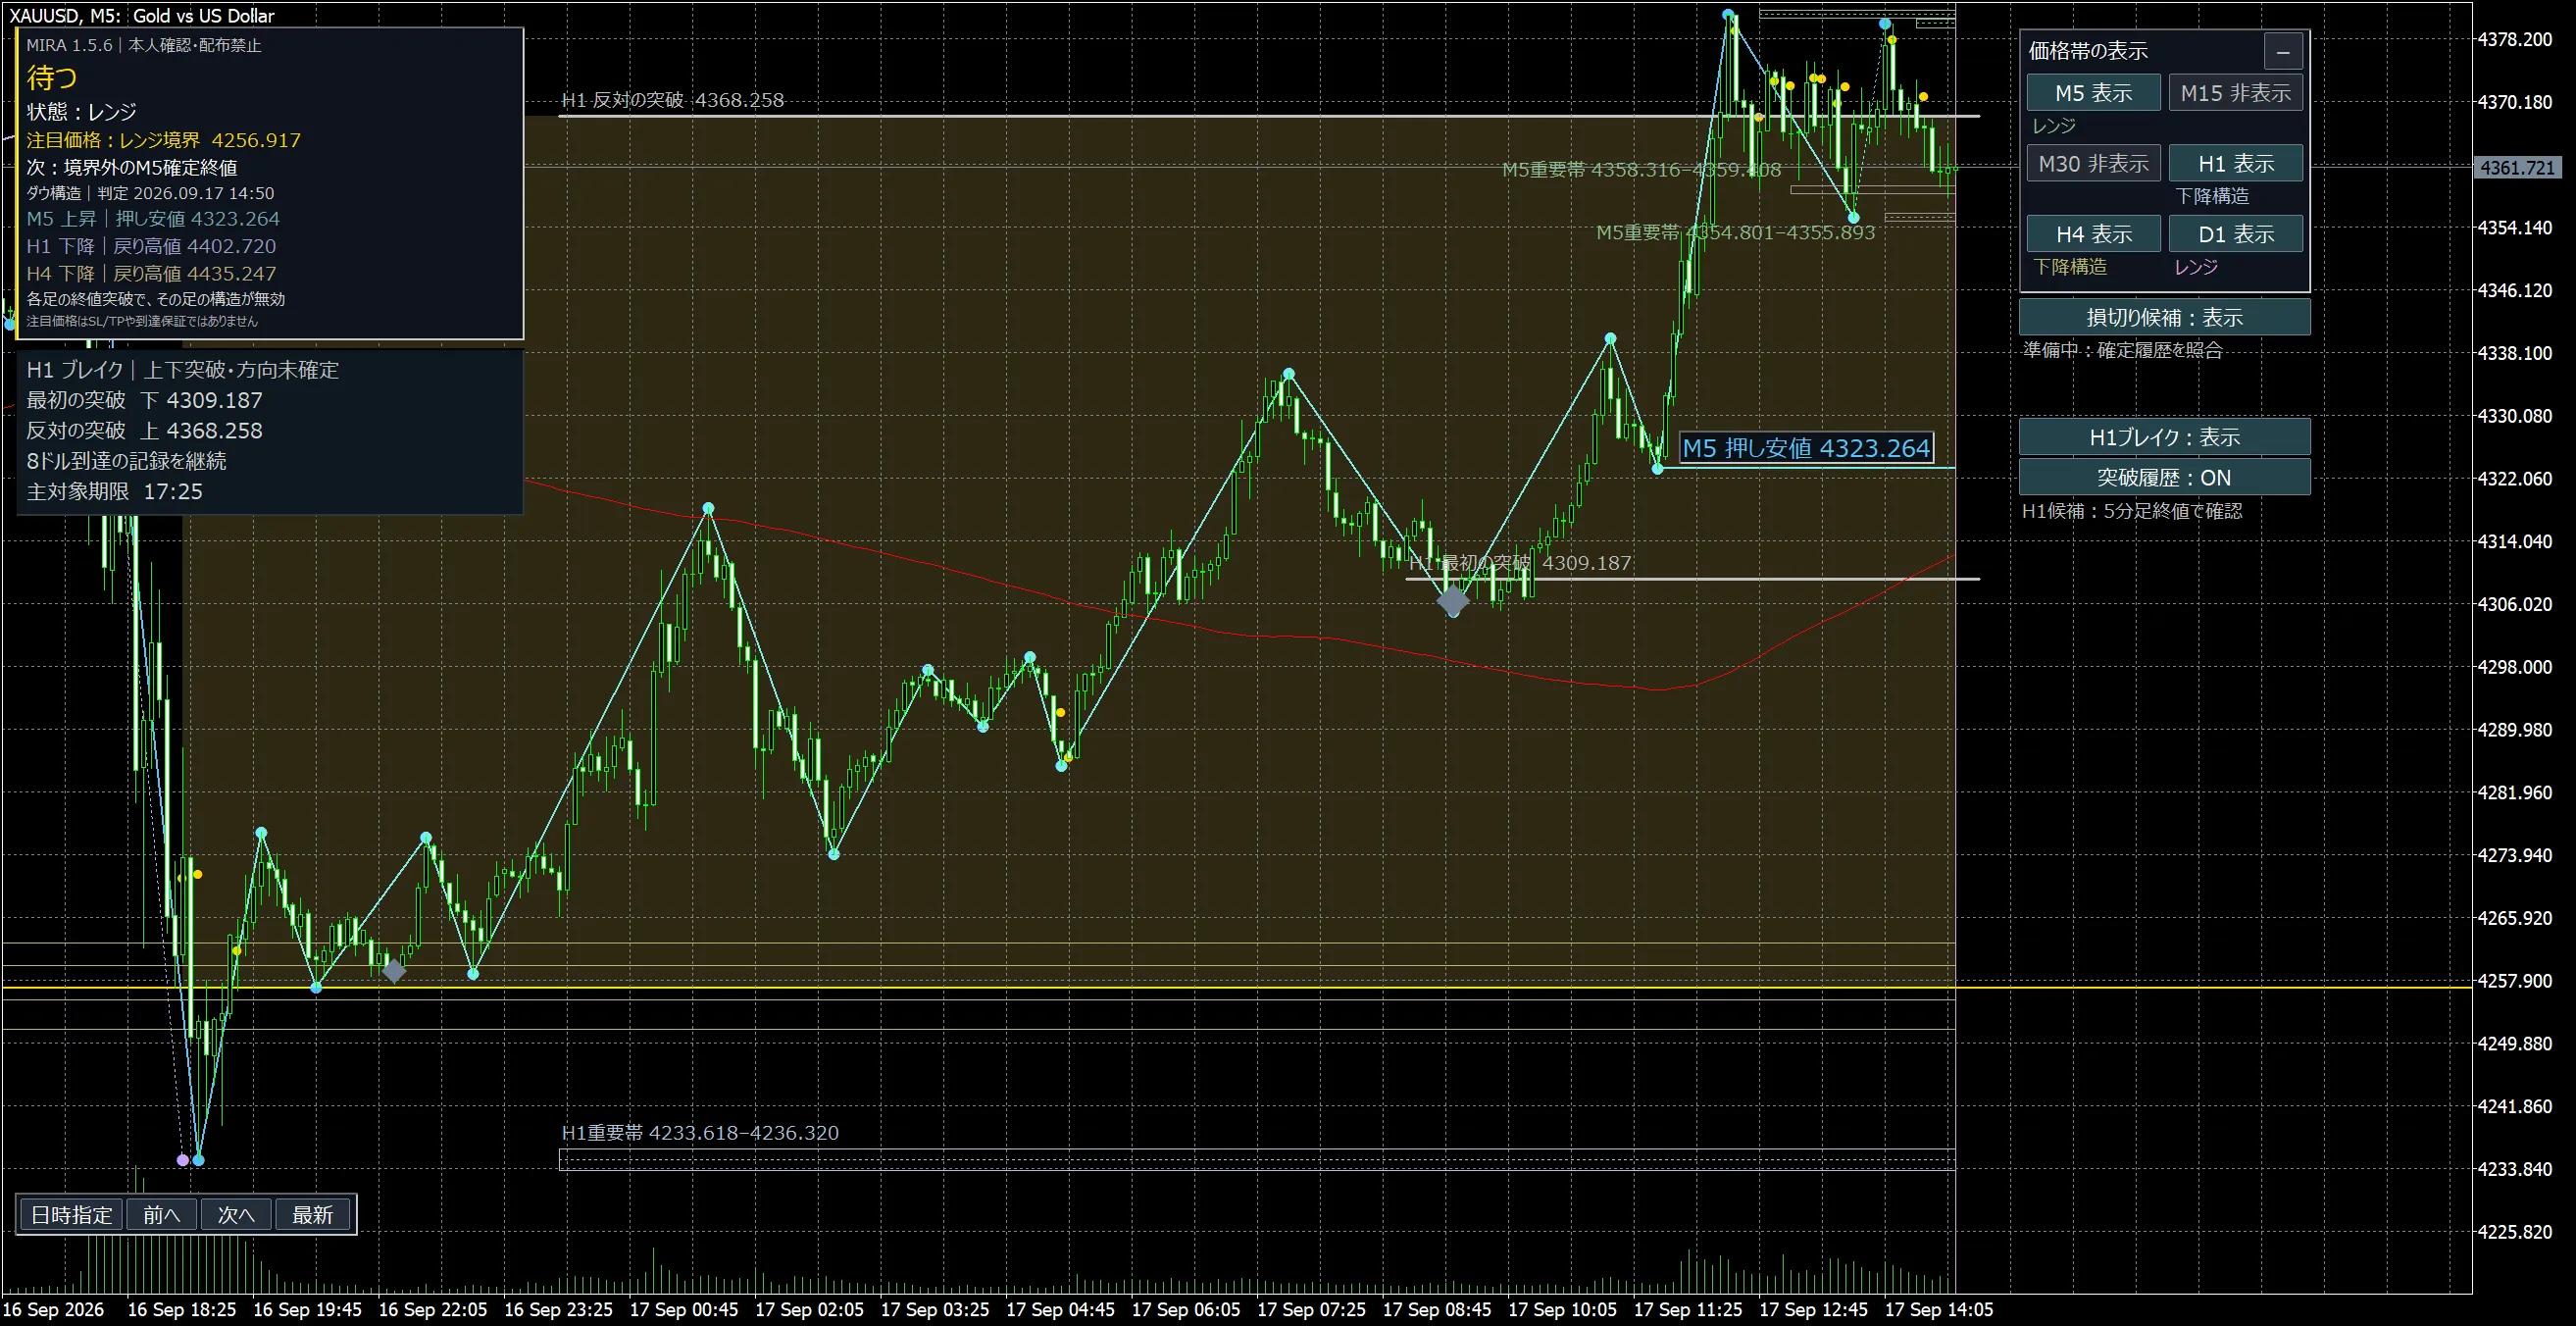
Figure 7 | As of 14:50 on Sept 17. Range, H1 up/down breakouts, direction undecided, and past breakout history in gray. Click the image to enlarge.
In Figure 7, the range is shaded and past breakthroughs are shown with gray markers. Read past records and current direction information separately.
About the “Breakout Probability” field:Currently, because calibration verification is not yet complete, numeric probability values are not displayed. It shows states such as “awaiting verification” or “achieved.” It does not mean you can reliably take eight dollars at high probability. Also, achieving eight dollars is a tracking criterion for the feature, not actual order entry or account P/L.
8. Don’t forget losses — date/time specified and reviewing past
In the bottom of the chart, you can review saved past decisions using “Date/Time Specified,” “Previous,” “Next,” and “Latest.” History of important bands and past breakout displays are materials for review. Please note the broker server time for the target times.
For past H1 breakout confirmations, you need to specify the difference between server time and UTC. This time I checked the Ex〇〇〇 timestamp at capture and referred to UTC+0. Some candles after the specified time may appear on screen, so read it separately from the panel’s reference date/time.
What you want is not only the places where it was correct. If you also line up the moments when waiting continued, when conditions collapsed, and when you skipped, you can identify parts where you over-predicted.
Past chart displays are not evidence of the delivery time or actual orders/profits at that time. Do not select only the favorable moments later and misinterpret performance.
9. Do not overload with information — display switching, readability, and setting retention
You can select necessary bands and ranges with the time-frame price-band display buttons. You can adjust separately from the Dow wave display, and toggle the display of stop-loss candidates, H1 break, and breakout history. The panel can also be collapsed.
You can set colors and thicknesses of waveforms and reference lines, the size of confirmed highs/lows, annotation text, marks for rebounds and upward pressure, and short-term waves. It retains display choices when switching timeframes, letting you arrange the screen to match your confirmation order.
Habits to avoid:Displaying everything and selecting only the convenient lines. Decide your viewing goal — higher-timeframe structure, nearby bands, and short-term confirmation conditions — and narrow the display accordingly.
10. Even when data isn’t complete, show the reasoning
If you need to obtain confirmed bars, synchronize multiple timeframes, or reconstruct history, it will show “Data preparing” or “Awaiting confirmation.” Do not read this as a buy/sell decision; wait for the necessary data and confirmations to align.
Use requires Windows MT5 and compatible GOLD symbol/history data. For the sales version, check the product page and included manual for authentication and installation requirements.
MIRA is not an automated trading EA. You decide orders, lot sizes, stops, take profits, and maximum drawdown. It only displays panels and candidate bands and does not manage funds on your behalf.
Ongoing improvements: separating higher-timeframe confirmations from short-term scenarios
From here, this is not a promise of the sold version, but an introduction to improvements implemented in the 1.5.8 identity-verification edition.
What was reconsidered this time is the scene where “H1 is descending, so I keep waiting for new retracement sales.” We still confirm higher-timeframe structure, but if a strong M5 rise is detected, the selling scenario is restrained and we wait for a new short-term structure.
Detect strong short-term rise → wait for new pullback formation → monitor confirmed pullback low → consider buying after further condition checks.If the pullback low breaks or the conditions expire, the direction is re-decided. It is not designed to automatically revert to the previous selling direction.
State saving/restoration is supported; if it cannot be restored, it waits for a new structure from a neutral state. The minimum number of history records, time-frame switching handling, history color, and edition display have been revised. The code validation and compilation are complete, but this does not imply full testing of all conditions in the sold version on actual MT5. Do not treat the 1.5.6 screenshots as proof of the new logic’s operation.
Three questions to answer before the next trade
- What price and structure are you waiting for right now?
- Which time frame, and what needs to be confirmed before considering?
- What would cause you to skip?
If you cannot answer three questions, you may opt to skip the trade once. Instead of chasing the price range you missed, leave some capital and calm to use for the next decision. Place these confirmations on the MIRA chart above.
MIRA’s features, supported environment, and the current edition are listed on the product page below.
※This article introduces the features. The Ex〇〇〇 images are display examples and do not encourage deposits with a specific broker or buying/selling at a specific price. It does not guarantee loss avoidance, win rate, or profitability through decision support.