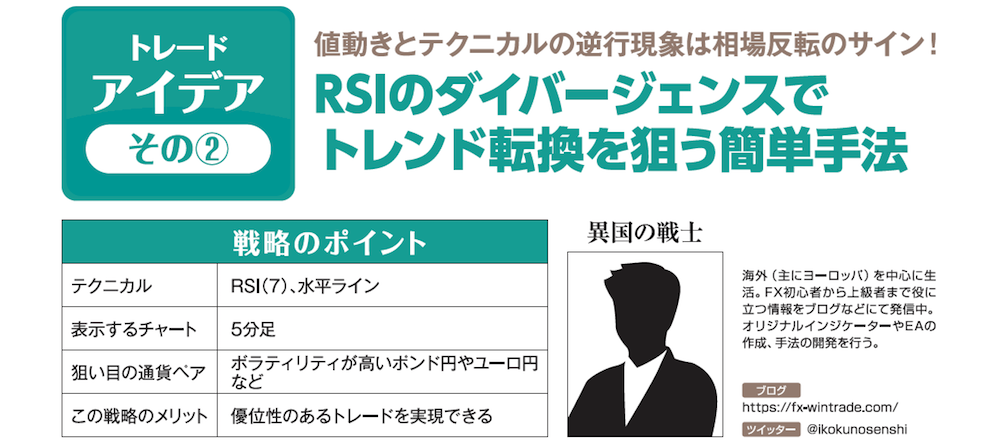
[Anyone Can Understand Buy Signal] The contrarian phenomena between price movement and technical indicators are signs of a market reversal! A simple method to catch a trend reversal using RSI divergence [Warrior of a Foreign Land]
Profile of a Foreign Warrior

Lives mainly overseas (centered in Europe). Shares information useful for both FX beginners and advanced traders on blogs, etc. Creates original indicators and EAs, and develops trading methods.
Blog:https://fx-wintrade.com/
Twitter:https://twitter.com/ikokunosenshi
※ This article is a reprint and reedit of FX攻略.com July 2019 issue. Please note that the market information written in the main text may differ from the current market.
Strategy Points
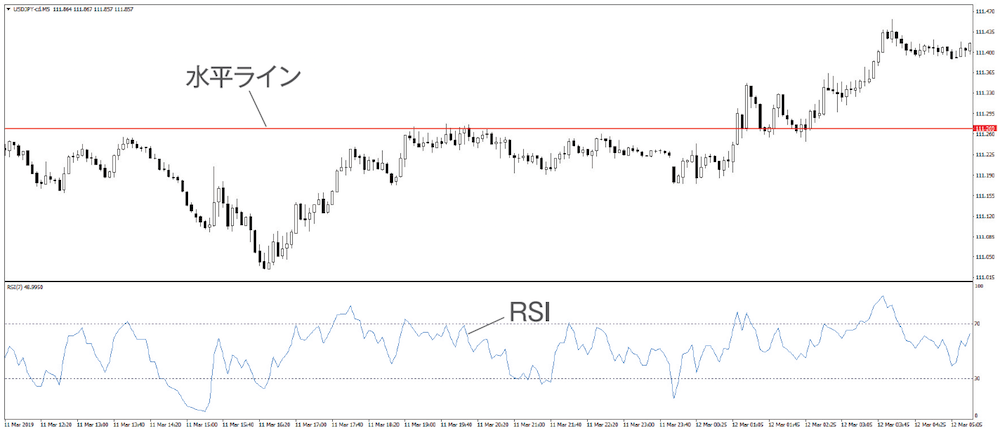
- Technical: RSI (7), horizontal lines
- Trading time frame: 5-minute chart
- Target currency pairs: high-volatility pairs such as GBP/JPY or EUR/JPY
- Advantage of this strategy: enables trades with edge
Increase Certainty with Divergence + role reversal
New
- After a bullish divergence between price and RSI, draw a horizontal line at the area where price is stalling
- Enter when price breaks above the horizontal line and then retraces
Exit
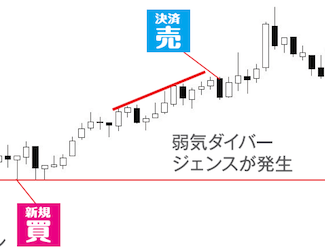
- Take profits when a bearish divergence occurs
- Place a stop-loss around the most recent low
※ The “Strategy Points” and main text assume a long (bullish) scenario in an uptrend. In a downtrend with shorts, the rules are the opposite.