
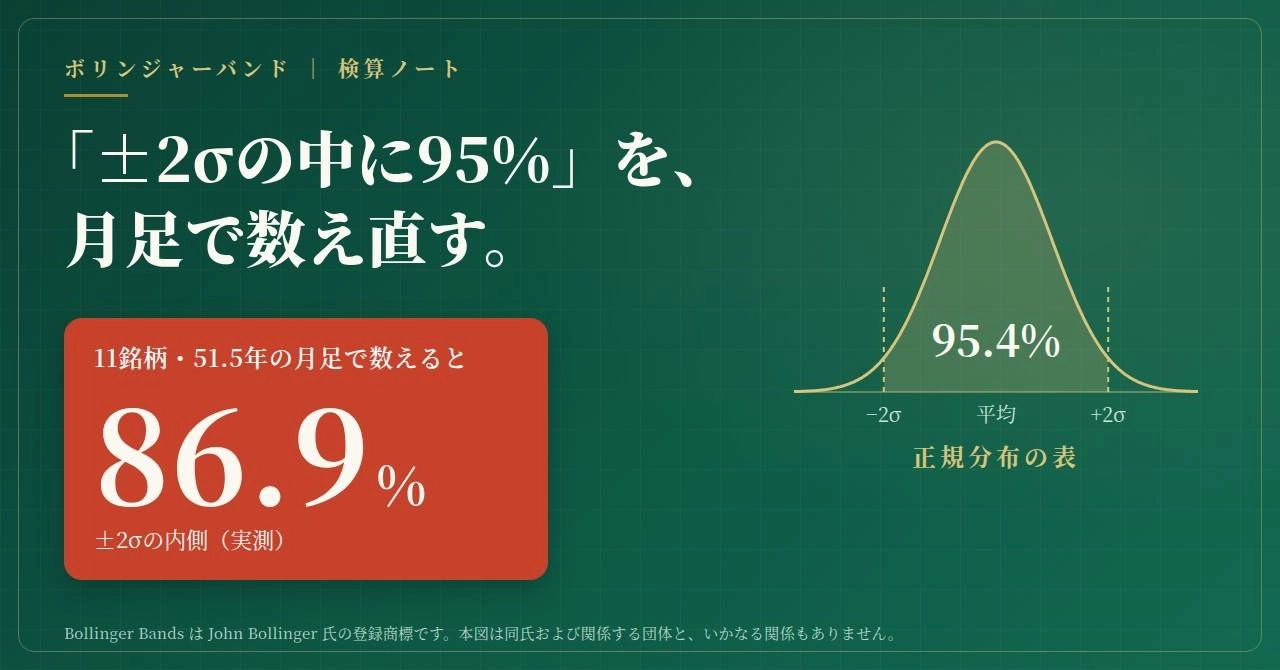
The Bollinger Bands ±2σ, the inner area was about 90%── Recounted over 11 stocks and 618 months of monthly data
are numbers from the normal distribution table.
In the description of Bollinger Bands, there is a commonly seen sentence: "About 95% of prices fall within the band of ±2σ."
In this article, we recount that 95% using 11 assets over 51.5 years of monthly data. One thing is clear: inside ±2σ comprises about 90%.
A reading that limits the basis to three sources: ① the person who created Bollinger Bands discloses the rules; ② published papers and statistical/mathematical theorems; ③ our actual measurements.
The table’s calculations are correct. Most of the discrepancy arises from the table’s assumptions (fixed mean) and the band on the chart (a mean that tracks prices).
Reading months ending outside the band as “rare anomalies” pertains to the table. In actual monthly data, 13.1 out of 100 months ended outside the band, i.e., about 1.6 times per asset per year.
01Results of counting
(Inside 83.1%–89.5%)
“Outside the band” means the monthly close was outside the band calculated using the 20 most recent months. Months ending outside the band were nearly three times as many as in the table.
| Band width | Normal distribution | Actual |
|---|---|---|
| ±1σ | 68.3% | 41.0% |
| ±2σ | 95.4% | 86.9% |
| ±2.5σ | 98.8% | 96.6% |
| ±3σ | 99.7% | 99.5% |
Months ending outside the band by ±3σ also existed, about 0.5 per 100, which, according to the table, would be 0.3. The width that yields exactly 95% in the table is ±1.96σ, and ±2σ yields 95.4%.
| Setting | Inside |
|---|---|
| Period 20, divide by n | 86.9% |
| Period 20, divide by n−1 | 88.6% |
| Period 12, divide by n | 89.9% |
| Period 12, divide by n−1 | 92.3% |
STDEV.S in spreadsheet software uses division by n−1, which slightly widens the band, raising the inside percentage. Shorter periods also raise it. Since a shorter band gives more weight to the month’s closing price, the band pulls toward that close. Among 44 combinations of four settings and 11 assets, the highest was 93.4%. No combination reached 95%.
Even if standard deviation is used in band calculation, keep the statistical premises aside. Price distribution differs from the normal distribution, and often the number of data points used for the band is too small to be meaningful as a statistic. In practice, about 90% falls inside the initial band.
Actual measurements in this article also lie in that approximate 90% area.
Data: 11 assets (forex pairs, gold, US stock indices), monthly data across 618 months (Mar 1975–Aug 2026; for US indices and gold, 617 months excluding the last month). Number of asset-month combinations: 6,796. The band is defined as the trailing 20-month simple moving average ± 2 × standard deviation; the standard deviation is divided by n (same formula as MT4/MT5 official help).
02What form produces a 95% difference
The ±2σ band is two standard deviations wide from the mean. The 95.4% in the table is the proportion of values that lie within this width when distributions are normal and centered around a fixed mean.
A 20-period simple moving average is a line reflecting the center of 20 bars, roughly the movement about 9.5 bars ago. Placing it at the most recent bar makes the mean lag behind price. When price moves in one direction, the price tends to be drawn toward the band edge. In actual measurements, months near the center of the band (inside ±1σ) were 41.0%, well below the 68.3% in the table.
Points being higher than the table is because the last point of the window is included in the mean and standard deviation calculations. The distribution remains the same; only the shape difference reduces by 7.6 points.
The count outside ±3σ reveals another property. If you measure one month’s price movement (change from previous month) using the asset’s 51.5-year mean and standard deviation with a different metric, months more than 3σ away occur 1.16% in real data and 0.27% in normal distribution. About 4.3 times as thick in tails, for all 11 assets (excess kurtosis is positive).
A month following a big move tends to be followed by another big move. The one-month lag correlation between price movement and the next month for all 11 assets is positive (0.07–0.20).
From the band perspective, in the random walk of the moving line, outside ±3σ occurs in 0.3 per 100 for real data, same as the table’s level. Real measurements were 0.5. The discrepancy outside ±2σ is mainly due to the second pattern (mean lag), while the excess in tails beyond ±3σ is mainly due to tail thickness.
03Limitations to state up front
04Verify on your own screen
At 100 bars, a few bars per asset will be outside. This is a way to see which of the two numbers it is closer to.