

The day GOLD's rebound stopped at a key price. Organizing the "place to wait for selling" in MIRA | September 14
In such moments, a standard like“how far back does the price need to retrace before we consider selling?”helps you make a decision.
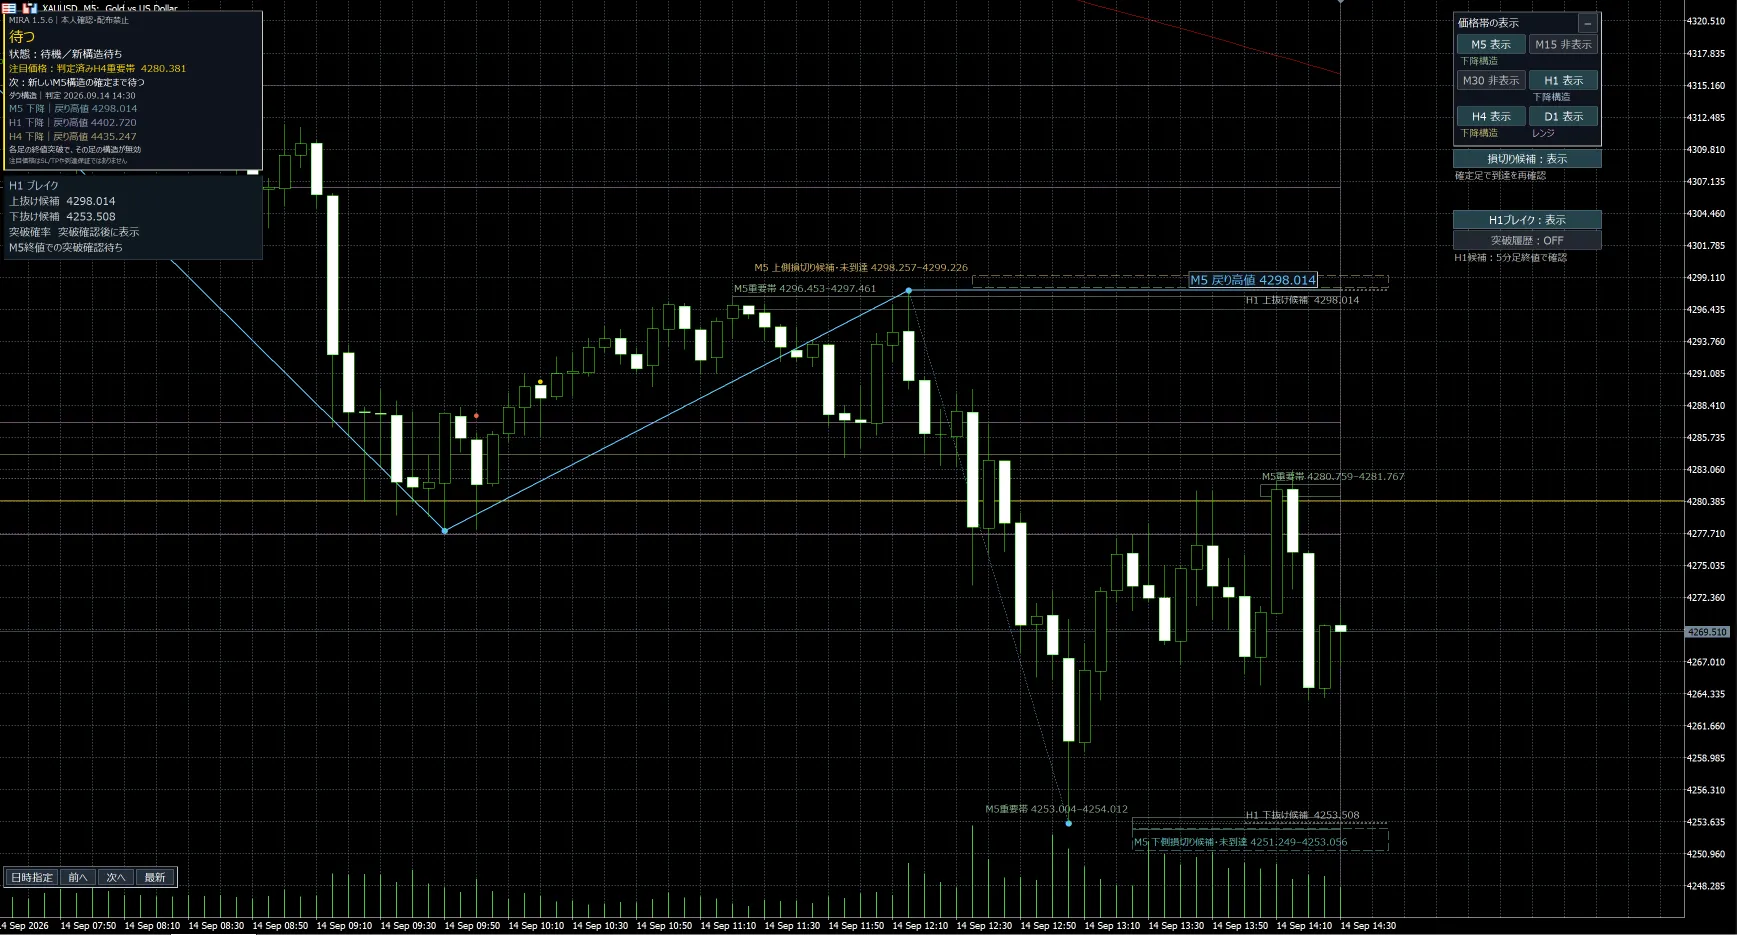
On September 14, in the GOLD 5-minute chart, the retrace was resisted near a key level, and it continued to fall. When overlapped with MIRA’s display, it becomes a chart that conveys the idea of “narrowing the price at which to wait and making a decision on the confirmation bar.”
From a retracement near 4,298, another drop
First, look at the retrace in the center of the chart. After the morning’s sharp drop, the price briefly rebounded, but after testing around 4,298 it fell again.
In the image,“M5 Retrace High 4298.014”and nearby“M5 Important Zone 4296.453–4297.461”are displayed. The H1 breakout candidate is also at 4,298.014, making it easy to check the relationship with higher timeframes when looking at short-term retracements.
What to consider here is whether the retrace will continue, or if the price will be resisted near a turning point. This price movement provides a format to reflect on selling retracements.
The subsequent retrace also stalls around 4,281
Looking further to the right, the rebound after the fall advances to around 4,281, and then is pushed back again.
Near this area,“M5 Important Zone 4280.759–4281.767”is displayed. The target price in the top-left is4,280.381and this is shown as another level defined as “Judged H4 Important Zone.”
Because attention levels on different timeframes look close in price, it becomes easier to narrow down where to observe to confirm whether the bounce around this area will continue to rise. The image shows a movement where the price is pushed back toward the 4,260s after this retrace.
The good thing about MIRA is that you can carry the reason to wait on the chart
From this chart, the three advantages of MIRA are as follows.
① You can specify where to wait for the retrace.
Rather than “it just rose too much,” you can organize the price at which you will observe by considering the retrace high and the relationship with important zones.
② You can view the short-term rebound together with the trend of higher timeframes.
In the image, M5, H1, and H4 all show “downward.” When you see an ascent on the 5-minute chart, it helps you think about whether this is a retrace within a downtrend.
③ Even after movement, you can wait until the next condition is met.
The panel at the time of capture says “Waiting.” The status is “Awaiting / Waiting for a new structure,” and the next action is “Wait for the confirmation of a new M5 structure.” Even if you feel urgency after seeing a price move that has already dropped, you can refocus on what to confirm next.
If you touch an important price, observe the reaction on the confirmation bar
The order of use is“decide the price to wait for → confirm the reaction near it with a confirmation bar → decide whether to consider or pass”.
From a retracement perspective, if the price near the level fails to move higher, you confirm whether downward movement continues. Conversely, if the price breaks above and holds on the upside, you reassess the premise for selling. When the price moves away or the structure is not yet confirmed, you wait for the next material for decision.
At the time of this capture as well, the next M5 structure confirmation was awaited. This “for now wait” indication is part of MIRA’s decision support.
For those who want to think about “where does the retrace stop?”—use MIRA to organize the waiting price and the next confirmation.
See the MIRA product page for features and usage conditions
Image shown: September 14, 2026, XAUUSD M5, reference screen from MIRA 1.5.6 with identity-verification and redistribution restrictions. Prices and times are based on the chart display and are not converted to Japan Standard Time. Please check the product page for the selling version’s specifications. This article is a retrospective after capture. From one image, you cannot confirm the exact pre-display times of each level or the actual trades and P/L; it does not indicate that trades were executed at the displayed prices or that future profits are guaranteed.