Aim to become a proficient trader with Nonaka Nanami! Learn FX with Nanamin - Episode 2

Nanami Nonaka, a FX actress, joins forces with FX specialist Yasushi Yamanaka to learn with everyone what is necessary to profit in FX, aiming to improve trade results. This time, he will teach the basics of fundamental analysis.
Click here for the list of serialized articles
【Table of Contents】 aiming to become a proficient trader with Nanamin Nanami in FX
Yamanaka Yasushi Profile

Yamanaka Yasushi. Joined American Bank in 1982, became Vice President in 1989, Proprietary Manager in 1993. Joined Nikko Securities in 1997, later became Deputy Manager of the FX Funds Department at Nikko City Trust Bank in 1999. Established Ascendant Co. in 2002 and served as Director.
Official Blog:The FX information distribution site provided by Ascendant/Yamanaka Yasushi
Twitter:https://twitter.com/yasujiy
Nanami Nonaka Profile

Nanami Nonaka. Born March 17, 1997. From Fukuoka Prefecture. Active as an FX actress, appearing in films, stage plays, and commercials, while also hosting a regular program on Radio NIKKEI. On her blog, she updates her daily trading activities.
Official Blog:FX Actress Arrives! Serious Real-Time Trading Diary of a Promising New Actress Nanamin
Twitter:https://twitter.com/himnas03
※This article is a reprint/edit of an article from FX攻略.com July 2019 issue. Please note that the market information written in the body may differ from the current market.
What Economic Indicators Should We Look At?
NanakaLast time, Mr. Yamanaka taught broadly about “fundamentals.” Please continue with details on fundamental factors this time as well.
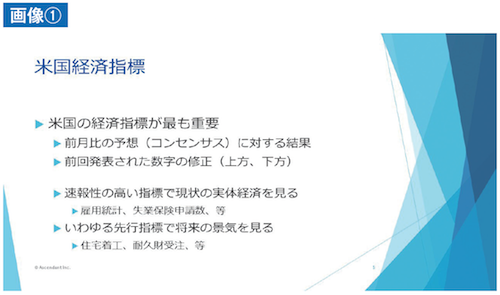
Yamanaka: First, what to look at in economic indicators (Figure ①). Last time, we mentioned the U.S. employment statistics, which include the Non-Farm Payrolls—changes in employment in the non-agricultural sector. I will explain how to judge, for example, if the release shows 220,000, what to infer.
When comparing to the previous month’s forecast, if this month’s forecast is 220,000, we use the actual figure as a basis to decide how many to buy or sell. Basically, forecast figures have a range because many people are involved in forecasting.
NanakaIndeed, forecasts differ slightly depending on who publishes them.
Yamanaka: Exactly. The 220,000 figure we mentioned earlier is the median or the most consensus forecast within the range; in reality forecasts may range from 150,000 to 250,000. If the forecast range is 150k to 250k, and the actual figure is lower than 150k, the market will sell; if higher than 250k, it will buy. The crucial point is how the actual result compares to the forecast range.
Next, we must also pay attention to revisions from the previous month. For example, this month the actual number may be revised downward to 180,000 from the 220,000 forecast. Also, last month’s number may be revised upward from 180,000 to 280,000. If last month’s difference was +100,000 and this month is -40,000, the total is +60,000. In such cases, you must consider the revised portions as well.
Fundamentally, in the market, what matters is how this month’s number compares to the forecast range and how it was revised from the previous release; these are judged instantaneously and influence the market.
Timely Indicators That Reveal the Current Economic Situation
NanakaAmong U.S. economic indicators, why is the employment statistics particularly watched?
Yamanaka: Among economic indicators, the most regarded for timeliness are high-timeliness indicators. Why are highly timely indicators important? Because they provide quick insight into the current state of the economy. Generally, economic indicator data are about one month old. In the U.S., there have even been cases where data delayed by two months appeared due to political events like President Trump closing federal agencies.
Among these, employment statistics are typically compiled in the latter half of the previous month and released on the first Friday of the following month. Since the time from compilation to release is very short, one can gauge the latest situation. The shorter the time from compilation to release and the higher the timeliness, the better one understands the current real economy.
NanakaThus, timely data are essential for understanding the current economic cycle.
Yamanaka: Yes. Additionally, indicators like housing starts and durable goods orders also serve as leading indicators for predicting future economic conditions. From the workers’ perspective, the U.S. can adjust employment easily, so when the economy is weak, people feel job insecurity. As a result, large orders such as housing decrease, and housing starts fall. From the corporate perspective, when demand might shrink, firms are not likely to increase capital investment or expand production lines. If business activity slows, economic growth stalls, and one can anticipate possible economic downturn in the future.