

After the Gold Plunge: "Is it okay to keep selling?" MIRA's yellow "rebound warning" signal
Seeing a sharp drop makes you want to sell. Even when a rebound begins, you think, “it should fall further.”
In such moments, what can give you a cue to switch your chart-reading approach is MIRA’s yellow “Rebound Warning” sign.
MIRA is a discretionary judgment support tool that organizes the price to focus on and the market state. This time, we focus on the “Rebound Warning” that you should not overlook among its features.
Notice the possibility of a rebound → Confirm a short-term rise → Decide while watching the minor troughs.
Being able to view these steps separately is a feature of MIRA.
With the yellow “Rebound Warning,” inspect the selling viewpoint
When you look at a chart that has fallen sharply, your attention naturally turns downward. However, whether it is appropriate to keep selling is a separate judgment.
What to pay attention to here is the yellow “① Rebound Warning” in the figure. It is a display to alert you to movements in the opposite direction while watching the downward trend.
If you are considering selling, pause briefly before following the trend. If you already hold a short position, confirm your preset profit-taking/exit rules. If you are considering buying, wait for the next confirming material.
Add a perspective that is wary of rebounds to the one-direction view of “selling because it’s going down.”This is where there is value in using this sign.
There are often flows where a sharp short occurs in gold, and after that the short continues, but then a rebound long occurs.
We examined approximately ten years from the 2016 Brexit era chart to May 2026 to surface the rebound points.
It took quite some time, but to avoid curve fitting, we handled unused data carefully, fixed conditions before testing, and examined the pattern using a key-open form.
The result is this.
We hope the atmosphere of criticizing sells from everyone’s perspective disappears.
From the diagram: the flow from “① Warning” to “② Confirmation”
In the shown chart, after the sharp drop, the yellow “① Rebound Warning” is shown, with the light blue “② Confirm short-term rise” to its right.
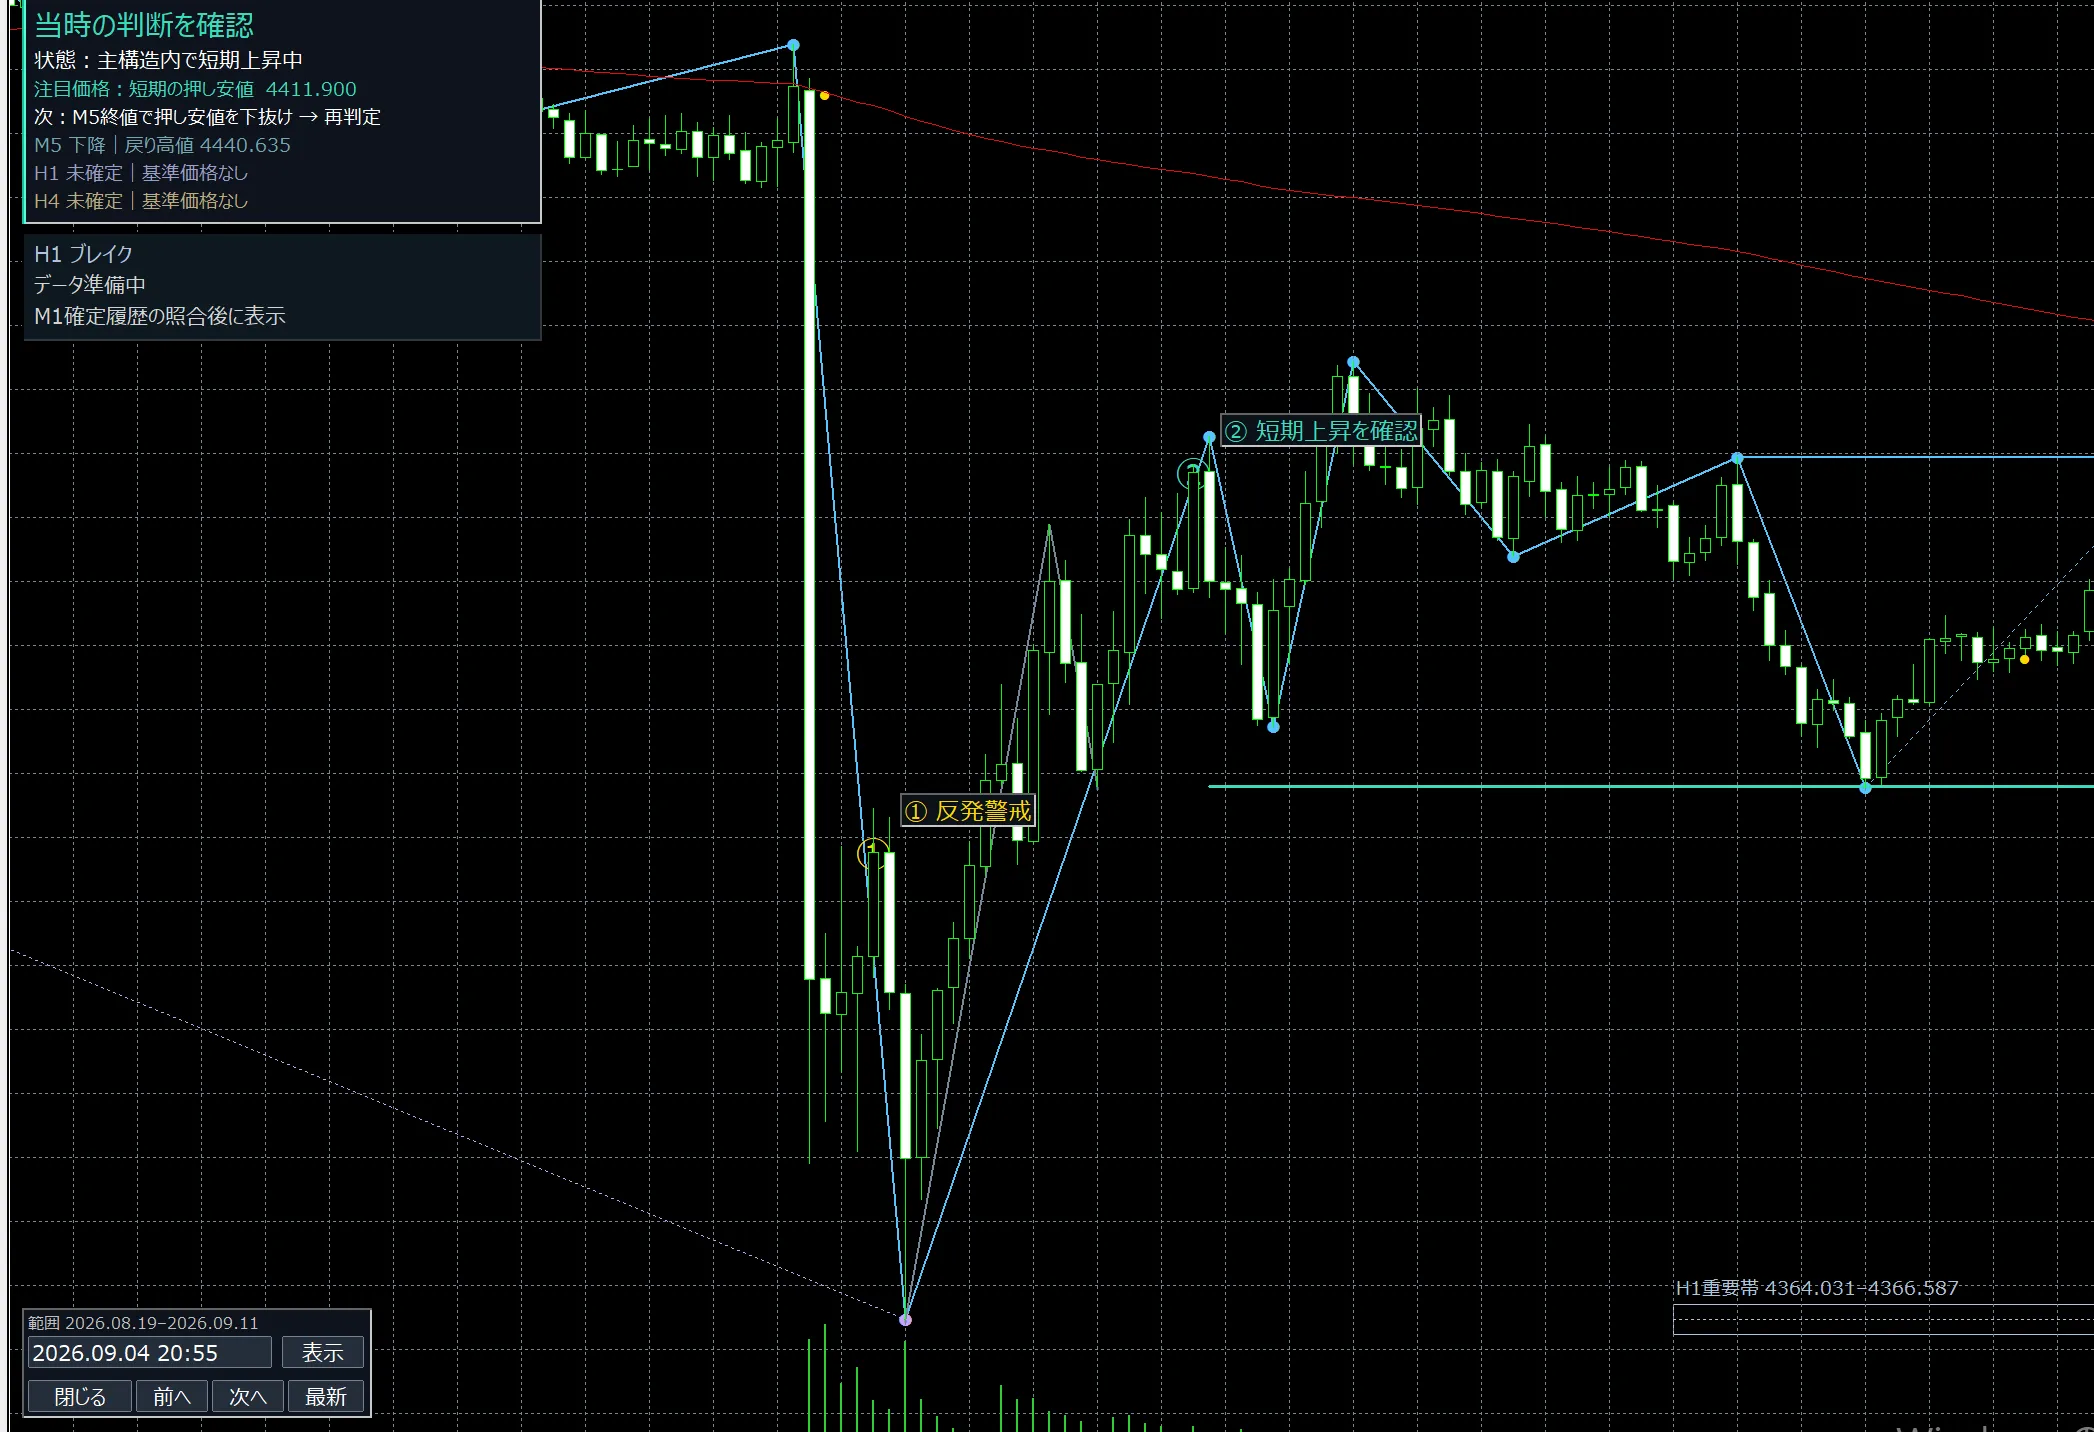
Figure: MIRA’s screen for confirming past scenes. The selected time is shown as 2026-09-04 20:55 on the screen. This is a reference figure including subsequent price movements. It explains the relative positions of ① and ② and is not a real-time recording or order history from that time.
What to note in this diagram is that prices fall again after ①, updating the low. You cannot treat the place where “Rebound Warning” appeared as the bottom price or the buy entry point.
Subsequently, the price rebounds and progresses to the moment of confirming the short-term rise with ②.Prepare for changes in the warning stage, and increase the decision material in the confirmation stage. Reading in these two stages clarifies the roles of yellow and light blue.
“What to look at after noticing it”
Even if you notice a rebound, it is easy to be swayed by price movement if you are unclear on what to look at for judgment.
On the top left of the page, the following information is listed.
- State: Short-term rise within the main structure
- Focus price: Short-term minor trough 4411.900
- Next: Break below the trough at M5 close → re-evaluate
In other words, even after confirming a short-term rise, there is a price to check whether you can maintain that view, and the criteria to reassess are shown.
Note that 4411.900 is the value from the historical screen shown. It is not a buy/sell level used in the current market, but is included to explain how the display is read. Also, on this screen, H1 and H4 are not confirmed. A short-term rise indication alone does not imply an upward turn across higher time frames.
MIRA’s strength lies in embedding rebound preparedness into the decision flow
The yellow rebound warning sign is a feature you should pay attention to if you want to “check once before chasing selling” or “prepare after noticing the rebound possibility.”
Warning on the rebound at ①. Confirm the short-term rise at ②. Beyond that, while watching the minor troughs and the confirmed candles, decide whether to proceed or skip.
Notice, wait, confirm, review.
Being able to capture chart changes in this order is what makes incorporating MIRA into your analysis appealing.
This diagram is an example of presenting this decision flow. It is not a statistical superiority or win-rate verification of signs, nor does it guarantee profits by capturing all rebounds.
How to apply the yellow sign to your own analysis
First, compare the yellow ① and the light blue ② on the shown diagram. If you articulate “what to wait for after seeing ①” and “what to re-evaluate if ② collapses after,” your use of MIRA becomes more concrete.
Prepare for rebounds, wait for confirmation, and judge based on price.
You can check MIRA’s features and usage conditions on the product page.
The shown diagram is a feature introduction based on the provided testing screen. For features, displays, and supported versions available in the commercial version, please check the latest product description. This article aims to provide general information and does not endorse any specific trading. Final investment decisions and risk management are the reader’s own responsibility.