Ask Max Iwamoto: The Essence of Moving Averages Easy for Beginners to Understand | Episode 3: Please Share Concrete Utilization Methods [Max Iwamoto]

Max Iwamoto Profile

Keisuke Iwamoto. As his nickname “Technician Analyst with a middle school diploma” suggests, he is a rare no-formal-education analyst in the industry. Even in an era where educational background remains highly valued, he continues to strive daily in the FX market, which is entirely unrelated to such society. With the belief that “now, when anyone can start FX easily, we should acquire solid skills to keep winning,” he serves as a columnist and seminar speaker.
※This article is a reprint and rewrite from FX攻略.com July 2019 issue. Please note that the market information described in the body may differ from current market conditions.
Last time, we learned about “Granville’s Law,” and I think absolute beginners could identify clear points for buying and selling. This time, based on past charts, Max Iwamoto will teach you how to practically use buy and sell signals to find entry and exit points.
Finding Buy/Sell Timing with Moving Averages
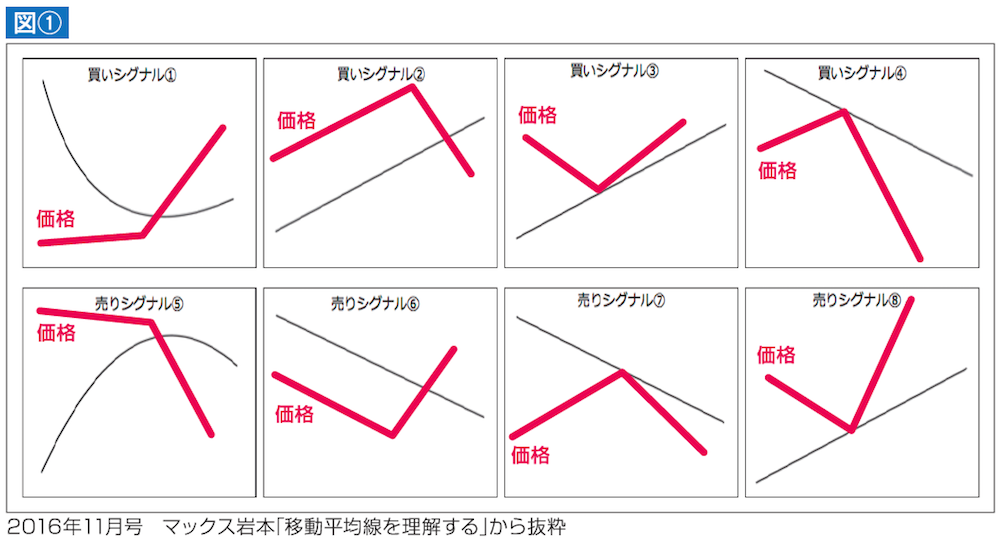
Last time, we explained the eight buy and sell signals proposed by Granville (Figure 1). This time, we want to explain more practically using charts.
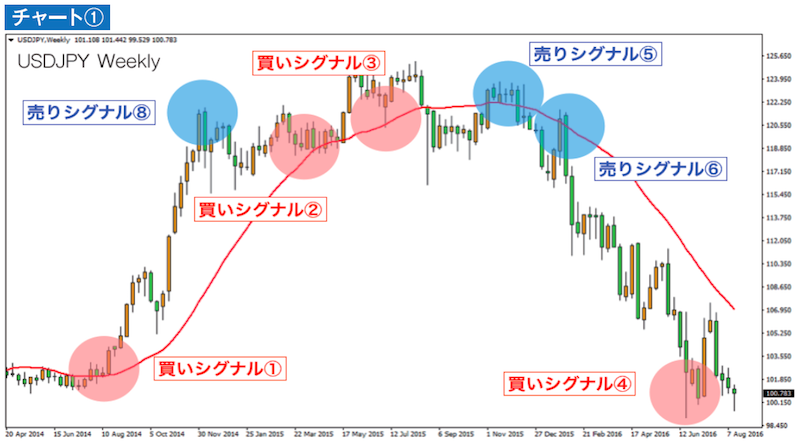
First, look at the far left Buy Signal ① in Chart ①. The price movement before that has been flat. Because the price is flat, the moving average also flattens out. After that, the price rises above the moving average, confirming a Golden Cross. This is Buy Signal ① of Granville’s Law.
Next, in reverse order, we will explain Sell Signal ⑧. In this chart there isn’t a specific deviation rate, but because it has moved far away from the moving average, it’s considered a sell signal based on mean reversion (returning to the original position). It’s the expectation that, having deviated this far, the price will soon fall. In the end, it did drop over the next about two weeks, but it did not plummet all at once.
A large upward deviation from the moving average indicates more buyers. Therefore, a Sell Signal ⑧ does not guarantee a drop.
Next, Buy Signal ② is a somewhat risky signal where you confirm a temporary dip below the moving average and buy. In Chart ①, the price slightly dips below the moving average, but in the end it did not continue to fall, so there were some profits.
Next is Buy Signal ③. Here, the price is driven down by selling momentum and temporarily breaks below the moving average, but it rebounds without breaking down, and rises again, confirming Buy Signal ③ as valid.
Then there is Buy Signal ④ at the bottom right. This is the reverse of Sell Signal ⑧. It’s a signal to buy based on mean reversion at the point where the price sharply falls below the moving average. This is based on past charts, but I think few people would actually buy here. Unless you draw a line representing deviation with another technical tool, this alone makes it hard to buy.
Next is Sell Signal ⑤, which is based on prices that were above the moving average and then fall below it.
Next is Sell Signal ⑥. It shows a temporary return of price to a downtrending moving average. The weekly close rises above the moving average, but ultimately it falls again. Some might call it a Golden Cross, but it’s a selling signal. In this case, the price fell later, so it worked out. Be aware that selling in such a scenario can still lead to losses if the price rises against your expectation, so I wouldn’t recommend this sell signal for beginners.
Finally is Sell Signal ⑦. Since Chart ① cannot confirm this, I will explain with Sell Signal ⑥ as a reference. The price below moves toward the moving average, but cannot break above it and then declines.
Chart ① is the weekly chart for USD/JPY, but Granville’s Law can be used on daily, hourly, 5-minute, and other timeframes. By displaying a single moving average regardless of time frame, you can identify buy/sell timing, so I believe it’s a technical method beginners should definitely learn.