
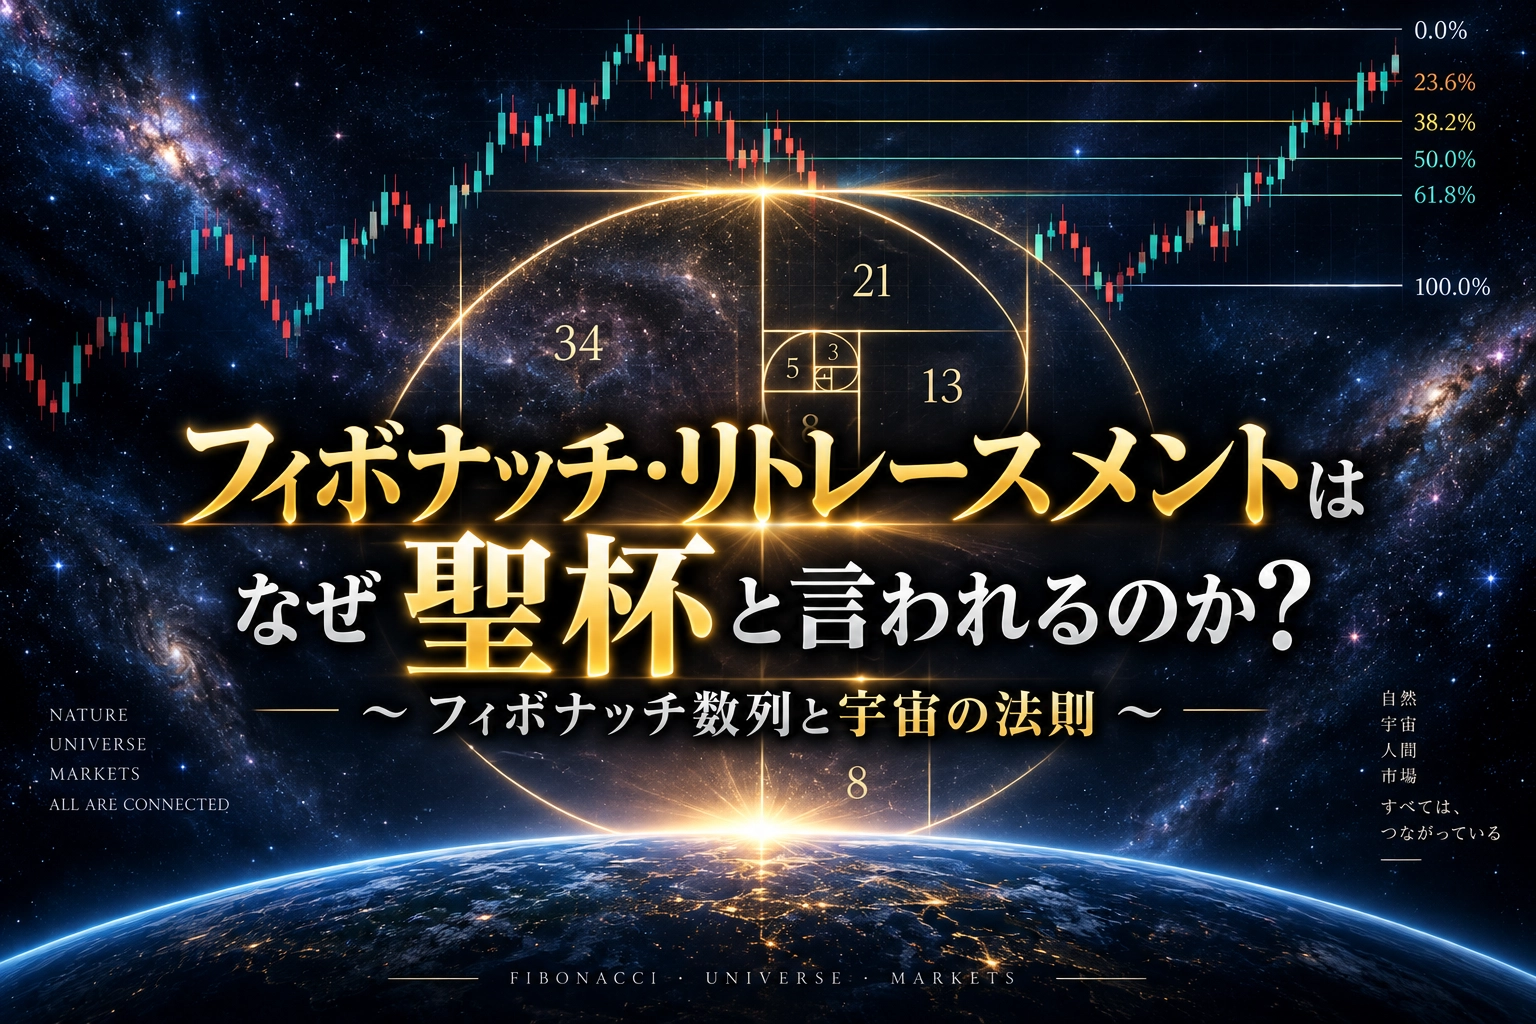
Why is the Fibonacci retracement called the Holy Grail? ~The Fibonacci sequence and the laws of the universe~
The Law of the Universe and the Origin of Beauty
From mathematics to nature, art, and even the modern financial markets, there is a single beautiful motif that underpins the structures supporting the world.
It is the “Fibonacci sequence,” from which the “golden ratio” is derived.
This article traces the manifestation of the sequence principles in nature and art, and ultimately treats the design of edge and expectancy in FX trading, as well as its implementation in systematic trading, as a single continuous flow.
- PART I | Principle — The Sequence and the Golden Ratio
- 1. Structure of the Fibonacci Sequence and the Golden Ratio
- 2. The Laws of Nature and the Universe
- 3. The Geometry of Beauty as Perceived by Humanity
- PART II | Market Edition — Laws Evident on Charts
- 4. Why the “Laws of the Universe” appear on Financial Charts
- 5. The Principle of Fibonacci Retracement
- 6. Fibonacci Expansion (Setting Profit Targets)
- 7. Fusion with Elliott Wave Theory
- PART III | Practice Edition — Edge, Expectancy, and Systemization
- 8. Three Reasons Edge Emerges
- 9. Structures that Mathematically Elevate Expectancy
- 10. Methods to Maximize Expectancy in Real Trading
- 11. Elevation to System Trading (EA/Indicators)
1. Structure of the Fibonacci Sequence and the Golden Ratio
The Fibonacci sequence became widely known when the 13th-century Italian mathematician Leonardo Fibonacci introduced it in his book Liber Abaci.
The rule of the sequence is simple.“The sum of the previous two numbers yields the next number.”It is generated by this recurrence relation.
F0= 0
F1= 1
Fn= Fn-1+ Fn-2(n ≥ 2)
0, 1, 1, 2, 3, 5, 8, 13, 21, 34, 55, 89, 144, 233, 377...
Convergence to the Golden Ratio φ
The true mystery of this sequence lies in the ratio of two adjacent numbers. As you go further back in the sequence, the ratio of neighboring terms tends toward a constant value.
limn→∞(Fn/ Fn-1) = φ = (1 + √5) / 2 ≈1.6180339887...
This limit, φ (phi), isthe Golden Ratio. Conversely, if you divide adjacent numbers by the following term, you converge to0.618.1 : 1.618and0.618 : 1are the same relationship viewed from opposite directions, and the “61.8%” discussed later in market analysis is precisely this value.
Removing a square from a rectangle with golden ratio leaves another rectangle preserving the same golden ratio. Connecting arcs drawn inside these rectangles forms an infinitely self-similar “golden spiral (logarithmic spiral).”
2. The Laws of Nature and the Universe
The greatest mystery of the Fibonacci sequence is that nature—plants, animals, meteorological phenomena, and even the structure of galaxies—adopts this mathematical pattern spontaneously.
Plants’ Survival Strategy and the “Golden Angle”
If you observe the arrangement of the seeds in a sunflower, the spirals wind in clockwise and counterclockwise interleaving. Counting the spirals yields adjacent Fibonacci pairs like “34 and 55” or “55 and 89.” The same structure appears in the arrangement of pinecone scales.
When plants place leaves and seeds around a stem, the angle of rotation is about137.5° (Golden Angle). This is the mathematical optimum for maximizing sunlight and rainfall exposure without leaf overlap.
Logarithmic Spirals and the Scale of the Universe
The same golden spiral is seen in the cross-section of the nautilus shell, the swirl of enormous typhoons, and the arms of spiral galaxies spanning hundreds of light-years. On the micro side, the periodicity of the human DNA double helix also points to this ratio. In processes of growth and expansion with rotation, the Fibonacci structure is the most rational form to minimize energy while maintaining shape.
3. The Geometry of Beauty as Perceived by Humanity
Since ancient times, humans have intuitively recognized the Golden Ratio as the most harmonious and beautiful proportion and have incorporated it into architectural and artistic works.
- Classical Architecture:The façade of the Parthenon, and the incline ratios of Egyptian pyramids.
- Painting and Fine Arts:Leonardo da Vinci’s Mona Lisa and Vitruvian Man, and Hokusai’s The Great Wave off Kanagawa.
- Modern Design:Apple’s logo, the aspect ratio of credit cards, and the shaping of automobile forms.
Whether consciously or unconsciously, humans perceive objects divided by Fibonacci proportions as visually stable and elegant.
“61.8%” is not just a sequence of numbers; it is a universal design code that makes cosmos and life most stable and harmonious.
4. Why the “Laws of the Universe” Appear on Financial Charts
The Fibonacci sequence does not stay in nature; it also prominently appears in price movement charts of the financial markets (stocks, FX, crypto), which are a collective reflection of human psychology. The reasons this rule functions on seemingly inert price charts can be organized into two main points.
① Public Psychology (Herd Mentality) Is Also Part of Nature
Prices are driven by human fear and greed. Since humans are part of nature, the collective price movement of the market forms according to natural fractal structures and golden rules in the unconscious. The fact that countless emotions balance to produce ratios akin to plants and galaxies is highly intriguing.
② Self-Fulfilling Prophecy
Traders, institutions, and algorithmic trading systems worldwide place emphasis on Fibonacci levels. As many participants expect a rebound at “61.8%” and concentrate orders at the same price zone, those levels become strong support-resistance in practice. Regardless of mystique,“it works because many people expect it to” is the blunt reason behind this ratio’s effectiveness.
5. The Principle of Fibonacci Retracement
After the price moves in one direction, when it retraces, this indicator predicts where the price will halt its decline. The main reference levels are directly derived from the relationships of the sequence’s terms.
- 61.8% (0.618):The value of any term divided by the next term (Fn / F(n+1) → 0.618)
- 38.2% (0.382):The value of a term divided by the term two steps ahead (F(n) / F(n+2) → 0.382)
- 23.6% (0.236):The value of a term divided by the term three steps ahead (F(n) / F(n+3) → 0.236)
Note that 50.0% (half retracement) is not derived from the sequence but is a psychological level; however, it is commonly listed alongside the same tools and is treated as an important level in practice.
How to Use the Most Important Line “61.8%”
In a trend, predicting how far a temporary pullback (reversal) will extend,61.8%is considered the strongest rebound point (the Golden Pocket).
- Final defense line for trend continuation:In an uptrend, the 61.8% line is an excellent entry point for dip buying. If clearly breached to the downside, it becomes a clear stop-loss level indicating a trend reversal.
- Combination with the 50.0% retracement:Between 50.0% and 61.8% is a zone where institutions tend to gather liquidity, making price action in this zone a high-probability signal.
6. Fibonacci Expansion (Setting Profit Targets)
While retracement deals with where to enter, expansion predicts “how far to let profits run” after entry. By connecting the start of the trend, the high/low, and the retracement, it estimates the next wave’s target.
- If the retracement rebounds at 61.8%, the next upward wave is likely to reach the distance from the start to the level “161.8%.”This becomes a logical profit target rather than a guess.
7. Fusion with Elliott Wave Theory
Price formation is believed to occur in the basic cycle of “five waves upward (impulsive) and three waves downward (corrective)” totaling eight waves. The numbers of the waves (1, 3, 5, 8,…) and the price widths of each wave are directly connected to Fibonacci numbers and the golden ratio. Retracement measures the depth of pullbacks, and expansion measures targets, which in effect quantifies this wave structure numerically.
8. Three Reasons Edge Emerges
If we arrange the principles into concrete “edge” for traders, they can be summarized into three points.
① Self-fulfilling Prophecy
Algorithms used by traders and institutions worldwide concentrate orders along the same lines (38.2% / 50.0% / 61.8%), making rebounds more likely to occur.
② Objective Rules for Pullbacks and Rallies
Eliminate subjective entries and determine the depth of trend adjustments with clear numbers.
- 38.2%: Shallow pullbacks in strong trends
- 50.0%: Psychological landmark
- 61.8%: Primary level based on the Golden Ratio
③ Confluence (Overlap) of Evidence
When horizontal supports/resistances, moving averages (20EMA/200SMA), and channel bottoms align with Fibonacci levels, the probability of a rebound increases significantly.
9. Structures with Higher Mathematical Expectancy
The virtue of Fibonacci is not that it is highly accurate.It is that you can construct positions so that losses are small even when you are wrong. Trading performance is determined by the product of win rate and risk-reward ratio.
By entering after fully pulling to the line, you minimize distance to stop loss and maximize distance to take profit, structurally ensuring high risk-reward ratios (1:2 to 1:3 or higher).
Note: The break-even win rates are approximate values calculated with P = 1 ÷ (1 + R) and expectancy assuming a 50% win rate. The numbers vary depending on which R you select within the RR range.
10. Methods to Maximize Expectancy in Real Trading
Limit to the trend direction on the daily or 4-hour chart, and draw Fibonacci retracements on lower timeframes (15 minutes to 1 hour) to target pullbacks. Do not trade against the higher-timeframe trend.
Instead of placing market orders at the reached line, confirm reversal signals such as a pin bar (shadow on the bottom) or engulfing patterns before entering to avoid false breaks.
The final defense line after a 61.8% breach. By targeting rebounds near the wave’s failure point, you can achieve RR ratios of 1:4 or higher, making profits sustainable even with lower win rates.
11. Elevation to System Trading (EA/Indicators)
When incorporating into EA or custom indicators, it pays to combine with other technical analysis tools (creating confluence) rather than relying on a single indicator.
Example of combination logic:
“Fibonacci 61.8% price zone” + “Stochastic oversold (below 20) cross” + “touch of 200-day moving average (200MA).” Extracting only the points where these align allows building a highly edge-rich automated trading system.
Fibonacci is not a forecasting tool, but a capital management tool to pull entries at moments with positive expectancy while limiting risk as much as possible.
A mathematical structure that expands while preserving the similarity of shapes. The consistent principle running through the arrangement of life, the expansion of the universe, and financial markets serves as a symbol that the world is constructed with order.
Fibonacci 61.8% — The Universal Code of Financial Markets