
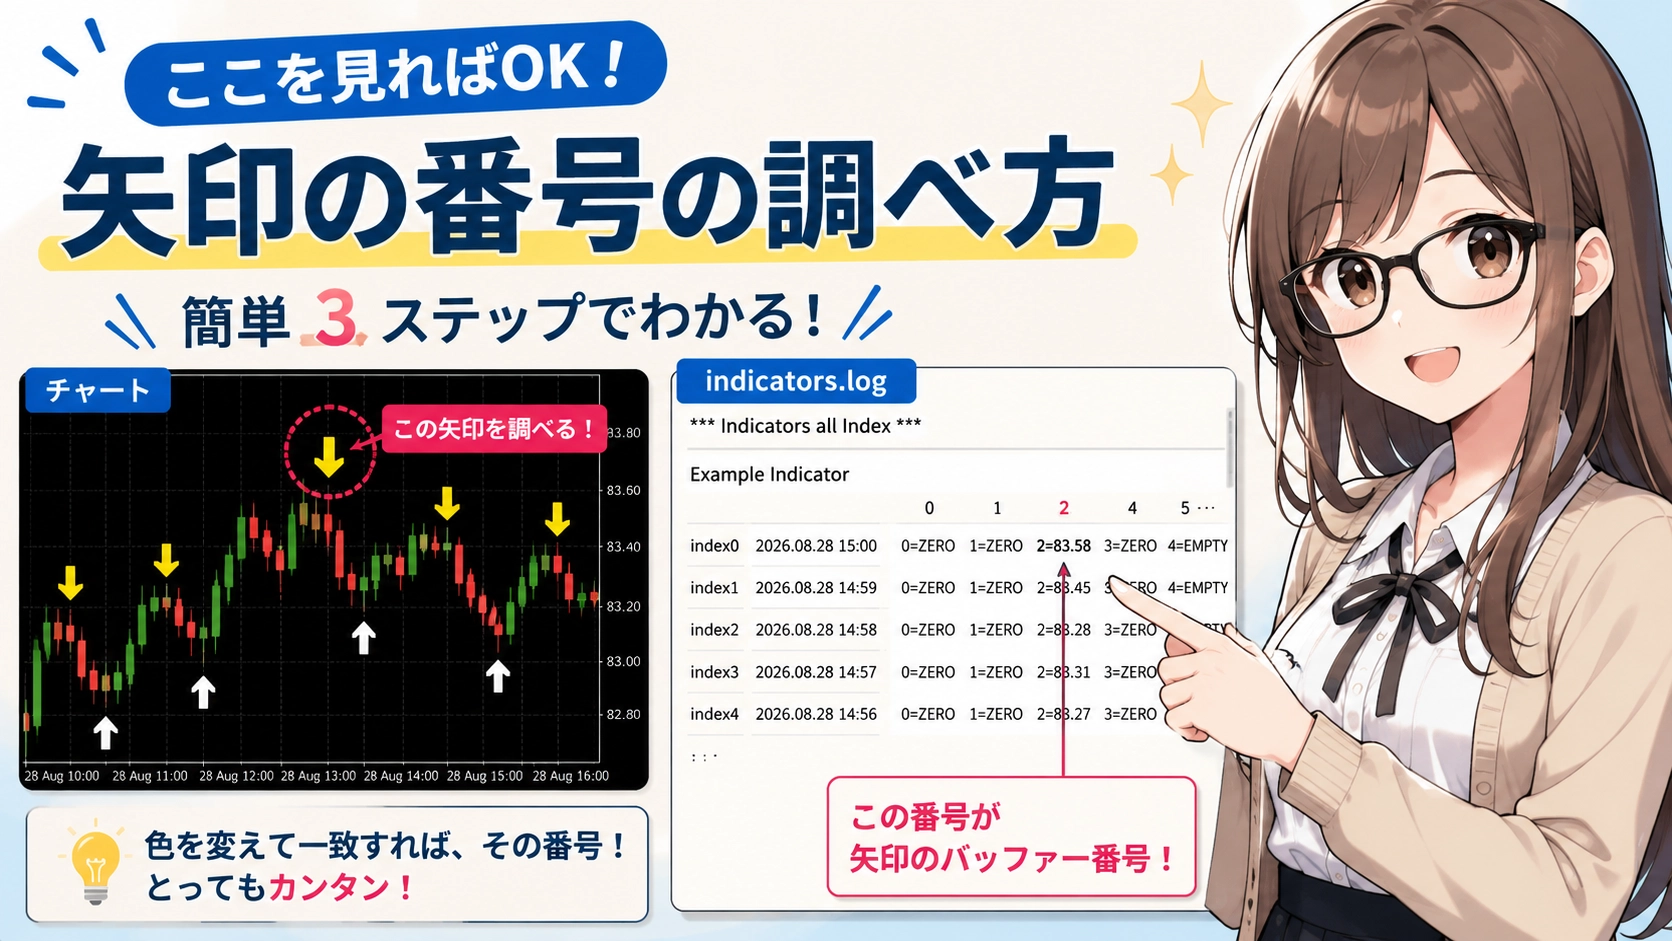
Signal Tool Integration: Can’t tell which arrow with SignalChecker? How to inspect buffer number and object in indicators.log
If you connect MT4/MT5 indicators with theOne-Click FX Series, you need to check which buffer number the indicator arrows are coming from or whether they are displayed as objects, orwhether they are shown as objects.
- How to find the number using buffer-type
- 1. Obtain the necessary files with OneClickSA
- 2. First, search for “Indicators all Index”
- 3. What do “index0” and “index1” mean?
- 4. Find the same date/time as the arrow
- 5. Pay attention to “ZERO” and “EMPTY_VALUE”
- 6. Verify with multiple arrows, not just one
- 7. If the buffer number is 8 or higher
- 8. If not found in buffers, suspect the “object-type”
- 9. For objects, also match date/time and price
- 10. Also pay attention to the object name
- 11. Basic flow of the investigation
- For those who want to investigate by themselves
How to find the number using buffer-type
Open the indicator settings screen and check the “Color Settings.”
- Check the color of the arrow you want to investigate on the chart.
- In the indicator’s “Color Settings,” look for the number that has the same color as the arrow.
- Change that number’s color to a different, more noticeable color.
- If the colors of the arrows on the chart are also changed in the same way, that number is the buffer number used by the arrows.
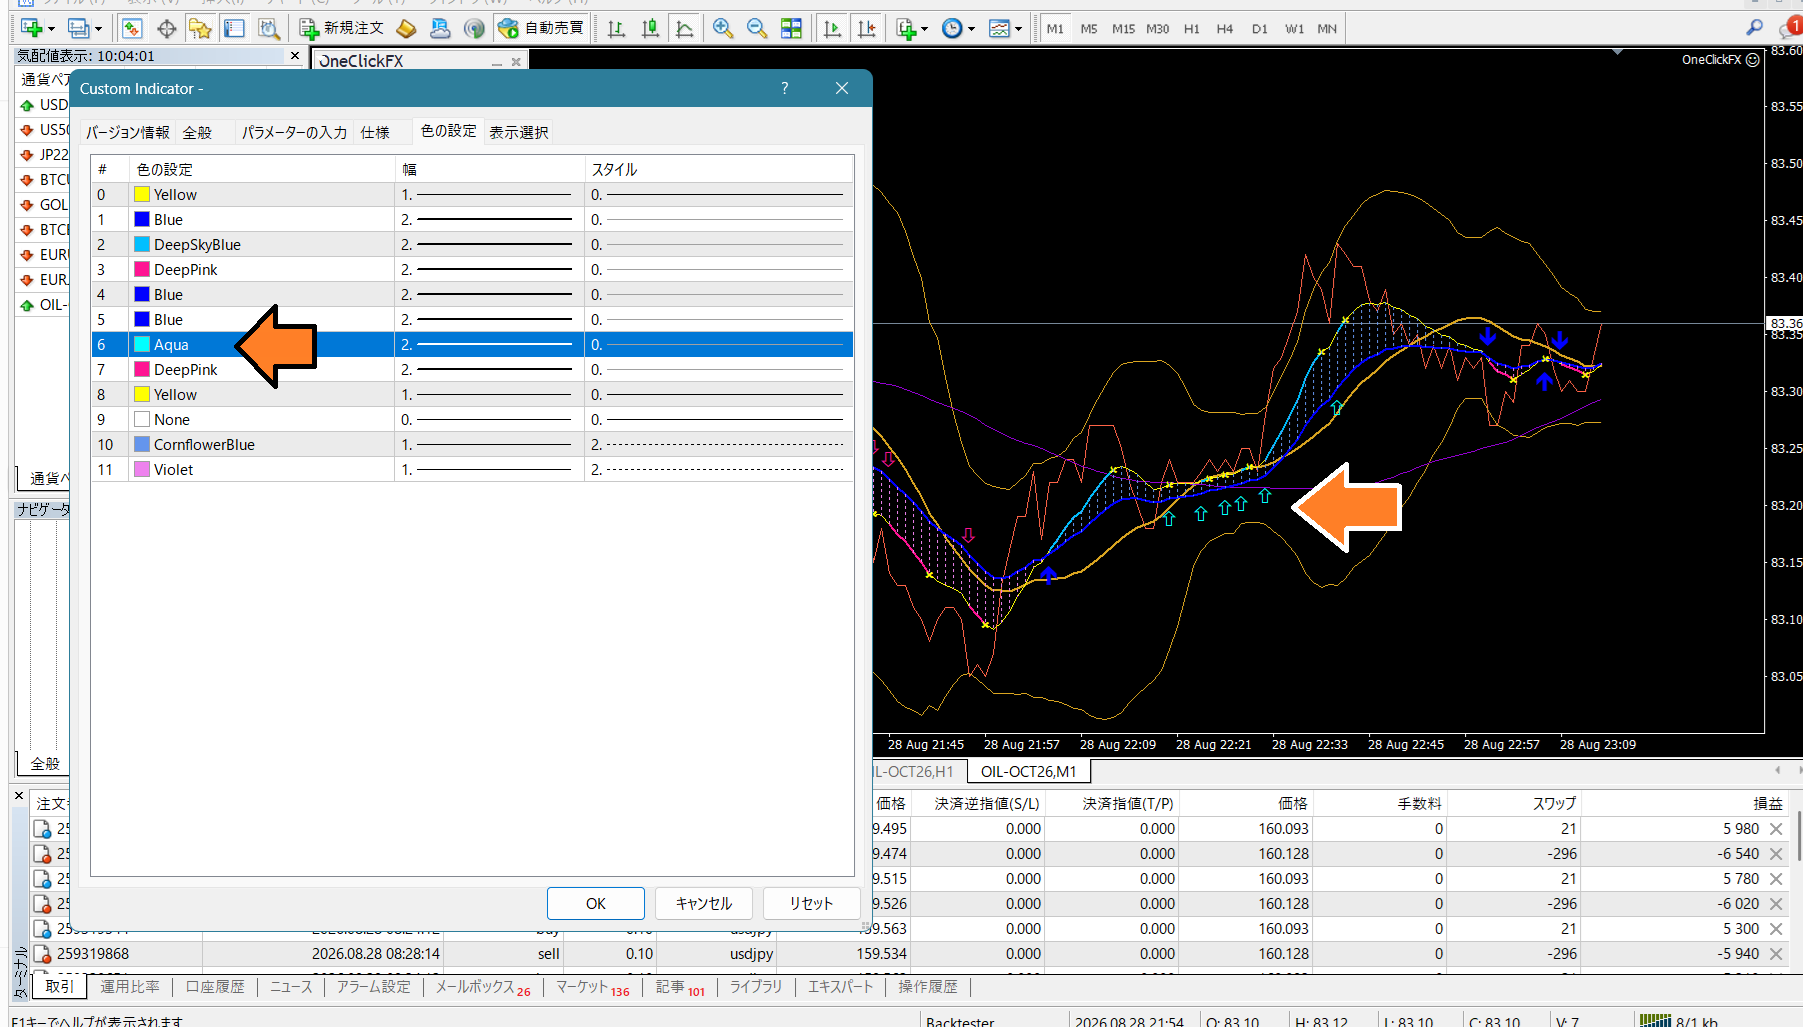
For example, suppose the arrow on the chart is light blue, and the color setting shows “6” as light blue.
If you change the color of “6” to red, and the chart arrow also becomes red, you can conclude Buffer number “6” corresponds to that arrow.
Tip
Since you only need to change the color of the number that matches the arrow’s color and check if the chart arrow changes, you can reasonably easily confirm the buffer number without parsing indicators.log in detail.indicators.log.
Even if you used SignalChecker but the arrow information isn’t displayed, you may still be able to investigate by checkingindicators.log.
Here we describe how to investigate using theindicators.log andchart.png obtained with OneClickSA.
1. Obtain the necessary files with OneClickSA
First, run OneClickSA.
For this investigation, we mainly use the following two files.
indicators.logchart.png
indicators.log contains the list of objects on the chart and the results of the indicator investigation.
chart.png is the chart image at the time the information was obtained with OneClickSA.
In other words,
Check where the arrows are in chart.png and look for what data corresponds to that date/time in indicators.log
.
2. First, search for “Indicators all Index”
indicators.log open, find
***Indicators all Index ***section.
In this example,
***Indicators all Index ***
Bollinger Bands:#4072
Moving Average:#4072
Examples\Heiken_Ashi_Open_is_HL_wMAfilter_Alert:#0
This shows the indicators being investigated for that chart.
First,look for the indicator that displays the arrow you want to investigate.
3. What do “index0” and “index1” mean?
Indicator data are arranged as
index0
index1
index2
index3
For example,
index0 2026.08.28 23:14
index1 2026.08.28 23:13
index2 2026.08.28 23:12
index3 2026.08.28 23:11
Here,
index0 is the latest data.
As the number increases, it refers to older bars’ data.
Behind it is the date/time, and further,
0=83.37
1=83.31
2=83.34
3=83.31
4=EMPTY_VALUE
5=ZERO
6=ZERO
...
shows the data arranged.
0=
1=
2=
3=theleft-side number is the buffer number.
0=83.37
1=83.31- Buffer 0 → 83.37
- Buffer 1 → 83.31
This means.
4. Find the same date/time as the arrow
This is the most important point.
Firstchart.pnglook,the date/time and price where the arrow is displayed.
For example, on the chart,
Around 2026-08-28 15:20, arrow near 83.35
is displayed.
Thenindicators.log search near the same date/time.
And in the data for that date/time,
0=ZERO
1=ZERO
2=83.35
3=ZERO
If so,
buffer 2 contains a value matching the arrow’s price
, so buffer 2 may correspond to that arrow.
5. Pay attention to “ZERO” and “EMPTY_VALUE”
When inspecting buffers, you don’t need to look at every number.
Where an arrow is displayed, usually you confirm whether the corresponding buffer has a value or not.
0=ZERO
1=ZERO
2=83.35
3=ZERO
4=EMPTY_VALUE
5=ZERO
In this case,
only buffer 2 has a price-like value
, which means the others are not showing prices.
This value corresponds to the
- date/time of the arrow in chart.png
- the position of the arrow (price)
and if they match, that buffer is likely producing the arrow.
6. Verify with multiple arrows, not just one
Even if one arrow matches, it does not guarantee the conclusion.
If possible, verify with multiple arrows.
Arrow 1 → Buffer 2
Arrow 2 → Buffer 2
Arrow 3 → Buffer 2
Using the same buffer and having the dates/prices match increases confidence.
Conversely,
Arrow 1 → Buffer 2
Arrow 2 → Buffer 5
Arrow 3 → Buffer 1
being scattered suggests another mechanism may be used to display arrows.
7. When the buffer number is 8 or higher
This is especially important for users of SignalChecker.
SignalChecker is designed to check up to eight buffers.
Even in this case,“not knowing the arrow’s buffer equals not being able to investigate”
indicators.log can still be used to investigate.
8. If not found in buffers, suspect the “object-type”
If you inspect the buffers but cannot find data matching the arrow’s date/time and price,
it may be that the arrow is displayed as an object rather than in a buffer
.
In the first half of indicators.log, you will find
***Object***section.
HAtogarr1009,2026.08.28 05:47,82.72820454
HAtogarr1014,2026.08.28 05:52,83.86220952
HAtogarr1030,2026.08.28 06:08,82.56876697,object name/date/time/price are listed.
9. For objects, also match date/time and price
Like buffers,
the same date/time and price on chart.png
↓
object with the same date/time and price
on indicators.log is sought.
For example, if the arrow on the chart shows
2026.08.28 15:20
83.35 vicinitythen,***Object*** contains an object with the same date/time and price.
If a matching object is found, that object may be the arrow.
10. Also pay attention to the object name
If the arrow is created as an object by an indicator, the object name may have a set pattern.
UP
DOWN
BUY
SELL
such names appear.
- UP → upward signal
- DOWN → downward signal
- BUY → buy signal
- SELL → sell signal
Additionally, when coordinating with objects via AutoArwTrade or similar, you can specify the target object name rather than the arrow’s appearance to link signals. Official documentation also supports signal linking by object name or buffer number.
11. Basic investigation workflow
Putting it all together, follow this order for clarity.
STEP 1
Run OneClickSA.
STEP 2
chart.png check the date/time, price, and whether it is an up or down arrow for the arrow you want to investigate.
STEP 3
indicators.log from
***Indicators all Index ***find the target indicator.
STEP 4
Find the same date/time’sindex.
STEP 5
0=xxxx
1=xxxx
2=xxxx
...
From them, find the value that matches the arrow’s price.
STEP 6
Confirm which buffer number matches.
STEP 7
Verify with multiple arrows that the same buffer is used.
STEP 8
If not found in buffers, check
***Object***.
STEP 9
Find an object with the same date/time and price as the arrow.
STEP 10
Confirm the found object name.
For those who want to investigate by themselves
The content is a bit challenging, but once you understand the mechanism, you will be able to investigate how a indicator’s arrows are produced on your own.
Most importantly,
correlate the date/time and price when the arrow appeared with the date/time and price recorded in indicators.log
.
- buffer number is 8 or higher
- or it's displayed as an object, not a buffer
you may still be able to determine the cause.
If you send us indicators.logindicators.log andchart.png obtained with OneClickSA, we will investigate on our side as well.
Completely risk-free trading simulator for free practice and verification!
One-Click FX Training MAX details page