
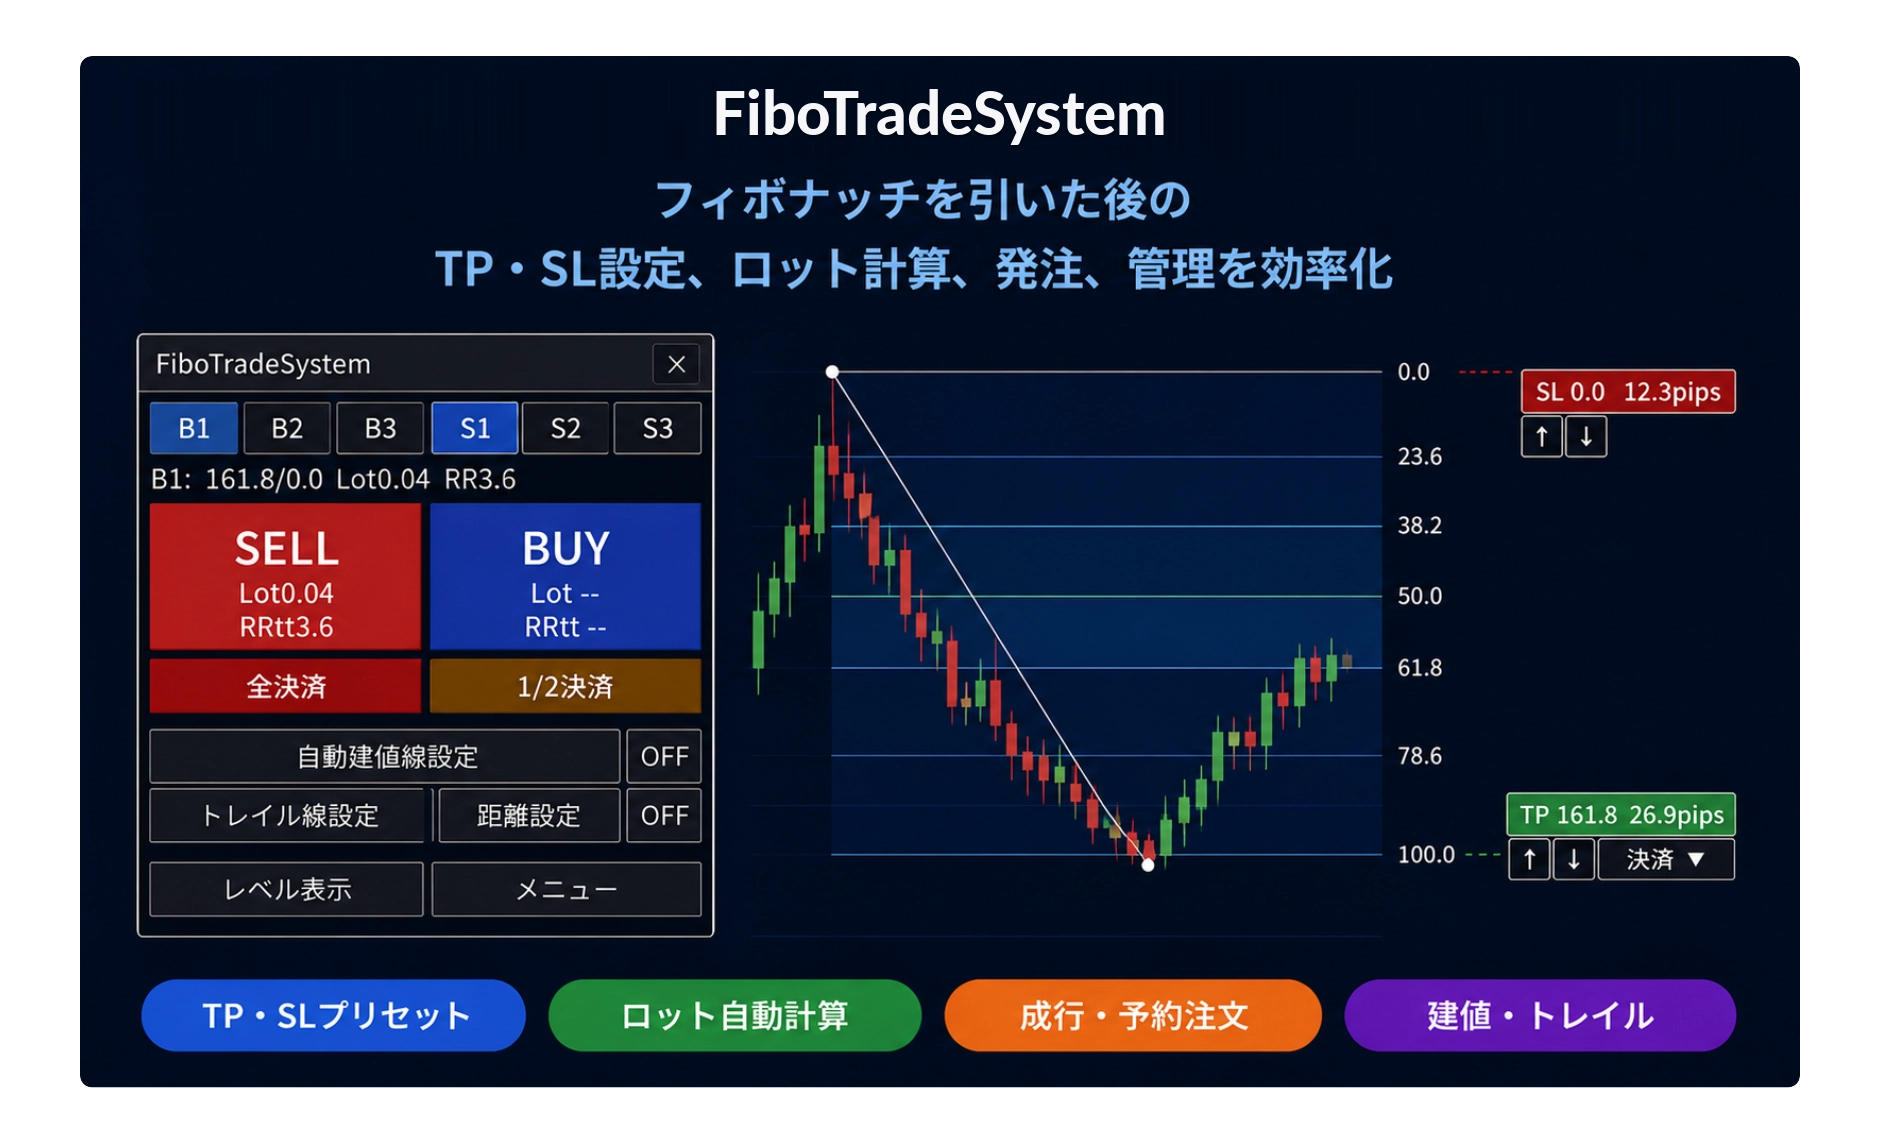
【Tool Explanation】Episode 1: Support Function When Inserting Fibonacci Numbers
About this Series
In 【Fibonacci Practical Notes】 we've discussed Fibonacci itself—where price tends to rebound, where to set as a starting point. This is the theoretical part.
From this installment, I will explain how to use the MT5 tool I created, FTS (Fibonacci Trade System).
The features are honestly many. If I tried to cover everything in one go, they would all be half-done. So I decided to split it into several parts.
All features are here ⇒FibonacciTradeSystem
After drawing Fibonacci, there are some quietly troublesome things
There is a guideline for rebound around 61.8%. But can you quickly tell exactly what that value is?
Do you read it by staring at the chart scale, or by moving the mouse near the line to check the price? Either way, it takes an extra step.
Moreover, there are times when you adjust while watching the market. Move the starting point by one bar. Readjust the ending point to match the body. Each time, you have to repeat the same confirmations again.
FTS is a tool specialized for Fibonacci
To eliminate this hassle, I created FTS (Fibonacci Trade System).
I think the usage is simpler than you might expect. Draw Fibonacci. Leave the rest to FTS. In other words, only these two steps.
Fibonacci itself uses features that are already built into MT5. You don’t need to memorize any special操作. If you draw as usual, from there FTS takes over.
When you draw Fibonacci, levels and prices are automatically shown
In the initial settings, the sequence is 0 / 23.6 / 38.2 / 50 / 61.8 / 78.6 / 100 / 161.8 / 261.8 (this list can be changed to any values you like later).
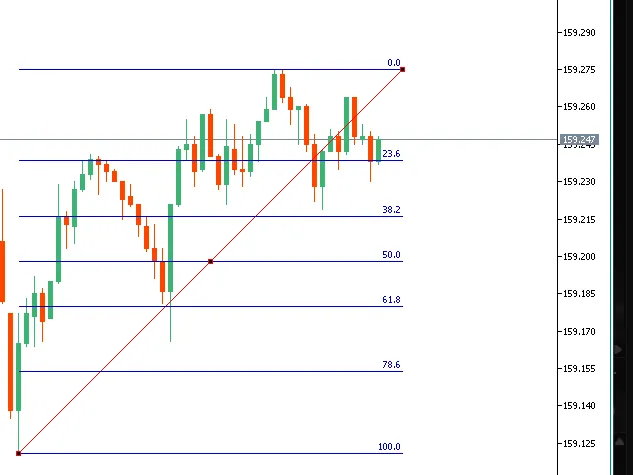
Before (only Fibonacci drawn)
After (FTS detected the level)
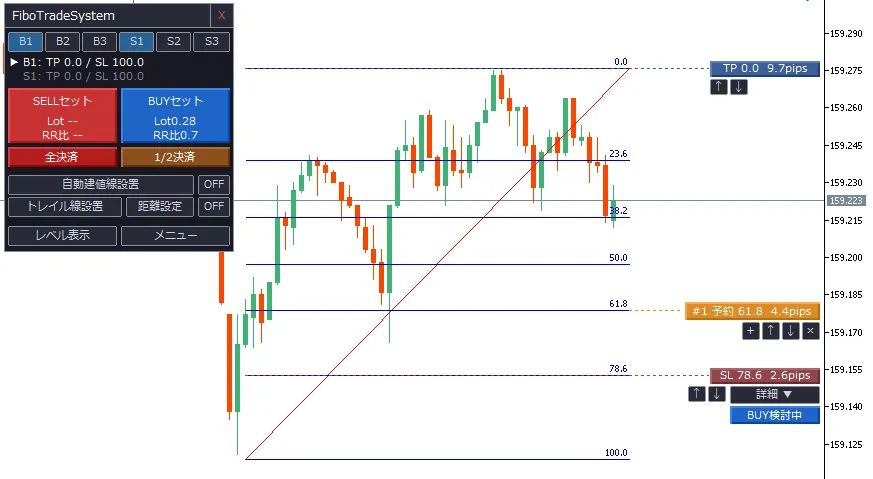
Note: the screen also shows panels and badges, but for now please focus only on the level labels. Each button on the panel will be explained one by one in a future installment.
Alongside the numbers, the prices can also be shown. However, in the initial settings this is OFF, so enable it with the “Show price” button if you need it. Conversely, you can also hide the numeric labels like 61.8 and show only the lines to make things look cleaner.
With this, the hassle of hovering to read prices should disappear.
New Fibonacci becomes the direct calculation target
No matter how many times you redraw, it won’t be a problem. FTS always uses the most recently drawn (or edited) Fibonacci as the subject for calculation and display.
Old Fibonacci lines do not disappear; they remain as they are. However, the badges for TP/SL and the price calculations switch to the new Fibonacci.
From now on, just draw the new Fibonacci at the scene you want to analyze or trade. That alone moves the calculation target automatically there. The act of erasing or organizing lines becomes unnecessary.
You can narrow display to only the levels you want to see
The default Fibonacci levels are nine, which may be too many for some. You might only want to see 61.8% and 38.2%.
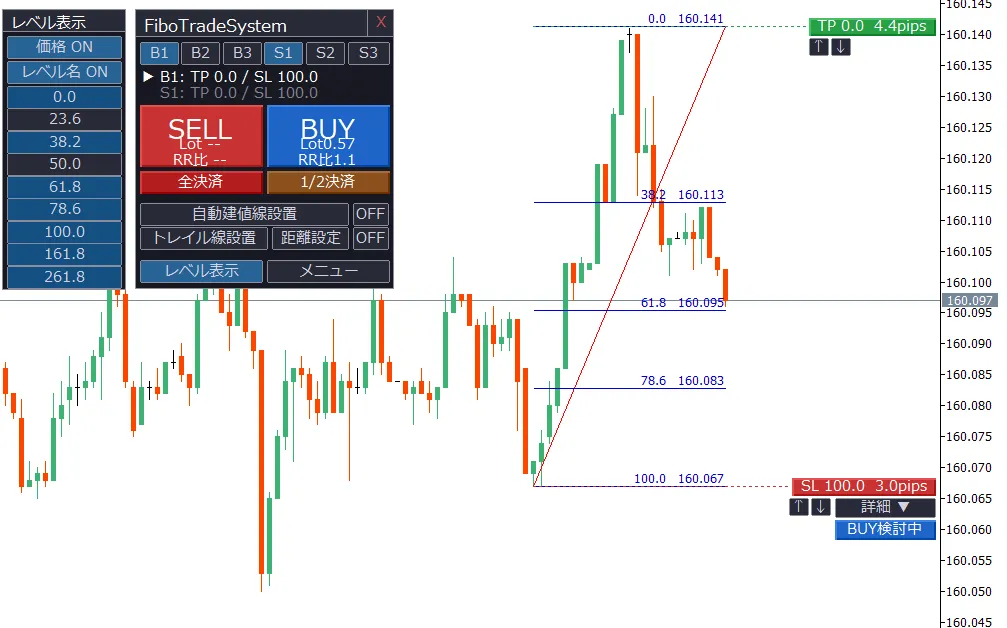
In that case, you can toggle visibility for each level individually. By focusing only on the levels you deem important, you can intuitively switch the display in line with the market. This makes Fibonacci adjustments much easier. The chart will look cleaner as well.
Why I built this tool
I have personally found the process of drawing Fibonacci, analyzing, and actually trading to be tedious many times. I often thought, “If only this or that could be improved to make analysis and trading more efficient and boost performance.” That is exactly why I created FTS.
Actual screens and details of other features are on the product page.
→Fibonacci Trade System (Product Page)
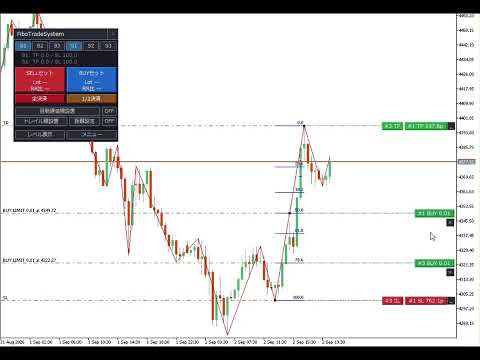
↑ This is the usage video.
FTS Full Feature List
From entry to settlement, here are the features that FTS supports.
Fibonacci analysis / entry
Automatic detection and level composition
Draw Fibonacci to automatically detect and display levels
BUY / SELL three presets
Just switch the TP/SL patterns
Drag-based fine-tuning of TP/SL
Drag badges to fine-tune prices
Market orders / pending orders
Automatically check for TP/SL conflicts before placing orders
Only FTS orders are identified
Does not affect manual orders or other EAs positions
Managed positions
Mini panel management
Check direction, lot size, and profit/loss on the panel
Auto price movement
When a price reaches a horizontal line, move SL to the entry price automatically
Trailing stop
Automatically trail SL as price rises
Lock SL in unfavored direction
Cannot move SL toward increasing losses
Partial/All close
Close part or all of the position with one click
Pre-order calculations
Auto lot calculation
Automatically compute a lot size that fits acceptable loss
Automatic RR ratio calculation
Display risk-reward ratio together with lot size
Time/Event display on charts
Economic indicators display / alerts
Show important indicators on the chart and notify before release
Session display
Show start times for Tokyo, London, and NY markets
JST display
Always show Japan Standard Time on the chart
Usability
Hide profits and losses
Hide current profit in pips to help judgment
Pips size adjustment
Manually adjust pips size according to the instrument
Normal mode
Place orders with one touch without drawing Fibonacci
Screen size compatibility
Panels automatically adjust to monitor resolution
Next
In the second installment, I will write about how FTS can assist you in planning orders.
This time we talked about the "display" of Fibonacci. Once Fibonacci is visible, the next step is to decide TP/SL from there. I will describe what FTS can handle in that scenario in the next installment.