

Limited-time discount: An indicator that quickly reveals turning points in the market!
Are you unable to get that one more step in a trade—do you have such concerns?
This indicator removes the clutter of chasing multiple indicators and points to entry points with a clear criterion of “line intersections.”
It is designed so that anyone can increase a one-click decision that is free from confusion.
First, from the latest performance report!
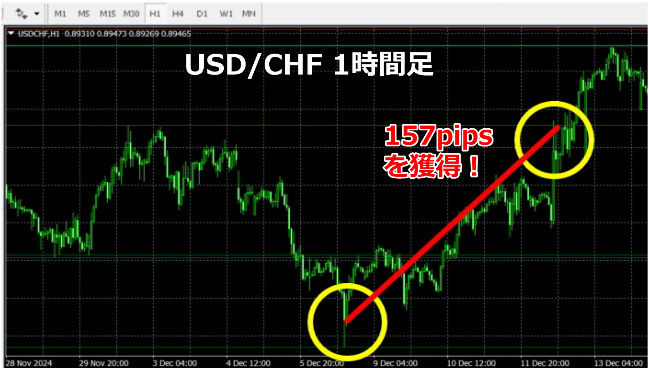
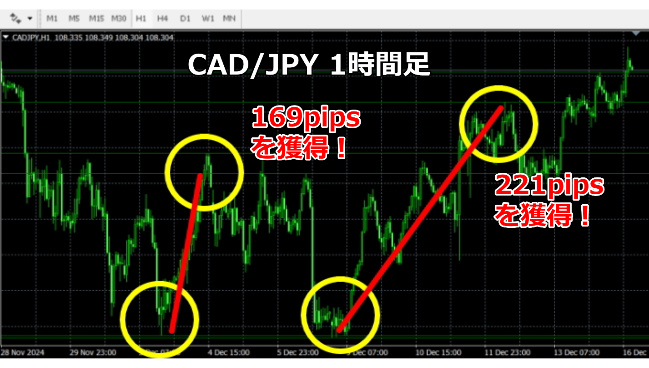
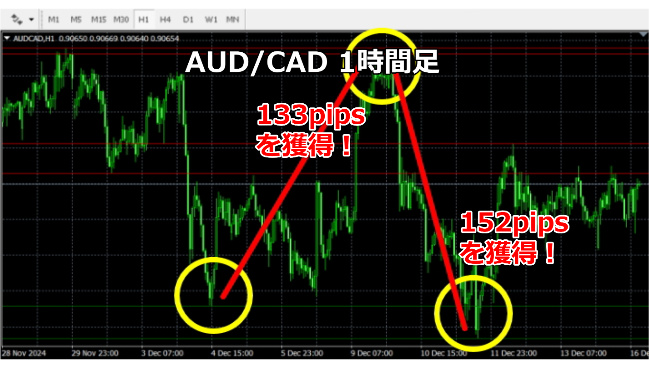
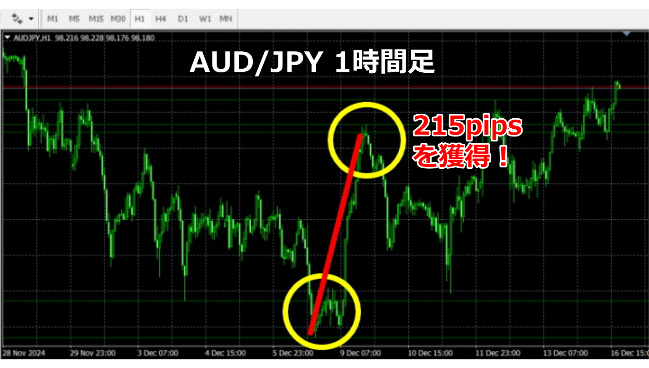
Purchase here ↓
https://www.gogojungle.co.jp/tools/indicators/41737
※This product is for online community members only※
※On November 24, 2023 this product version was updated.
Upgrade contents: addition of alert functionality.
Popup alerts, email notifications, and mobile phone alerts are available.

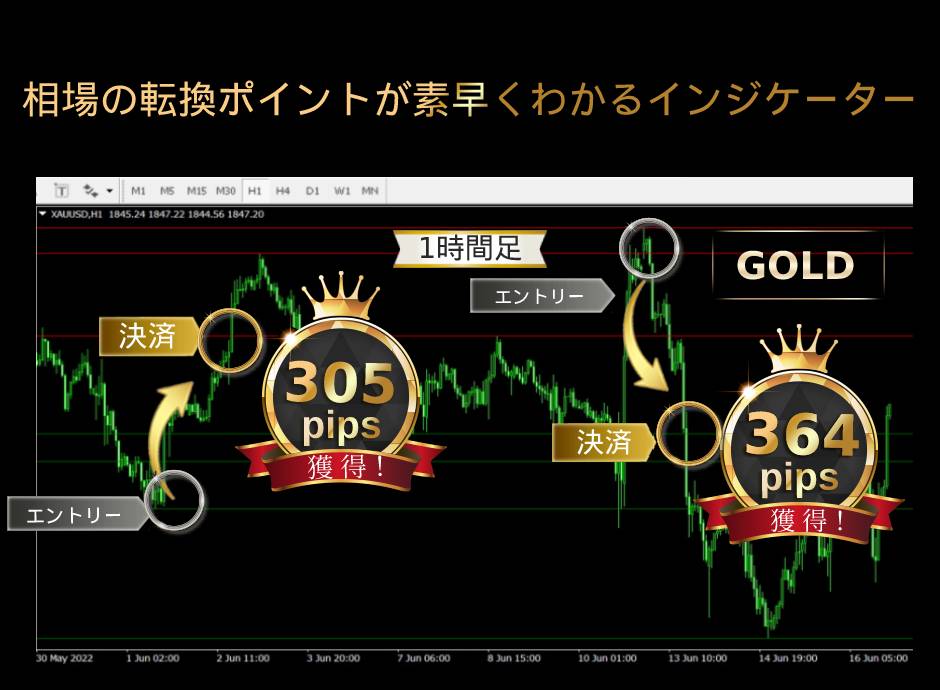
This indicator quickly shows turning point points in the market. When the market turns, it automatically displays important resistance and support lines.
Features of the Indicator
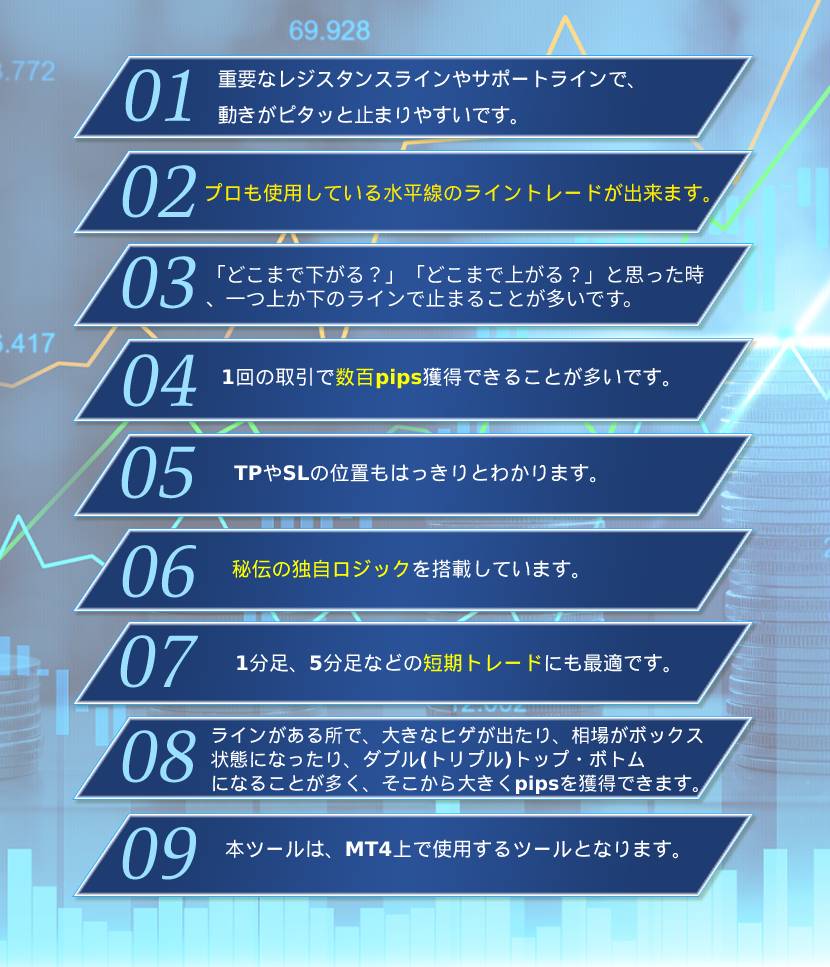
This indicator, after extensive validation across all timeframes and major currency pairs, is designed to produce stable signals in any market condition.
Additionally, performance on the chart is very light, and monitoring multiple currencies simultaneously hardly burdens the system.
By thoroughly eliminating risks of signal misalignment or freezing due to delay, you can trade confidently across multiple windows.
Also, backtests continuously record realized pips and win-rate trends, confirming stable performance that does not rely on a single good result.
Accumulated real-trade data underpin this tool’s reliability.
How to use the Indicator
EUR/AUD 1-hour
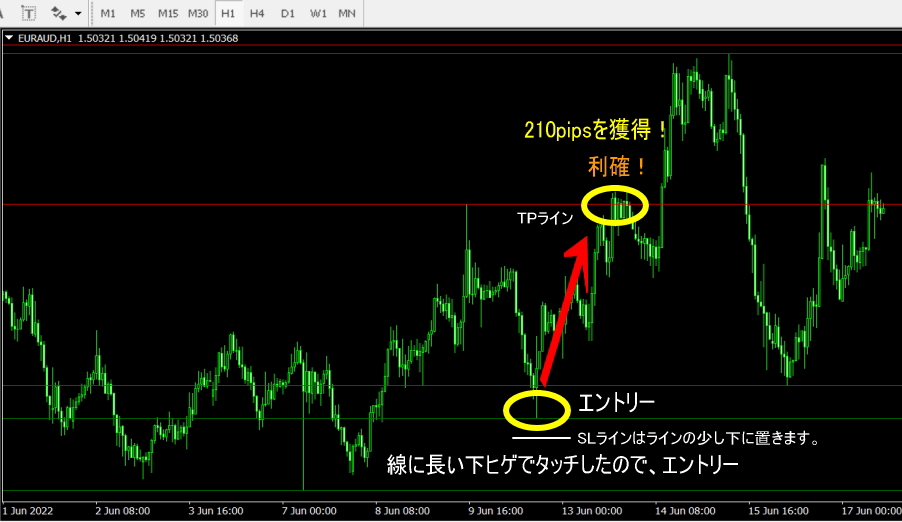
EUR/AUD 1-hour
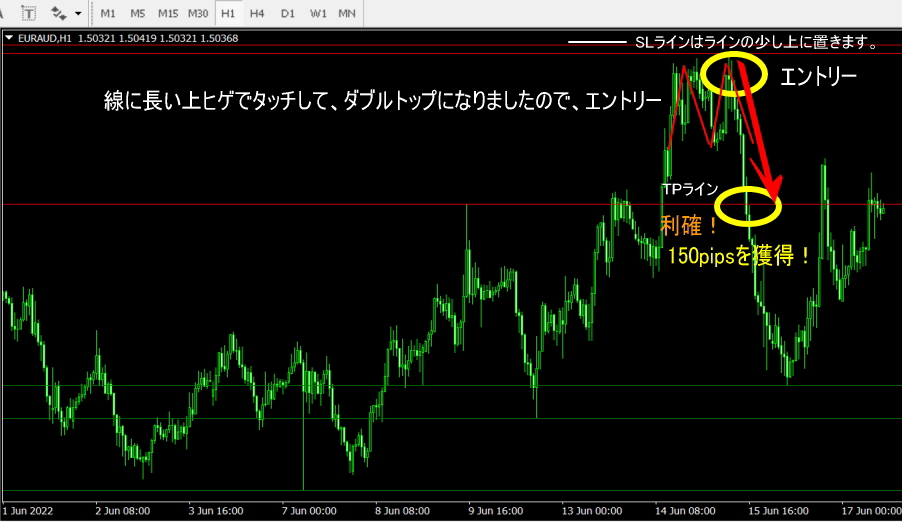
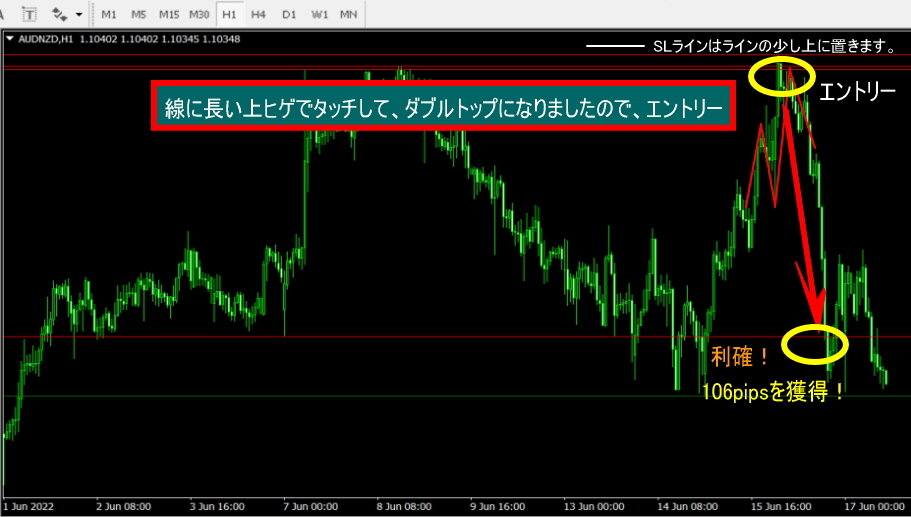
AUD/NZD 1-hour
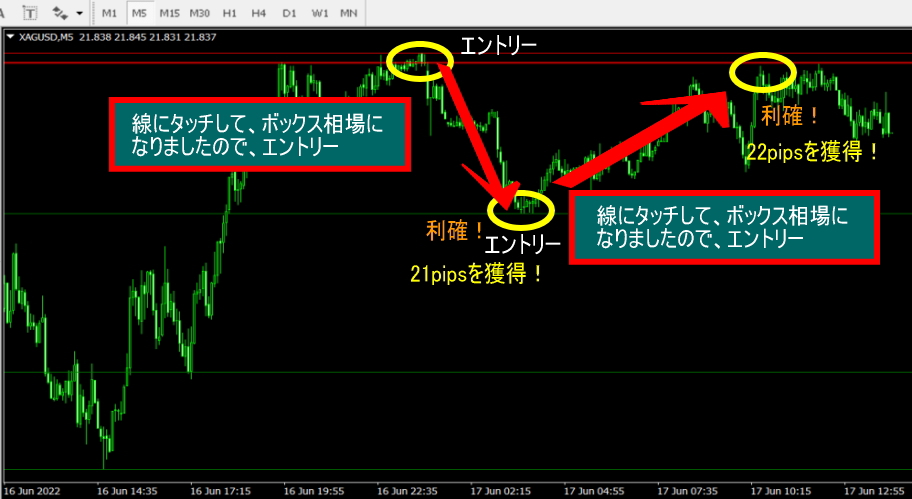
XAU/USD 5-minute
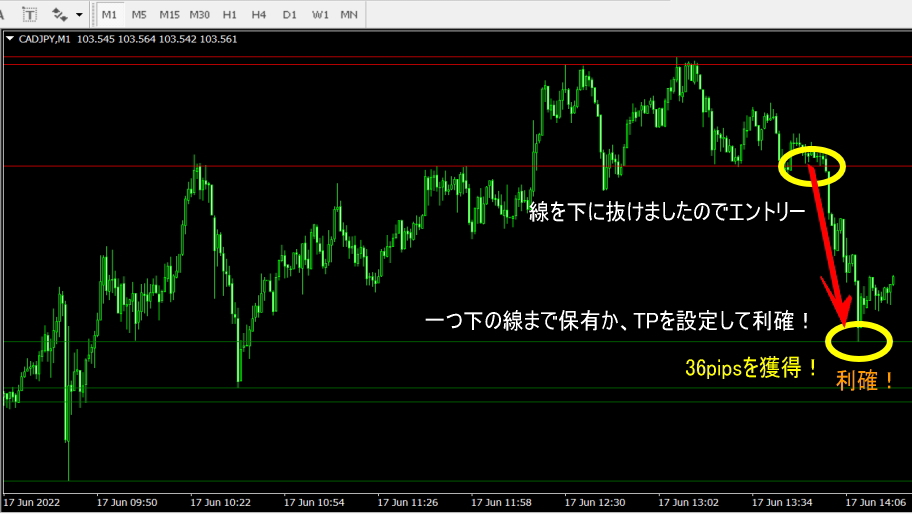
CAD/JPY 1-minute
About the contents of the Indicator
Introduction of SR lines indicator
The product itselfsrlines.ex4is placed into MT4’sIndicatorsfolder, and after restarting MT4, you can drag and drop onto the chart to use it. No special settings or external DLLs are required, installation complete in minutes.
Automatic visualization of “levels the market is paying attention to”
The lines drawn by this indicatorrepresent levels that tend to act as turning points in real markets. When price reaches near these levels, movements often pause, reverse, or change momentum, and it helps decisions such as buying dips / selling retracements / aiming for reversals.
Designed so that seasoned traders emphasizehorizontal lines (line trading), beginners can reproduce them. Indicate where prices are likely to stall and where they’re likely to start moving withvisual justification.
Clarifying the origin of rebounds and breakouts
The lines function as higher-probability zones of support/resistance. When candlesticks touch the line, you frequently seelong wicks, temporary box formations, or double/triple tops/bottoms patterning. These often become signals for a change in direction, and when captured well, you can create opportunities fortens to hundreds of pips.
Note that results vary with market conditions and time of day.Past data are for reference and do not guarantee future profits.
Clear targets for taking profit and stopping loss
Where to take profit and where to exit are crucial points that affect profitability. The SR line visualizes levels that can serve as TP (take profit) / SL (stop loss) benchmarks, making it easier to plan with risk-reward in mind. If you adjust the color and thickness of the lines, you can intuitively manage priorities such as“strong resistance zone / light retracement line”.
“Secret logic” for line extraction without relying on subjective judgement
Instead of simple high/low extraction, it considers both volatility over a period and the distribution of price ranges, drawing attention to zones where market participants tend to focus. This enablesobjective, mechanical line recognition without human bias.
Flexible trading across 1 minute to 4 hours
This indicator supports short-term timeframes like1-minute, 5-minute, 15-minute as well as mid-term 1-hour and 4-hour horizons. It provides stable plotting on major pairs like USD/JPY, EUR/USD, GBP/JPY, and gold, and offersflexible operation according to currency and timeframe.
Winning patterns that occur near the lines
Around the lines or immediately nearby, patterns such asrebounds with long wicks, small ranges, and double/triple tops/bottoms tend to form, and a breakout or reversal from there can producesignificant price moves.
Even in situations where you’re wondering how far down or up price will go, often stopping one line above (or below) becomes a standard for strategy.
Fast performance on MT4
This tool runs on MT4 (MetaTrader4). Designed to minimize drawing load, it remains responsive even when monitoring multiple charts simultaneously. It minimizes chart lag and signal delays, supporting stable operation.
Summary: Build reproducibility with lines rather than relying on intuition
This indicator is not a tool that perfectly predicts market tops and bottoms. However, by pre- identifying levels where price tends to pause or start moving, it eliminates doubt and enables reproducible decision-making. It promotes line-based trading free from emotions. The SR line provides a clear benchmark on your chart.
※ The contents on this page are based on past validation and observation and do not guarantee future profits. Results may vary with market conditions, time of day, and liquidity.
Purchase here ↓
https://www.gogojungle.co.jp/tools/indicators/41737
After purchase, for downloading this product, please check the site below.
→https://www.gogojungle.co.jp/post/1/15817
Also, please check the site below for installation instructions.
→https://www.gogojungle.co.jp/post/1/8212