
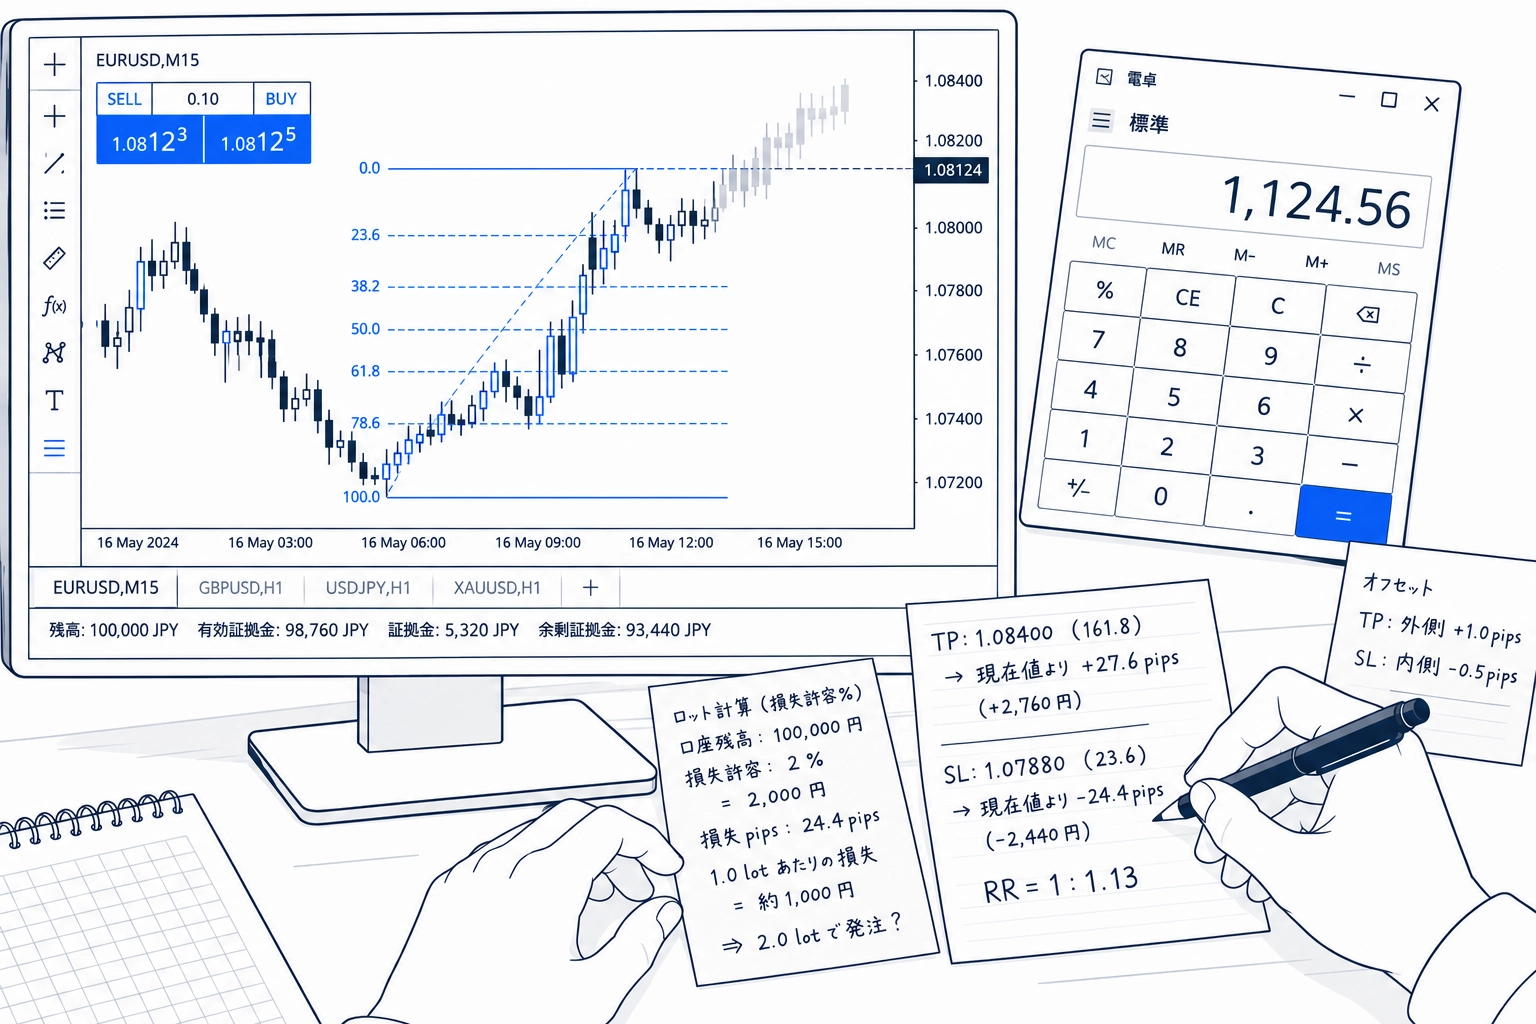
[Fibonacci Practical Notes] Lesson 4: The greatest weakness of Fibonacci is the subjectivity in choosing the starting point.
Where to draw the recent high and low for the Fibonacci
Last time I wrote about what each Fibonacci level means. This time, we’ll start with the basics—where to begin drawing it from.Where to startThat’s the topic.
When you read explanations of how to draw, they usually say to “connect the most recent high and low.” But open an actual chart. There are multiple highs and lows. Which is the “most recent” and which should be drawn? It’s often unclear.
And to make matters trickier,the position of the levels changes depending on which one you choose.In other words, how you draw directly affects profits and losses.
This time, we’ll discuss such “how to draw Fibonacci.”
First, the wicks or the bodies
Here, in fact, it isn’t so clear-cut.Draw to the tip of the wickis a common approach.
The reason is that the price at the moment of hitting a top or bottom is the most salient. The bounce value tends to stay in memory more than the close of the body. That’s the idea.
However, some draw from the body. It isn’t a question of which is correct;what matters more is to unify your approach in your own mind. With Fibonacci, subjective analysis is present from start to finish. The next issue is.
Which wave to choose
This is the main topic.
Suppose you’re targeting a pullback in an uptrend. To draw Fibonacci, you must decide “from where to where the rise occurred.” However, along the rise there are many minor pullbacks. Therefore,which one you choose as the start point is a dilemma.
I’ll give three guidelines for making the judgment.
① Does it look like a single wave?
From the starting point to the high, does it look like one move? If there was a large pullback mid-way, that might be a different wave. As a rule of thumb, there is an indicator calledFractalsbuilt into MT4/MT5, which mechanically identifies higher-highs or lower-lows than the surrounding two bars. If you’re unsure by eye, displaying this can help you get a sense of the wave.
② Is that low visible to others as well?
The reason Fibonacci works is that many traders look at the same lines. In other words,starting from a low that only you can see is unlikely to be effective. It’s safer to choose a clearly visible low that everyone can see.
③ Will it stay visible when you switch to a higher timeframe?
If a low found on a 15-minute chart remains visible on a 1-hour chart, and on higher timeframes, many traders will be watching that level.
However, even with these criteria,the subjectivity of choosing the start point is often cited as Fibonacci’s biggest weakness.Different people can draw different lines on the same chart.
So how much can your choice change the outcome
Let’s put it into numbers.
Assume the same high of 101.00, and try two starting points.
A: Start from the closer low of 100.00
- Wave width: 100 pips
- 38.2% retracement:100.618
- 50.0% retracement:100.500
- 61.8% retracement:100.382
B: Start from the previous low of 99.80
- Wave width: 120 pips
- 38.2% retracement:100.542
- 50.0% retracement:100.400
- 61.8% retracement:100.258
The wave widths differ by only 20 pips. But the 61.8% position differs: 100.382 vs 100.258.There is a 12.4 pips discrepancy. It’s not a small difference.
Just by changing one start point, this much movement occurs.
There isn’t just one correct answer
However, I don’t think the question is which of A or B is correct.
With A, you can enter earlier. But if the shallow pullback doesn’t rally, it may break through. With B, you can enter at a favorable price, but it may not reach that point at all.Last time I wrote that 23.6% is a shallow threshold and 78.6% is a fork between stopping or ending, and the same structure exists here as well.
What matters isawareness of which wave you are watching. I use ZigZag as a reference, and I use the displayed waves as a guide for “the wave I am looking at now.”
If uncertain, I redraw
In practice, when I’m unsure, I draw both. Draw with A to see the levels, then also draw with B. Laying them side by side helps me see which levels are being reacted to. I look at past price action to see where it tends to stop.
If I still can’t decide, I combine other indicators like Dow Theory or moving averages to judge.
However, doing this by hand is a bit tedious. I reread the price. I recalculate the pips. I recalculate the lot size.The seven steps I wrote in Section 1are repeated from the beginning each time you redraw.
Introduction to my favorite tool
The FTС I use automatically follows redraws. When you redraw Fibonacci, both the TP/SL badges and the calculation results automatically update to the new levels.
Because of this, the process of comparing A and B becomes a direct comparison. If drawn with A, the pips distance and risk-reward ratio appear immediately. If redrawn with B, the numbers swap. You can choose which condition fits you best by looking at the numbers on the spot. So the redraws when you’re unsure aren’t bothersome at all.
Since there is no single correct starting point,being able to try as many times as you want becomes a powerful tool for efficient analysisin my view.
The actual screen layout and features are described on the product page.
→Fibonacci Trade System (product page)
Next time
In Part 5,which level to aim forwill be discussed.
Once the start point is decided, the level positions are also determined. However, from there, choosing which level to wait at is another judgment. Enter early at a shallow level or wait patiently for a deeper level. This connects to the “shallow/deep” discussion seen in Parts 3 and 4.