

Understanding "Pivot" by Iwamoto Max: Part 3 [Max Iwamoto]

Max Iwamoto Profile

Keisuke Iwamoto. As the nickname “Technical Analyst with no high school diploma” suggests, he is a rare no-education analyst in the industry. Even in a society where educational background remains strongly influential, he tirelessly works with the FX market where such factors don’t matter, every day. With the feeling of “now that anyone can start FX easily, I want you to acquire the skills to keep winning steadily,” he serves as a writer for serialization and as a seminar lecturer.
*This article is a reprint and revised edition of FX Sokuryo.com February 2019 issue. Please note that the market information written in the body is different from the current market.
Pay Attention to the Relationship Between Pivot Tilt and Price Position
Pivot is a useful technical indicator, but you may already realize that it isn’t simple enough for profits to accumulate merely by breaking a line. Therefore, in this final chapter, we will explain practical ways to utilize Pivot to obtain profits and realize its true value.
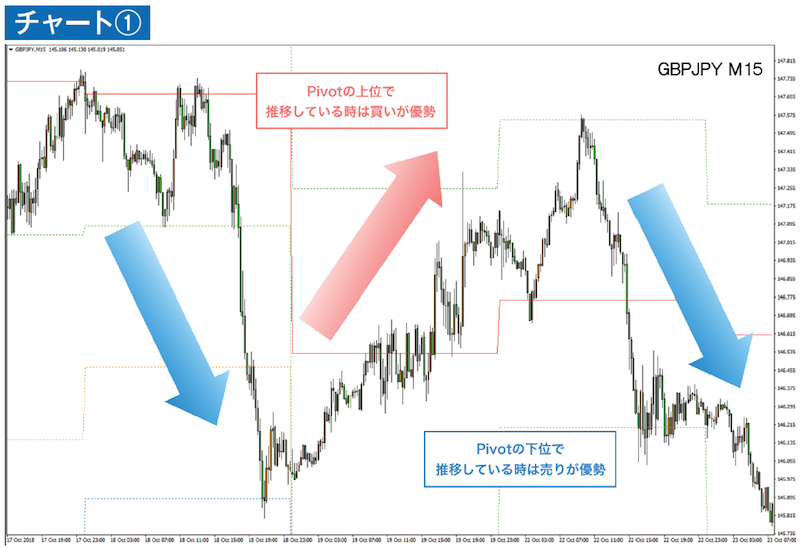
First, the point to look at with Pivot is the relationship between yesterday’s center value Pivot and the price position. If the price is staying above Pivot, it indicates a bullish dominance; if it stays below Pivot, it indicates a bearish dominance, which helps in building trading strategies.
If the price moves above Pivot, focus on finding buying opportunities; if the price moves below Pivot, focus on finding selling opportunities. By performing this very simple segregation, anyone can easily split the market into two, regardless of trading experience, and even when facing seemingly random price movements, you can eliminate hesitation in your trading decisions (Chart ①).
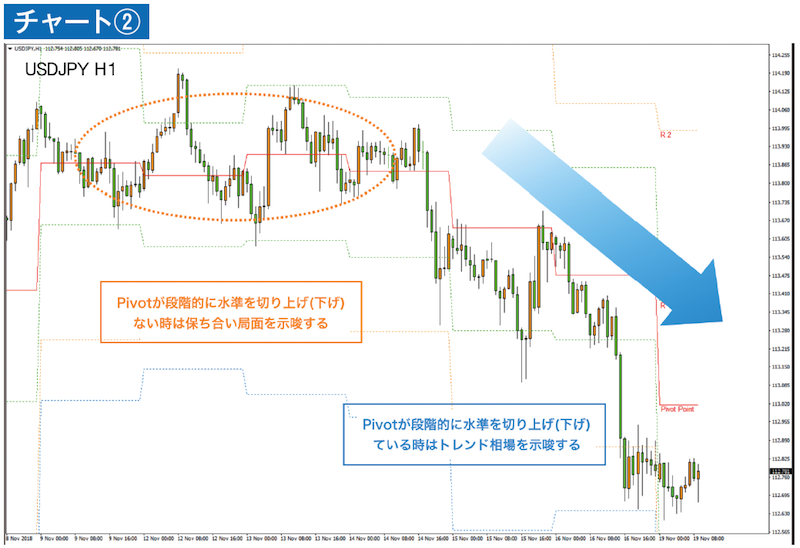
Next is the pivot’s slope. Chart ② is the USD/JPY hourly chart, showing about a week of market movement. In periods where the price continues to decline over a certain duration, Pivot also declines in a stepwise fashion. The fact that the previous day’s high, low, and close averages continue to lower indicates a downward trend. Of course, it isn’t as smooth as moving averages, but through Pivot you can also capture the directional trend over a few days’ price movements.
Furthermore, by considering the aforementioned Pivot–price relationship, you can derive credible directionality from two viewpoints: short-term and mid-term. Also, sometimes Pivot does not move in a stair-step manner and instead fluctuates up and down; in such cases, do not overthink it—recognize that buying and selling are balanced and stay on the sidelines. This is a wise course of action.


